IPO Analysis Part 2: “D” Listers, Frauds, Buy-Outs and Nomads

Summary of Part 1 and Part 2
From a quantitative analysis of 541 IPOs floated on the UK market between 2011 and early 2019, the data shows the following:
- 67% have lost money to date with a median loss of -57%: over 10% delisted with a total loss
- 33% were in profit: with a median return of 60%
- 8.5% (46) were bought-out where 60% returned a median profit of 31% while the remaining were sold at a loss of -25.5%
- Year 1 performance post-placing tends to be overwhelmingly profitable even for shares that go on to delist.
- Evidence shows that the annual listing cost of £200K+ on AIM is a major driver for delisting when liquidity and share price performance is poor
- IPOs with strong growth and long-term potential rarely sell-off and tend to outperform over the period studied: the converse is true for those which delist
Given the typical profitability and chance of total loss, the data shows that IPOs do make good trades with a 25% stop-loss from the IPO placing price yielding profits in Year 1.
Post Year 1 a stop-loss of 25% retains 80% of the longer-term winners and retains the 10% that go on to make high returning investments with a median profit of 190%. The same stop-loss removes 93% of the losers and 100% of the total losses.
A pdf download of this article is available at https://runprofits.
Introduction
Part 1 of this series featured a quantitative analysis of 408 IPOs listed between 2011 and 2019. There were a further 133 IPOs which eluded the datamining processes used in Part 1. Part 2 takes a look at these 133 missing IPOs: almost half had delisted, one third were bought-out while others had changed names, changed markets, gone back to private companies or were frauds. 25% of the 133 yielded a profit while 75% were a loss. These results amplifiy those from Part 1 and confirm the underperformance of IPOs and the risks of total loss of capital owing to delisting.
The costs and effect of being listed are cited by C suite executives as exacerbating difficult trading conditions resulting in delisting. These are broken down further with insights on returns and the aggregate view of the total 541 along with observations on IPOs in general
A pdf download of this article is available at https://runprofits.
Background
Part 1of this series took a quantitative look at 408 placings from a total universe of 541 IPOs brought to market between 2011 and early 2019. 133 companies didn’t surface in the datamining used to produce Part 1. Their absence and their fate has a significant effect on the overall results but their investigation needed a lot more qualitative digging. A note on methodology is included in the Appendix.
While many will argue that quantitative studies of IPO returns bear little significance to individual qualitative analysis of prospectus documents, the very act of being listed has significant effects on the operation of a company. Even good companies have bad times and the scrutiny, share price reaction and management overhead needed to manage these times can prove existential for the future of a company or at least its public listing. This article outlines how many of these companies have delisted with some of the rationale.
Main Findings
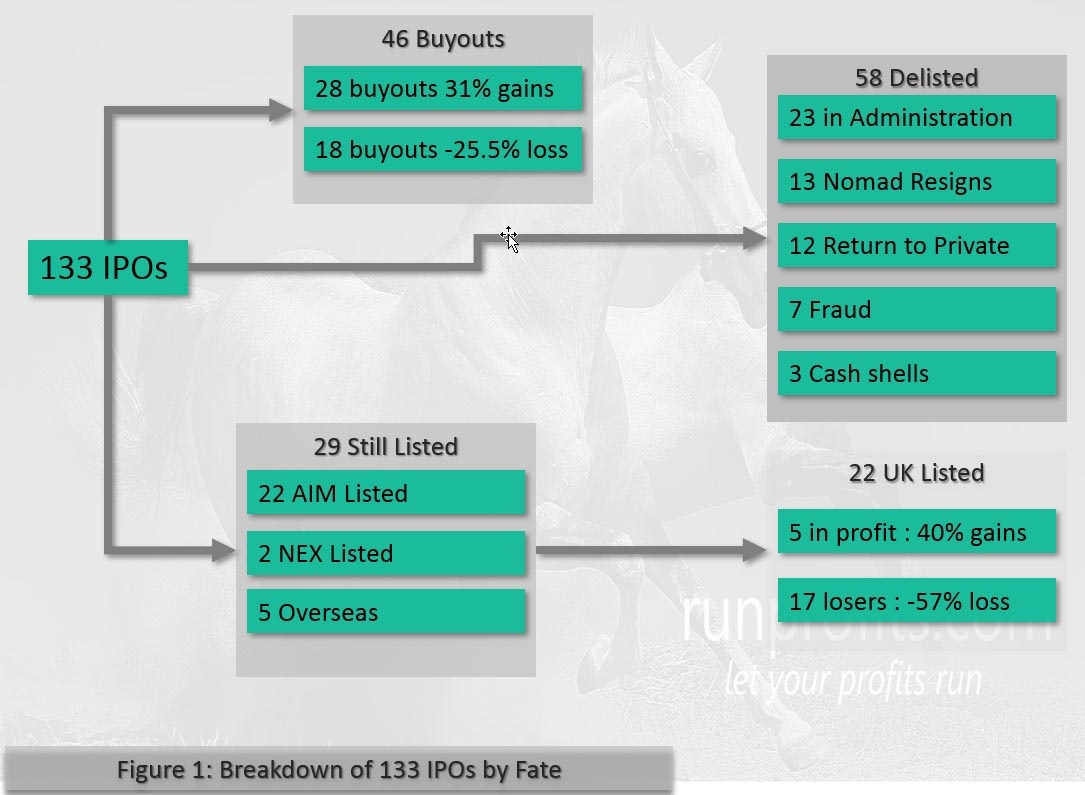
The fate of the 133 breaks down as below and is summarised in Figure 1
58 delisted for a variety of reasons including fraud, administration and voluntary return to private status. 53 of those were on AIM, the others on the main or international main market
46 were acquired: 61% of those profitably relative to IPO placing price with a median gain of 31% with 39% losing a median loss of -25.5%.
22 remain listed on AIM in the UK while 5 are listed overseas. Of those 22, only 5 are in profit relative to the placing price with the remainder at losses up to 99%.
Outperforming price relative to the placing in Year 1 observed in Part 1 still bears out in this subset. Of the 71 IPOs in the 133 of this study for which historical data was still available, 90% of these were profitable trades in Year 1 even as 50% of them went on to delist in subsequent years
Integration with Part 1 and Observations
Part 1 Findings are summarised in Figure 2
Aggregating the results from Part 2 gives a total universe of 541 placings with 199 gainers and 342 losers. The 40:60 gainers to loser split of Part 1 worsens to a 33% to 67% split.
More than 10% of the total universe resulted in a complete loss while only 5% were bought-out at a profit. That number was surprising in itself. Many of the buyouts were enforced and some could be viewed as discounted MBOs using shareholder’s money. The recent mandatory cash offer for Game Digital at 30p versus its issue price of 200p is a case in point of a deeply discounted take-out.
IPOs by definition are very speculative. Assuming their motivations for placing are legitimate and beyond paying-off private equity backers: they are either young companies and start-ups or established companies entering a very different phase of their maturity (expansion, rollout). Given the risk inherent in those ventures it shouldn’t be a surprise that the failure rate is high.
Price action in Year 1 tends to be positive and there is a high probability of making a profit as markets give the new company the benefit of the doubt.
When signs of trouble appear, the reaction can be swift and unrelenting. Unlike more established public companies, there isn’t a body of historical results to fall back on for reassurance. If bad news combines with the need to raise money via a placing then the subsequent fall in share price exacerbates the problems as more shares are needed for the given quantum required: a vicious spiral. When poor liquidity is combined this is a very toxic mix which greatly affects shareholder confidence and market sentiment.
The very act of listing itself brings a new set of challenges to a recently listed company which are not always obvious. The below quote captures comments made time and time again in the final RNS’ of companies delisting. Whereas it is often the private investors who feel hard done by the markets, the same is often true for struggling companies who are punished by the “short-term” markets “unforgiving of failure”. Some may cynically view these as crocodile tears or poor excuses for worse management but the costs are real and the effect of poor sentiment and low liquidity can be disproportionate.
AIM listing costs a minimum of £200,000 per annum in listing fees and Nomad costs. This doesn’t include other costs associated with regulatory, reporting, communication and management overhead. For many companies these costs become unbearable given the benefits.
“The AIM market is expensive to enter and maintain a presence on, draining on management resources. It does not have the liquidity it is designed to provide, as the companies are simply too small. For most it is a waste of time, unless on a rapid growth path. The costs would typically outweigh the benefits and exposure to the potentially fast, short-term, downside is too great. It only takes one bad event and the market will drop you like a stone and you have to tell all your competitors that you are failing. The market is short-term and unforgiving of failure. There is probably more ability to take risks in the private market, without exposure to market scrutiny and where there is longer to get things right.”
CFO Manufacturing Business
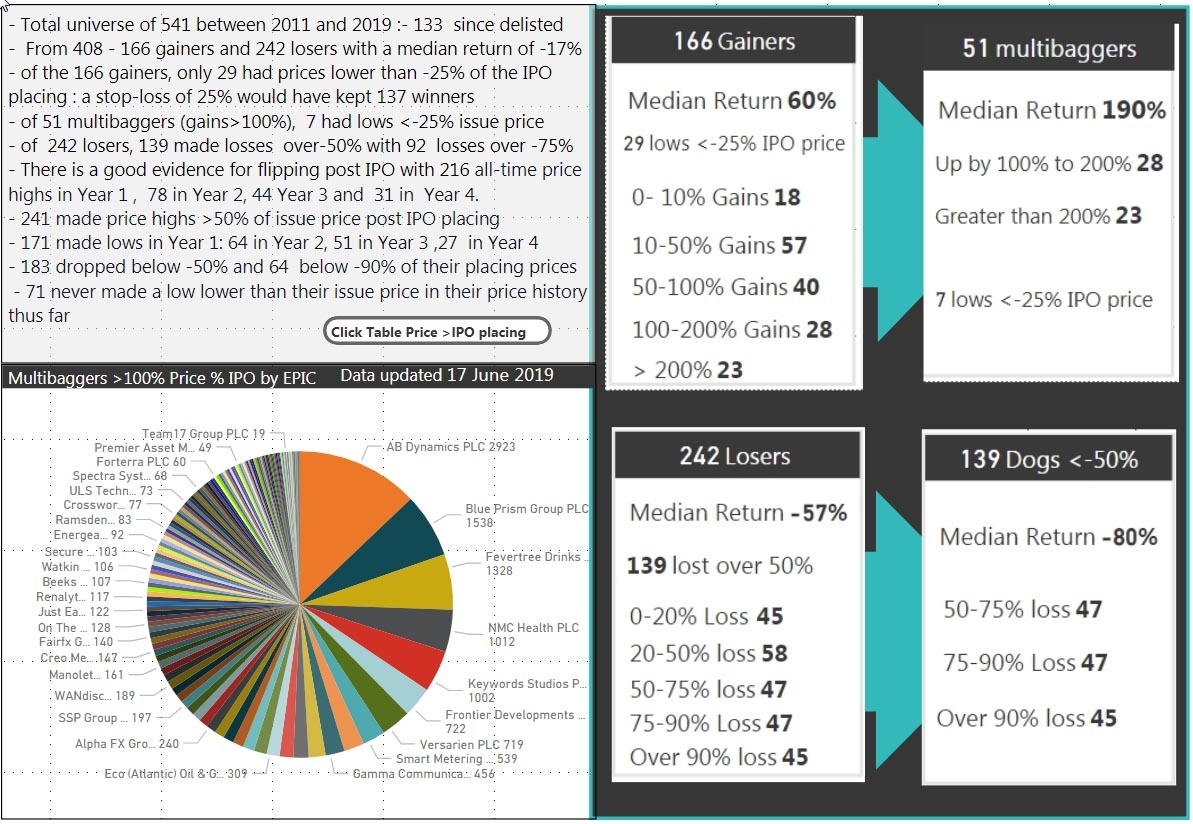
Figure 2: Summary of FIndings from Part 1 of this Series
About Listings
Listing on either the main market or AIM comes with a slew of costs both in initiating and maintaining the listing in direct fees (as well as Nomad fees: see below) and the costs of communication, promotion and reporting. When times are tough for a company, the onus to communicate bad news not only affects share price but can also inform non-public competition of information to their advantage. 94 of the 133 companies in this study were AIM listed as were 55 of the 58 companies which delisted.
- Average cost of floating on AIM costs £250,000 and can be much more depending on broker and underwriting fees. Joining the main LSE costs a lot more (Ref 2)
- Maintaining an AIM listing cost £150,000 per annuum while LSE costs £250,000 pa
- Nomads typically cost over £30,000 per annum to retain with additional fees based on commissions
Given costs this invokes a few questions. If a company is in trouble, how long should it stay listed given the costs and their capital structure? If the rationale for listing was mainly to pay back private equity by bank rolling using shareholder funds these tend to form pump and dumps which delist rapidly (Crusader Resources delisted within 6 months), while cases like Naibu appear to be deliberate theft (its placing price was its all-time high) so cost of listing wasn’t an issue if theft was the motive . Others just run out of cash and support in illiquid markets that seem (to them) to misunderstand their business.
Any company that is dual listed must be given a lot more scrutiny given the costs : several of those which delisted remain listed in their country of origin (FLDS in Taiwan, VMT in Australia, DAMA in Dubai). UK shareholders are normally given the opportunity to hold these shares via brokerages on the foreign exchanges but clearly that adds complexity and cost
About Nomads
All companies on AIM must have a Nomad or nominated advisers. They play an important role in both bringing a company to market and in keeping that company successful while listed on AIM. As such, NOMADs are of variable quality and cost. The LSE sets their objectives as:
- undertake extensive due diligence to ensure a company is suitable for AIM
- provide guidance throughout the flotation process
- prepare the company for being on a public market
- help prepare the AIM admission document
- confirm appropriateness of the company to the Exchange
- act as the primary regulator throughout a company's time on AIM
The loss of a Nomad and subsequent failure to find a new one in the allotted 30 days was the putative reason for the delisting of 13 companies in this study (the reason why the Nomad resigned is often the root cause). A recent study in 2018 has shown that over 150 companies were “forced” off AIM after losing a Nomad in the last decade( see link)
Nomads play an important role in marketing the company whilst on AIM and in generating liquidity and demand for shares. Many of the companies delisting cited a lack of liquidity and poor share performance as their rationale for delisting some even blaming their Nomads describing them as expensive but ineffective salesmen. (Ref 2)
Some companies may even game AIM rules to force themselves off the exchange by losing a Nomad and timing-out on finding a replacement.
Of the 58 delisted IPOs, one Nomad brought 6 of them to market - Daniel Stewart & Co (DAN). Those 6 included Naibu which was a fraud. DAN was also the Nomad for Quindell, another fraud. As of February, this year Daniel Stewart & Co has appointed administrators (Ref). Cleary, some scrutiny of the quality and past performance of a Nomad is another consideration in evaluating an IPO placing especially for reassurance of the quality of due diligence. (the primary objective of a Nomad)
58 IPOs Delisted
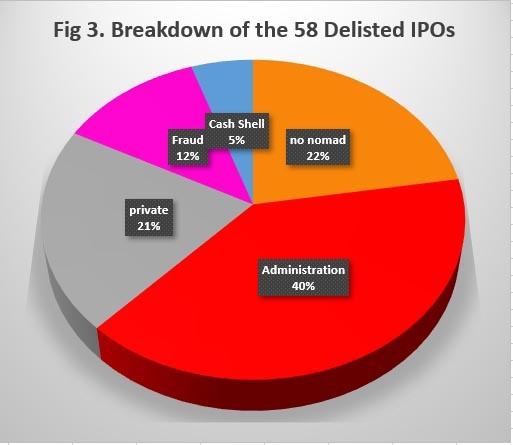
Of the 58 companies that delisted, the vast majority went into administration.
A further 22% lost their Nomad and didn’t find a new one within 30 days: all of these companies were in difficulty prior to this.
Of the 21% that returned to private listing it is unclear if shareholder funds were returned but it is unlikely. No attempt was made to track these down. I have appended an example of a company that went private following a Nomad resignation as a scenario.
‘Dirty’ Cash Shells
These result from sale of the business or assets and are allowed 6 months from the date of the sale to acquire another business or to reverse takeover. Placing by reverse takeover avoids the lengthy and costly listing process and does provide a quick route to market for acquiring companies. If after 6 months no business is acquired or reverse takeover effected, a cash shell must delist and cash should be returned by extraordinary dividend.
Rex Bionics which originally placed at 180p in 2014, failed to raise further funds needed and delisted as a cash shell in 2017 having sold the business to an Australian subsidiary, Rex Bionic PTY which still operates as a private company. Following the resignation of Rex’s Nomad in May ’17, Rex delisted under AIM Rule 1 with no plans for off-market dealings of their shares.
Frauds
Frauds included Naibu which caused some controversy in its time: Paul Scott correctly spotted their shenanigans even as other analysts touted their wares . The Chinese directors are alleged to have walked off with £150m while their Nomad Daniel Stewart was at the receiving end of litigation. Patisserie Valerie was less easy to spot and is the subject of ongoing investigations. Owing to the litigious nature of this area I avoid making comments or judgements on these or others.
“The business had to delist as it was unable to ride out the storm of failure to meet its rising debts. Once the market caught wind that it was in trouble, the business had to make a number of announcements. Each of the four announcements cost £25k, so within a short period of time it had cost £100k plus just to keep the market informed of the company’s attempts to keep afloat. Eventually it became too expensive to remain on the AIM exchange and the board and shareholders agreed that the best course of action would be to delist and sell the travel company in order to pay off/transfer debts.” CEO of Event Management business
46 IPOs Were Buy-Outs
Turning to those acquired or bought out this doesn’t necessarily mean a happy ending to the placing. Some were takeovers with partial cash and share offers (Quantum Pharma) or all share buys (Virgin Money). The chances of getting taken out at a profit turned out to be almost a coin toss with 60% bought at a profit with a median return of 31% while 40% were taken out at a loss with a median return of -25.5%.
22 IPOs Remain Listed
Of these 22 still listed on AIM : many didn’t show in the datamining work of Part 1 as they had changed names so Lakehouse became Sureserve, Mopowered became MPorium and so on. Two have moved to the ISDX while two other dual listed junior miners are now listed on the ASX only . Given the dire performance of this subset, it is pretty clear than many changed their name to distance themselves from their own past performance. The median return of the 22 currently listed on UK AIM markets is -49% only 5 are in profit and 5 have lost more than 90%. Of the 80% losers the median return is -57%.
A Few Delisting Red Flags
Below are a few observations on precursors to delistings which may prove portentous
- Stake building to a 30% + level by potential vulture funds : once 30% is exceeded a mandatory cash offer can be triggered.
- Shares where 75% or more of the float is held in a few hands or institutions. These situations not only result in poor liquidity but effectively mean full control of the company rests in relatively few hands. This can result in selling-off or taking a company private for a very low value to the detriment of private investors under Rule 39. Low liquidity can cause disproportionate swings in share price from relatively few sales or buys.
- Dual listings given the cost need to have very good reasons
- Quality of the Nomad and past performance is worth looking at, if only to avoid “accident prone” Nomads like Daniel Stewart & Co.
Conclusions
While Part 1 of this series showed that IPOs are high risk ventures with typically poor returns of -17% for the 408 studied, Part 2 succeeds in amplifying this further and underlines how precarious investing in IPOs can be.
Almost half of the IPOs in this study resulted in a total loss of investment as companies delisted by going broke, going private, going bad or going elsewhere. Many of the 22 that remained listed on AIM had changed names in an apparent bid to distance themselves from their pasts. Finally, even the expected happy ending of being bought-out turns out be to be less than rosy with 40% of those being sold at a typical 25% loss
There is no doubt that good money can be made by taking positions in IPOs, great care needs to be taken in doing more than trading these. Attempting to become a long-term investor in a short-lived company can be detrimental to your capital and applying value-based investing strategies like averaging-down is hugely risky given failure rates. The irrational nature of markets is equally true for struggling companies as it is for investors.
Part 1 shows that good trades in IPOs also convert into great investments by adding to winners as they scale. The very best multibaggers rarely put a foot wrong and a 25% stop-loss from the placing price locks-in 83% of the winners (137 of 166 winners) while removing 93% of the losers. By extension that stop loss would have ruled out 100% of the total losses detailed above. The data from Part 1 and Part 2 show that IPOs are less about investing and more about trading until soundly proven otherwise.
A pdf download of this article is available at https://runprofits.
Appendices
A1. Methodology
Unlike Part 1 which was heavily based on datamining and quantitative analysis, this current piece needed qualitative assessment of the fate of each IPO. In some cases that was parsing a name change while for others it was checking what happened and when via RNS. As a consequence, the set of analytics is different with less data to draw on in terms of all-time highs/lows, date ranges and analyses of when highs and lows were hit. A partial data set of 71 of the 131 was available which allowed some analytics. For the purposes of this exercise these area taken as representative of the total set. There were no selection criteria other than the availability of the data (and not an availability bias). Pragmatically, doggedly pursuing the remainder is unlikely to shed more light given the effort. The findings echo those in Part 1 and do confirm observations in the larger set which adds confidence on their representativeness of the 71
A2. Cameo of a Lost Nomad
One cameo of this process is Cloud Tag for which I had an interest (and a short position) so I know something of its fate in detail. Cloud Tag came to the market in 2013 and went private in 2017 having hyped, but never produced, a wearable heart monitor that was supposed to beat all heart monitors (despite the glaring barriers to entry, competition, differentiation, development ,marketing costs etc ). The company at time of writing still exists as a private company and also under the Onitor name and still has investors haunting share chat rooms discussing their investments: Cloud Tag has promised a return to listing though not specified when. Audaciously, the company raised an additional £550,000 in a placing less than 6 months before delisting before a bizarre final few months featuring frantic exercising of convertible loan notes and warrants (with further massive dilution of the existing shareholders and further crash in share price): the promise of a firm product order from a company called Second Chance Ltd ( I kid you not!) , a suspension, restoration, change of registered office to a PO Box in the Caymans before the resignation of the Nomad (possibly from exhaustion or confusion) and then a delisting under AIM Rule 1: no Nomad. It has to be said, anyone holding shares throughout that tirade of tragedies is unlikely to give them up over a mere delisting into oblivion. While markets can be cruel and random at times, that was a fairly concerted death spiral with ample warning signs to get out with some money and a bit of dignity
Ref 2 : Dep for Business and Innovation Skills Paper No 126: Investigation into the motivations behind the listing decisions of UK companies, Aug 2013
Disclaimer
This is not financial advice. Our content is intended to be used and must be used for information and education purposes only. Please read our disclaimer and terms and conditions to understand our obligations.
14 comments
Albert Technologies (LON:ALB) adds itsellf to the "D" Listers
IPO'd in Nov 2015 at 133p
Currently at 2.5p having opened down over 80% today the directors comment on Albert Technologies (LON:ALB) progress and cite its listing on AIM as "negatively impacting the company's business"
They've run out of money and the collapse in share price doesn't make for raising much through placings
It's another Israeli tech company gone bad
Thank you immensely @dscollard. You have made me a wiser investor.
Excellent add on to the first (excellent) article ds.
[For the avoidance of doubt - I like it ;-) ]
One thing you covered in the first article was that the majority of stocks seemed to have their best performance in the first year of listing and on average beyond that performance was less positive.
Implicitly your information on when the 'high points' were reached suggested that (share price) performance deteriorated over time - at least for the first four years.
Given that you study 'only' covers 8 years of IPOs, I wonder how many are still in their early years and therefore may in fact be making your analysis of outcomes overly optimistic?
(I was particularly prompted towards this question by a post today on SCVR - describing a company as one of the "good" IPOs - given the company only listed scarcely listed 6 months ago, this seemed quite premature.)
Another consideration that would be of interest (although possibly quite hard work to determine) would be any split in performance between 'young' companies and 'well established' companies. The latter camp I would imagine (possibly wrongly) would be dominated by previously listed companies taken off market by Private Equity to be later relisted after being rescued - but often pumped full of debt (and often relisting at a time when the markets are bubbling with confidence).
I'm not sure that I feel particularly positive about either group to be honest, but they are very different propositions and it would be interesting to understand whether there is any difference in general outcomes.
@Gromley
Given it is 541 companies it is a mile wide and an inch thick though that was the original intention.
As you say not only is there only 8 years but there is a distribution of ages within it so the IPOs are at different levels of maturity.
If I do a Part 3 ( Part 2 was tricky and overly time consuming) I'll probably sub segment into the very best and worst to go deeper on each segment and see if any commonalities arise (level of debt is probably a big one). That might allow a checklist of what a “good IPO” starts to look like
On outperformance in Year 1 and subsequent years: one commonality with the best performers is that they had/have super momentum which was conserved . Most never reverted to the IPO placing price or below. This has the basis for a rule which doesn’t need the left side of the chart as it sets the conditions for the right-hand side
I’ve let the data lead this one so I invite robust challenge: I literally don’t have a dog in the fight
Why on Earth does it cost £25k to issue an RNS announcement, as stated by 'CEO of Event Management business'? That seems disproportionate. Is anyone able to validate that figure?
Agreed but I don't think it as just an RNS cost but the cost from their Nomads which could have included PR costs etc : it is lifted from a UK Government report. Below is the reference I lifted the quote from
Ref 2 : Dep for Business and Innovation Skills Paper No 126: Investigation into the motivations behind the listing decisions of UK companies, Aug 2013
Belated thanks for the reference to the Government report, dscollard - and for the great work that went into these articles, which is much appreciated.
The report is worth reading (only a few pages are about listing) and is available to download from https://www.bl.uk/collection-i...
Below is the source for the £25,000 figure to issue an RNS however the sample size is three companies and only one of these was on AIM, So I'd want to know if this reflected individual circumstances. As dscollard says, this must be an all-in cost including legal vetting and PR support.
Some other quotes that sum it up well:
Management at two of my holdings Sosandar (LON:SOS) and Van Elle Holdings (LON:VANL) might echo that. Sosandar just listed too early in its development (in my view) and Van Elle was a well-established private company that received investment from BGF (the vehicle that invests in small business equity, owned by the big UK banks) and listed in part to provide an exit. Both sets of management would probably say that markets focus too much on the short term, which is why the share price can be irrationally high or low depending on recent newsflow that does not change long-term prospects.
Thanks - a very useful analysis.
You have analysed the performance from the IPO price. Have you looked at the performance for anyone who bought on day 1 after the IPO - say at the closing price for day 1? That would be interesting for those of us who don't have pre-listing access to many IPOs.
all of the data used in Part 1 can be accessed at
https://runprofits.com/2019/06...
Click on Open Report in the Artcle will launch the data report which is full interactive
(uses Microsfot Power BI but it is pretty intuitive)
The base data includes the Open Price for the first trading day , I didn't mine for the Close Price and I have canned this piece of work as it took a lot longer than I had planned but was fascinating to do at the time
below is a partial grab of the data
This is really great! Thanks very much. One question on Naibu:
"The non ex directors are alleged to have walked off with £150m while their Nomad Daniel Stewart was at the receiving end of litigation."
Is this a typo? Is there a source? £150m is a huge amount!
It was £150m allegedly but I don't think it was the Naibu NED's who got the money, at least not UK based ones.
"The non-executive directors of a Chinese sportswear company, whose founder and production boss both vanished along with £150 million, are weighing a lawsuit against the City advisers who floated the firm on AIM"
https://www.standard.co.uk/business/court-case-looms-over-naibu-s-missing-bosses-a3570596.html
https://www.law360.com/articles/1084622/uk-adviser-fights-chinese-co-s-185m-negligence-suit
Danierl Stewart got sued for it so it may well have been instumental in their downfall. Quote is from the legal briefs as I am not keen on giving opinons on litigation
Paul Scott did some indepth analysis so it should be in an SCVR from around then
Excellent article. I had not realised just how expensive and precarious a listing on Aim can be.
That’s a fascinating account with much to be learnt from it. Thank you for putting all the effort into producing it. I will read it again over the weekend.