SIF Folio: A new strategy for selling shares (part 1)

I want to become a better seller. I’m sure many of you will agree that choosing the right time to sell a share often seems harder than knowing when to buy it.
Indeed, I’d suggest that having a good strategy for buying but no clear process for selling is a common weakness among investors.
At a portfolio or fund level, there are two ways of making money from stocks. Firstly, you need to buy some winners. But equally importantly, you need to minimise the impact on your portfolio return from the inevitable losers.
Over the last year, I’ve tried to address the second of these requirements by introducing two new rules to the SIF folio:
These rules have already been put to the test, with good effect. After Centamin’s gold mining plans went awry recently, I sold the shares from SIF for a -27.5% loss. At the time of writing, CEY shares are down by more than 50% from my original purchase price.
Note: If you’re interested in understanding more about the statistical evidence supporting my profit warning rule, I’d strongly recommend Stockopedia’s The Profit Warning Survival Guide ebook. This provides excellent statistical evidence on the benefits of getting out quickly when trouble appears.
These new rules mean that my approach to selling losers has evolved considerably from my original approach of only selling after nine months, regardless of any running losses.
However, when it comes to selling profitable holdings, I haven’t really made any changes to my system since I launched SIF in April 2016.
What I do now: At present I sell shares after nine months if they no longer qualify for my SIF screen. This is the screen I use to select shares to buy. If stocks do still qualify for the SIF screen after nine months, then I keep them in the portfolio on a rolling one-month review.
This approach has certainly helped me to lock in some gains in the 4.5 years I’ve been running the portfolio. SIF is currently up by almost 30% (excluding dividends) since its inception in April 2016.
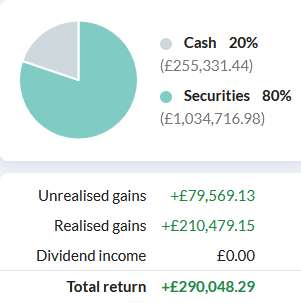
SIF virtual fund at 16 November 2020 (Value at inception: £1m)
Including dividends, SIF is up by more than 40% since inception.
However, using my buying criteria to govern my selling decisions has also caused me to miss out on some opportunities for big wins. Here are a few notable examples from the last year:
Company | Actual sale result | Price gain if held until 16/11/2020 |
+65% (04/12/2019) | +105% | |
+5% (30/06/2020) | +179% | |
+22% (30/06/2020) | +46% |
In the interests of transparency, you can see a full record of all completed SIF Folio trades in this Google spreadsheet.
I’ve started to believe that using buying rules to select stocks for sale isn’t ideal. I need a separate set of criteria to judge when I should drop a stock from the portfolio.
This week, I’m going to explain the broad strategy I plan to take. In a follow-up piece in the next few weeks, I’ll lay out my new selling rules in detail and explain how I’ll run the portfolio from now on.
Selling shares: possible strategies
A rule of thumb I’ve often heard mentioned for selling shares is to ask whether you’d still buy them today. This is the principle which lies behind my current selling process.
I think there’s some merit to this approach, but I can also see some downsides:
Using the same valuation measures to buy and sell shares means that you cap gains from re-rating;
If a stock’s quality metrics or growth rate have improved, this may justify a higher valuation without any extra downside risk;
The trend is your friend - stocks with strong momentum scores can keep rising for longer than you might expect
In short, I think I may be letting the best stocks go too soon. That could be costly.
I’ve decided that what I need is to develop a set of criteria to use for identifying which shares to sell. I want these to help me identify stocks where the risk/reward balance is unfavourable. These are shares that I should be seeking to dispose of.
As far as I can see, there are two options which make sense.
StockRanks: I’m a big fan of Stockopedia’s StockRank system and have great respect for the results it’s achieved to date, which you can view here. Ed Croft’s NAPS portfolio is another great illustration of how well this system has worked in recent years.
However, I don’t want to end up making SIF into a pseudo-NAPS portfolio. I don’t think that would be very interesting or educational. For this reason, I’m not going to use the StockRanks to directly select which stocks to sell. What I may do is use them to order potential sale candidates, as I do in my buying screen.
A new set of rules: What I’m going to do instead is to devise a new set of rules that are designed to invert the qualities I look for when buying shares.
These new rules will cover all three of the major factors: Quality, Value and Momentum. Here are a few examples of the factors I expect to include:
Quality: Deteriorating profitability, poor cash generation or rising leverage. Another risk may be if there’s an increased divergence between valuation and quality. I don’t want to pay BMW money for an old Dacia.
Valuation: Pricing that’s not supported by historic or forecast earnings growth.
Momentum: Evidence that price momentum is weakening or that the outlook for earnings is deteriorating.
Finding the right balance between leniency and severity may not be easy. I don’t want to hold onto indifferent stocks too readily. What I want is a systematic way to identify good companies that have the potential to keep delivering.
Should I really change the strategy?
When I launched the SIF Folio in April 2016, the remit I agreed with Ed was to try and beat the market with a rules-based system. I’ve succeeded so far, but I believe it’s possible to do better while staying with my original rules-based approach.
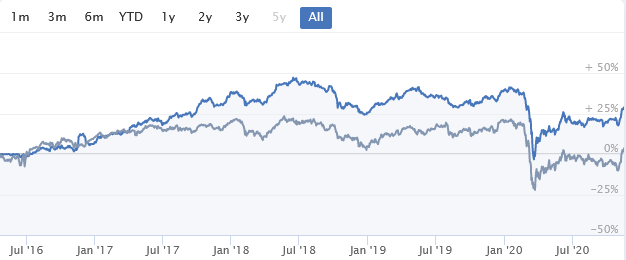
SIF (blue) vs FTSE All-Share index (grey)
There’s also a second reason why I’ve decided to make a change. There are many valid approaches to investing, but I think it’s important to choose one that you’re comfortable with. Without this, my experience suggests it’s harder to make consistent decisions and to have the commitment needed to ride out difficult periods.
I’m becoming increasingly uncomfortable with the high levels of churn required by my current process. In some cases, it feels like I’m selling good stocks against my better judgement, for no reason other than a marginal statistical anomaly.
Although the main SIF folio is a virtual fund, I run a mirror portfolio in a real-money account. So I do have skin in the game and a strong motivation to do better.
I accept that in making changes to my system, I will alter the character of the portfolio slightly. Most obviously, I could end up holding onto stocks for several years, whereas previously this was very unlikely.
However, I see investing as a process of continuous learning and evolution. I think it’s time to try and take another step forward.
At some point in the next few weeks, I will finalise and share the details of my new selling system in the second part of this article.
In the meantime, I’d be very interested to hear your thoughts on the thorny topic of selling shares.
Disclaimer
This is not financial advice. Our content is intended to be used and must be used for information and education purposes only. Please read our disclaimer and terms and conditions to understand our obligations.

45 comments
Hello .
Congratulations on your progress thus far.
IMVHO , a stop-loss system is required based upon what percentage of your total
portfolio's value you are prepared to lose at any given time in any given stock .
Best wishes , Robert .
Roland
From the graph of SIF performance above, it seems that SIF was 40% up in July 2018 and has tracked the FTSE All Share since then. If that's right, do you have any explanation for the early outperformance and subsequent tracking?
Being mostly an income investor, my selling strategy is based primarily on yield. I buy based on intrinsic value and I calculate a buy range (for companies that I understand and believe have a great moat). If a price falls to that range, I buy more as long as the yield is within my target range (which it generally is if I am buying at my buy range and delivers a great yield on cost). The only time I sell is if the yield on current value drops significantly (dividend cut) and there is something very weak in the fundamentals of the business now and in its future (this is rare). I only really invest in 2-3 sectors and diversify within those sectors. I only hold between 5-10 companies in my portfolio, which gives me the bandwidth to dig deep and really understand the businesses that I am invested in. I allocate about 20% of my portfolio value to growth opportunities and my rule of thumb for those holdings is to sell once I have achieved a 30% return - taking 50% of the profits and pushing them into my income portfolio and the rest to allocate to new growth opportunities. If there are no growth opportunities or my income holdings are above the buy range, I park the profits in a Bond ETF until I find one.
maungtooe
Amongst many of the mistakes I make I've found that the most expensive is a bad habit of selling rising shares too early. It's not so much that they've reached a price where I wouldn't buy any more but that they've recovered beyond what I've estimated as a fair price, so I've been selling only to watch them continue to go up. Looking at the Momentum factor and avoiding selling if they have high momentum has helped, but it is harder to track when the momentum starts to drop off (the day job is taking up a lot of time at the moment so my idea of downloading data on my portfolio every day and charting momentum keeps getting put on the back burner). It would be interesting to be able to show the history of the QVM factors on Stockopedia like the overall Stock Rank is shown, especially the Momentum rank.
That's a great point JCPr
For many investors the inability to watch the market all day or even as you say to commit to spend time updating every evening can be a real drawback and can derail otherwise potentially valid approaches.
I have been there and had those problems, Whilst I am largely 'immune' at the moment; a couple of potential projects I am looking at may well present the problem to me a afresh.
I think the answer comes from building you investment approach to match your ability to "staff" it - having an approach that may be theoretically sub-optimal is probably better than one that should be more efficient, but that you cannot execute.
This feels like something deserving of a fuller article , so I will go away and think about that rather than ramble on inanely now.
Just one passing thought though before I go, you suggest that it would be useful to be able to chart historic QVM components (I think this may actually be somewhere in Stocko's development roadmap) but given these components are all to some degree trailing measures, I am not totally sure how they would help you make better real time decisions & actions. Perhaps something that feeds into them would?
Thanks for your response. It's the momentum or the quality dropping off that would be the main things I'd be looking for. As you say, just looking at the quality or momentum factors gives just a snapshot. It's very easy to spot the rate of change graphically.
I have in mind shares where I would delay my selling decisions until the momentum starts to decline rather than trying to apply the rule to all my holdings. Quality decline would be just an extra warning sign.
An interesting thread already here and reminds me that I am overdue an update on my personal when to sell experiment regarding Walker Greenbank (LON:WGB) - I will perhaps get on to that at the weekend.
Spoiler alert : I haven't sold & I am quite happy with that.
Really looking forward to part two of this post to see what Roland comes up with.
I note that most of the (adverse) results in Roland's spreadsheet pre-date the addition on the 25% stop loss rule, which might have cleaned up some of the bigger losers (but also might have messed up some better positions - no way to tell without looking at the points in between!)
I rather think though that maybe this thread should have been better named "A new strategy for holding"
As others have alluded to I think the answer as to when to sell or hold has got to be tailored to the reasons for buying, but I do agree that the "I would no longer buy it" test is overly harsh - if I only bought stocks where I thought there was a 20% upside available, I would see them as soon as they went up 5%!
I am also interested in establishing a selling strategy (there are many options to consider in the posts below). However, I would like to encapsulate those rules into a screen, and then run that screen against my portfolio. But I can't find a way to do it! If I could add a portfolio name to the stock screener, that would work, or have a tool on the portfolio page to run the screen (as is available for individual stocks). This feels like a fairly basic requirement, so I'm sure that there must be a way to do this, but I can't find it. How do other people screen their current portfolio for sell signals?
I follow the minervini / Zanger approach, which is all about timing your entry point (yes, you can time the market!).
Max stop loss 8% at entry.
Sell in chunks into strength. Current approach is broadly to sell a third or one half at 20%+, then trail the rest behind either the daily closes, the 8EMA or the 21EMA.
There is room for discretion based on news and how price is acting.
One thing is for sure - rules help. They help to take the 'decision making' and emotion out of trading / investing, and that's important.
HI Breakout Trader couple of questions if ok, do you make your initial purchase all in one go or scale in over 3 or 4 for example ? and with the 8 & 21 EMA's are they daily or weekly ?
Thanks
Hi Clarea,
I should clarify first that my strategy is based on buying into breakouts from consolidations (bases), or occasionally pullbacks to once of the key moving averages.
Typically I will buy all at once, as price moves through the 'pivot point'. But if there's something which is making me cautious (overall market conditions, or a high volume down day within the base), then I will use a half-size position and look to scale in if the trade is moving well.
I use the daily moving averages for guidance (8ema, 21ema and 50sma), but I will zoom out to the weekly to get more clarity on how price action is looking overall. But the core of my trading is on the daily.
Hope this helps.
Many thanks interesting the buying on breakout from bases this seems to be a common theme for entry points amongst traders with a good record.
From what you are saying would I be right in thinking if you looked at something as an example like ITV which has been breaking up you would wait for another base to form before entering or possibly the pullback to one of the ratio's you mentioned previously.
I'm trying to get my market timing better I guess what I'm trying to say is using this example if you were looking for the first time and the break out was already 10-12 % up on the last base would you wait or still jump in given it was say on a three month high ?
Regards Andy
A sell signal has to be based on why one bought a stock.With Growth and Momentum reasons then one should sell when the growth story or momentum changes.The same applies to Special Situations.With Income reasons when the dividend is cut or stopped.Value is the most difficult one to make a sell decision on.
From time to time over the years I have set up a portpolio of my sells. I put a notional £10,000 worth in a dummy portfolio. Most of the time the sells have outperformed the real portfolio!!!!!!
Good post, thanks. I run a mechanical Stockranks portfolio and have also encountered similar questions over whether and when to sell. My current approach is to sell
1. For any stock, at any time, that suffers a single day fall of 20% or more
2. At the annual, or semi-annual, review point; where any stock rises to be more than 3 x the average for the portfolio, I will sell down to 1.5 x the average even if it still qualifies for the portfolio
3. At the annual, or semi-annual, review point; if the stock has fallen has fallen below 70 (my buy criterion is stockranks of 80+)
As a linked note - I also use the single intraday fall of 20%+ in the last 12 months as a veto on buying stocks, irrespective of stockrank. Indivior (LON:INDV) taught me this lesson, as it suffered repeated shocks whilst still retaining a high stockrank.
The logic of these sell criteria is as follows:
- Ed's prior articles have shown very clearly that stocks that suffer a 20%+ intraday fall tend to continue falling for the next 12 months.
- Rebalancing reduces volatility of the portfolio as a whole, and should not affect returns over the long run provided that the gain is reinvested into stocks which similar characteristics
- Applying a sell threshold that is more relaxed than my buy threshold avoids incurring unecessary dealing costs for companies that are close to being buys.
However, I'm still tinkering with those rules as (the 20%+ fall rule aside) I can't quantify whether these rules really help or hinder returns in the long run.
You mention the ebook on profit warnings - a video of Ed's webinar on this is also available here.
Before that I used to have the attitude described by Logical David in his 'early days' but now, after applying Paul's principle described by Dexx the Dog above I make it automatic.
Example - Synectics - 30/10/19 - "Results for the year ending 30 November 2019 are now anticipated to be materially below market expectations". I sold on the day - would previously have waited for the 'dead cat bounce' (which did happen) but you never know when that might end. To see the full story look at the two year graph at Synectics (LON:SNX)
Hi Roland,
Thank you for a very interesting article and also thank you to the interesting comments from all contributors. I am new to Stockopedia and within the last two weeks I have found my way around well and set up my existing portfolio & watchlists for sectors I would like to invest in next. This is principally for my existing income portfolio but I also would like to set up a portfolios for growth stocks and also for value investing in the near future. As part of the process I am setting buying criteria using information from Stockopedia but having read this article I will now set out selling criteria also.
I look forward to part 2 which I am sure will help me set up selling criteria, I wondered whether contributors thought it would be prudent to have 3 sets of selling criteria for income, growth & value portfolios or whether one set of rules would suit all?
Andy
Thanks Roland for a thought provoking article. I look forward to part 2.
Like everyone else I have sold too soon or too late depending on the direction of travel of the SP. I did for a while use auto stop losses but found if my stop loss was at say 300 the broker sold it at 250 rather than 295, so I abandoned that method.
What I effectively do now is to assign a confidence level to the buy I am making - I guess like a risk/reward assessment but a little less scientific. This tends to be pretty subjective. So if the risk is high the stop loss is 10% ie £cine or lower then the stop loss may be 20 -25% ie £igr .
So it's rules based but with a touch of instinct thrown in.
Steve
Hello Roland,
I think "There are many valid approaches to investing, but I think it’s important to choose one that you’re comfortable with." is very true - otherwise you end up setting rules and criteria that when it matters most you simply ignore.
Personally I think a 25% stop loss is generous, and wonder if that could be tighter. You could also have an initial stop loss on a new position and then a rolling one (possibly tighter) that rises with the position - this might give you more confidence to let positions run.
Paul Scott talks about different types of profit warnings - ones fundamental to the future performance of the business (sell) or one off problems or things that can be fixed (a warehouse fire, bad weather etc) - the latter potentially being buying opportunities if the sell off is overdone.
With a rules based system I've often thought that to avoid excess churn you could potentially have a higher criteria to enter the portfolio but a slightly more relaxed one to stay in - especially if the price action is moving in the right direction.
Regards,
Dexx
Hi Roland, when I initially started to invest in shares last century (aka many decades ago) I learnt the hard way with regards to when to sell a share, and like most beginners I initially made mistakes, because back then I had nobody to turn to for advice or guidance, there was no internet, no forums and no Stockopedia!!
I would initially set a stop loss of 20%, only to watch the share price drop 22% and then go on to make a full recovery and set a new high. Grhhh!
Alternatively, I would then set a stop loss of 25% only to watch the share drop 27% in price, then rise and go on to set new highs. Grhhh again!
As a result I no longer use stop losses.
Likewise, I quickly learnt my lesson when it came to selling on a profit warning. In my early days when I company issued a profit warning and the share price plunged I would hold onto the share, watch the 'dead cat bounce' and then hope and wish for the share price to recover, only for the company to issue another profit warning several months down the line. Grhhh yet again!
Below are the rules which I now use when it comes to selling shares and hopefully they will help todays beginners avoid some of the initial pitfalls which I made, save them money and provide them with much better returns which I now enjoy.
1. Sell when the story changes, such as a big drop in forecasts. As an example, one reader recently wrote about a foreign mining company which he invested in, only for war to break out in that area a few days later.
2. Sell immediately on the first profit warning, don't wait, not even a day or a week to sell. Don't hang around for a second or third profit warning because these will decimate the share price even further.
3. Sell on the first whiff of any financial irregularities/wrongdoings.
4. Sell when both the CEO & CFO leave on the same day or within a very short time period of each other, ie, within a month.
5. Sell when the 'Net Gearing' reaches 100% (under the 'Other Ratios' section).
6. Sell when the 'Net Debt' exceeds the 'Book Value' (under the 'Balance Sheet' section).
7. Consider selling when the share price drops below the 200 day MA.
8. Don't get emotionally attached to a share. Remember shares are for buying and selling, not for collecting!
As people will have seen, and Paul has excellently written about on numerous occasions, when a company's debt is too high (see points 5 & 6), the company either goes bust (debt is the main reason why most companies go bust which means you lose 100% of your money) or the company has to do a rights issue which then dilutes shareholders value or the company has to borrow from the bank, or both. What all of this means is that the company has to pay the bank a lot of money in interest repayments, which in turn means less money to be paid out in dividends to shareholders.
I'm sure I have other rules when it comes to selling shares but the above are the initial points which jump into my head.
Happy investing.
I feel you're missing the point of stop losses. They are intended to protect your capital - for every share that drops 25% then recovers there is another that continues until it's down by 50%. Of course you will sell some shares which subsequently recover, but overall you will probably end up ahead if you apply a disciplined approach to stop losses.
Many thanks john2 for your feedback. I don't have any problems with people using a stop loss system, such as, say, a rigid 25% stop loss for example. What I am trying to achieve with my investment style is to mitigate the loss in the first place and sell the share before the 25% loss is incurred. Hopefully some people will probably agree that part of being a successful (some people may call it smart) investor is not only having the ability to make money in the stock market but also having the ability not to lose money. I am merely trying to be proactive and prevent the 25% loss in the first place. I believe the above helps towards achieving that goal.
The title of Roland's report is called 'A new strategy for selling shares'. The title doesn't mention anything about stop losses, although stop losses can be used as one tool in an investors armoury. I am merely suggesting a 'new strategy' to try and prevent losing 25% of your money in the first place and hopefully some of the above suggestions may prompt investors to think about selling a share before the share price drops.
Either way, I believe my technique of when I sell a share may start an interesting debate which can only be good for conversation and bouncing ideas off each other. Hopefully, it will give investors, such as beginners, some alternative ideas to mull over on how to improve their stock market skills and make more money.
Hi Dave re the gearing point makes sense but just wondering how it factors into a negative gearing figure as an example AA has billions in debt but the ratio has a negative figure showing when I would have thought it would have in excess of 1000% positive ?
Hi clarea, with regards to £Aa, I never would have bought the share in the first place. If I had bought AA then I would have sold it a long time ago. In my initial post I wrote that the 8 rules which I listed were just the immediate ones which jumped into my head.
Going into more detail with regards to the criteria which I use when deciding whether to buy and sell a share, is for me to study the ratio of its Market Cap to its Enterprise Value (shown at the top of the StockReport). If the Enterprise Value of a company is twice the Market Cap then I sell (think of this as rule 9) because in my head the company has reached a level of 100% debt (a little bit like rule 5). For £Aa , its Market Cap is £211.76 million and its Enterprise Value is £2.86 billion , which is a factor of 10. This is more than my 'twice' ratio. Furthermore, when you subtract the two figures, it shows that £AA has £2.6 billion of debt - ouch!!
I also observed a long time ago that £Aa had a negative Net Gearing of -169% and I was, and I still am, perplexed by StockReports and how it calculates this figure because I also expected it to be a large positive figure when looking at the company's Market Cap & EV figures. I put it down to a typo but I could be wrong.
Only one of my rules has to be breached for me to sell. Hence rule 6 would have kicked in because that would have been breached.
Like I say, I would never have bought £Aa in the first place because its Book Value is negative at -£1,562 million instead of being positive and also its Net Debt is £2,644 million.
I see £Aa is down 45% from its 52w High point. Because of my investing style and the selection criteria which I use, I never would have bought this share in the first place, which means I wouldn't have suffered a 45% loss.
Kind Regards David.
It is also an easy way for market makers to pick up shares at a discount.
The prices are not guaranteed, you will often get a lower price or sometimes they won't be sold.
You can buy in but then you can get stopped out again. Does not make much sense to me, selling at a discount and then buying back in at a higher price.
They can take you out of big winners. I did a study on NAPS shares and some of the largest winners you would have been stopped out of if you had 12% stop loss.
I don't rely on preset stop losses - I monitor my shares on a spreadsheet and execute the trades manually. As you say, it is possible to be stopped out at market open and have to buy back in again.
12% is a pretty tight stop loss. The Stockopedia investment club has the following system of stop losses -
12% for Conservative
15% for Balanced
20% for Adventurous
25% for Speculative
30% for Highly Speculative
When Stock Rank goes below 50.
12% is tight for some but wide for others, depends on the shares and how you are trading.
Recently I got stopped out of XP Power (LON:XPP), bought at 4592p, stop loss 3900p, price obtained 3753p, price fell to around 3500p and then bounced back up to around 3900p within an hour and is now 4400p. So I have lost about 20% because of the stop loss. If I had used 20% stop loss I would have lost even more, 25% maybe not got stopped out but it was close. XP Power (LON:XPP) is classed as Adventurous.
As I said above, I execute my trades manually after giving wild price swings time to settle.
That may work better if you can keep an eye on your shares, however with a profit warning or a negative RNS you will likely get a lower price than your automatic stop loss. That's about the only time stop loses have saved me.
So you are not really using stop losses, it similar to an alert system?
That's right. A few years ago I had to repurchase my shares in Compass (hardly a small cap) when an automatic stop loss kicked in at market open. They did not even fall on the day.
Hi
Based on what you wrote (interesting) Halfords (LON:HFD), would be a sell, yet from what i see here in Stocko it's a superstock SR 97 with growing buy analysts consensus and an SP rising. Be curious for your take on this one
Partly the issue is...trying to time a sell at a peak which typically is a spike while buying can happen in extended troughs (e.g. easier after events or share volatility). In my experience, technicals sometimes help you sell into a 1st or 2nd peak ( I don't believe in timing 3rd peaks in a short rally) but honestly it's difficult (bit of a black art, blindfolded it feels). 2ndly a boss of mine always said ''Try leave some money on the table for the other guy''. This at first frustrated me but basically he was saying there's seldom a perfect sale. And he's right I found out.
Sorry - meant Roland !!
Thank you Jack for another thoughtful article.
Would you consider introducing a top-slicing approach ?
I have found that in the market conditions which now seem to be a norm, the severity of volatility can really eat into profits. Top-slicing enables some profitable gains to be banked/put to use elsewhere, makes downside volatility (higher than usual falls) less painful, and crucially, where a stock still holds its fundamentals, it allows for a long-term hold.
Thanks again
Hi nigem2000,
Thanks for your comment. My current approach is to top slice 50% if a position doubles. That effectively guarantees your capital and allows a position to run as pure profit. So far I've not had to do this as the only time I've had a 100% gain was as the result of a takeover bid.
I can see some value in top slicing. My only reservation is that when I've done it personally, I sometimes feel like I'm downgrading my most successful stocks!
Food for thought...
Roland
Indeed, I used to be clueless when to sell and found myself giving back lots of gains or selling too soon.
My buy approach is a mix of fundamentals/technicals.
Sell approach is based purely on technicals, as a share price can rise way beyond what might be considered fair value.
To this end my sell rules are as follows:
- Sell on initial loss of 15% from purchase price
- Sell on major break of trend (trendline, 200d ma, etc), or bearish sell signal such as Head and Shoulders, Double Top, big weekly sell volume, etc.
That's it. So far it has helped me to ride the winners for as long as possible and get out at the first sign of trouble.
Hi wmullen,
Thanks for your comment. I've also found that there can be some value in trend lines when opening/closing positions.
Although I'm not a technical analyst, I have sometimes found useful information about trends/inflection points by looking at chart data and basic technical metrics.
It's certainly something I think about.
Roland
Yes indeed wmullen, ignoring the technical side can be costly for both entries and exits. The trend has to compliment the fundamental strategy, without that any stop-loss strategy becomes meaningless. Just using the basic concept of Stage 2 as described by Weinstein, Minervini and O` Neil is a good start. Your best trendlines are the moving averages, you cannot fudge these, ideally the price above 50, 150 and 200 before considering a buy on the fundamentals.
The market itself is the elephant in the room, more important than the trend of the individual share. Finally the market and hence the trend does not respect or relate to buying or selling at fixed intervals such as holding for fixed periods. Looking at the price action is critical.
I've appreciated the SIF articles you write since they started and it has been educational to see someone sticking to a process for a significant chunk of time. Fully understand the feeling that your approach is good but could be better. I think there will always be the one that got away where we sold where we shouldn't have or didn't sell when we should have. Like you I sold Luceco earlier this year and now realise I would have been better off waiting.
I'll be interested to see what you come up with for the new sell rules and how they pan out. Will you be tracking the new rules against the old ones? Might be a lot of work but could be interesting to know if the change really does result in an improvement in performance.
Keep up the good work!
Thank you for your article.I am new to this game of real investing.However there is still more to learn.These are difficult times for both big and small companies.
Value investing is crucial for the success of the economy and intern beneficial for the investor.When do we sell ,if you need the money to spend or to reinvest.
There is no pattern, the only pattern I can see is QE leading to rise in share prices and investors selling making a quick return.Gold is used to hedge against inflation, no sight of inflation ,the only thing I can see is deflation on non essential items.USA election has changed the tables for brexitiers ,no deal Brexit might not happen.Good or bad for UK economy, difficult to judge.
The only thing that can make things better is political stability and vaccine.Hope it happens soon.
Hi Roland, very interesting article, look forward to part 2
I have 2 main reasons for investing:- 1) To earn more than if the money was sitting in the bank (not very difficult) 2) To give me an interest.
Like most investors i have had some painful losses by not selling earlier so I am going to be very interested in your thoughts/ideas.
Hi Roland,
I would second Ron's comments. I have made pretty much every mistake this year that can be made whilst I have been trying to work out what my own rules are, but it has been interesting and emotional and I am now almost back to breakeven and have 4.5 months to beat a "cash ISA" return...also known as I would have been a lot better off leaving my money with Mr Smith.
On my decision matrix for buying I now have a box which is "When to Sell", which actually came from reading Michael Taylors books which is obviously important if something is just a short term trade, but I realized also applies to a longer-term invest. This includes things such as growth dropping off (multi-year holding), dividend reduced and or cover drops below 1.1, downward trajectory on broker forecasts, profit warning (Thank you Ed!) painful lesson from Card Factory (LON:CARD) and I am also thinking about adding a P/E based one, as I have missed out a lot this year on not selling on the peaks to watch things go up, then crash way down from where I bought e.g. Ig Group (LON:IGG) but then I missed out by selling Volex (LON:VLX) when it started to drop from the peak and then rocketed upwards and I did not admit my mistake and buy back in quick enough.
Keep up the good work as it is very stimulating and useful in forming my own thoughts and rules.
Tommy
Hi Roland,
It is very refreshing seeing you take a new approach to the SIF portfolio, I have only been with Stockmedia for 3 years and have followed your SIF since the beginning and probably being a slightly nervous investor I had often sold quite a few of your stocks before the nine months was up.
This in many cases saved me money because I sold at a profit.
I will be very interested to see the final changes to the portfolio, you a proving to be very progressive with your approach keep up the good work.
Best wishes
Melvyngd
Very interesting article. IJhave always found that choosing when to sell is more difficult than buying them. I have lately tried a very simple strategy in that when the Stockrank falls below a predetermined level, I sell. So far it has performed reasonably well but it is too early yet to determine if I am losing out on potential gains. Looking forward to Part 2.