SIF November review: Oxford Instruments’ tiny tech measures a 65% gain

This week’s month-end review for November is a little late, as I’ve been away for a couple of weeks enjoying some late season sun.
I seem to have dodged a nasty spell of wet weather up here in the north, but unfortunately one of the stocks in my rules-based SIF portfolio did take a bath.
Pawnbroker H&T Group fell by about 15% while I was away, after the company said the FCA had carried out a review of its high-cost short term credit (HCSTC) business - often known as payday lending.
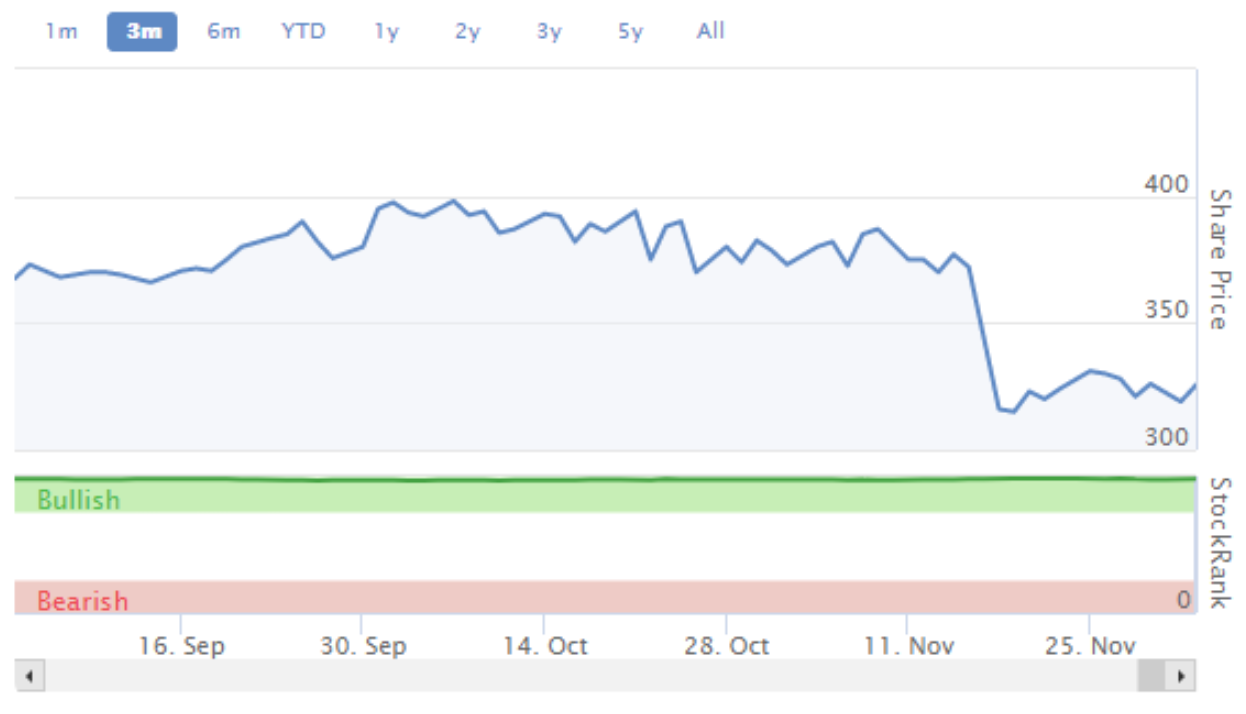
The review followed the introduction of new FCA rules in November 2018. This is particularly disappointing as in August the company said that “minimal changes” would be required to achieve compliance. It now seems this is no longer the case.
If you haven’t seen it already, I’d recommend a look at Graham Neary’s excellent analysis of this situation in SCVR on 18 November. I agree with his conclusion that the impact should be manageable.
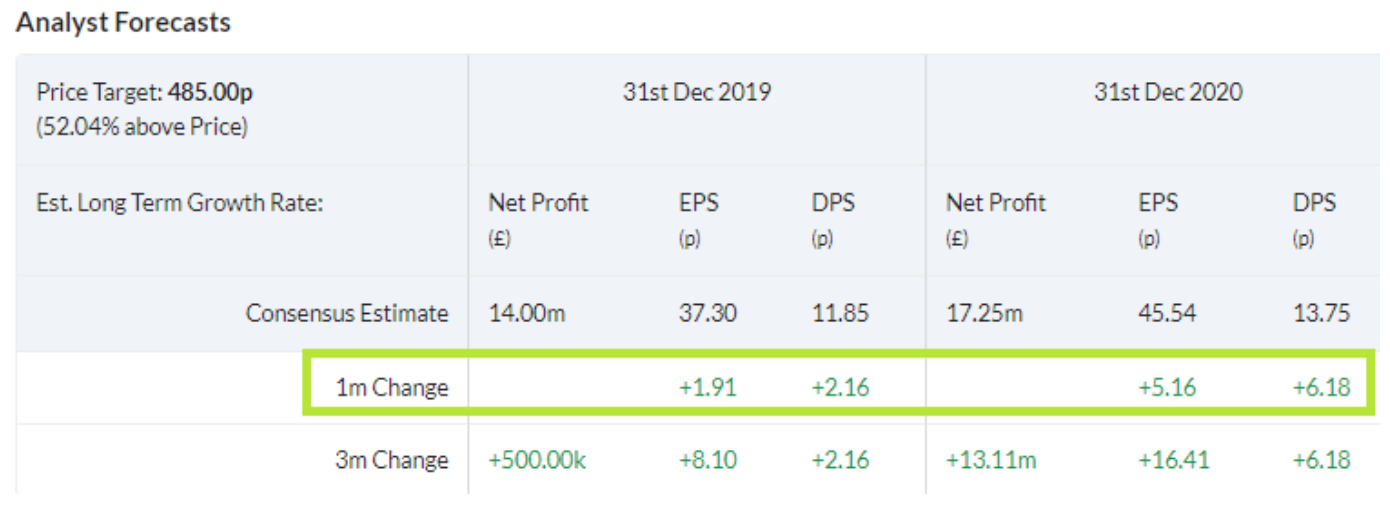
I don’t intend to take any portfolio action as a result of this news and continue to hold HAT stock. Aside from this issue, HAT appears to be trading well. Indeed, broker forecasts for 2019 and 2020 have risen over the last month:
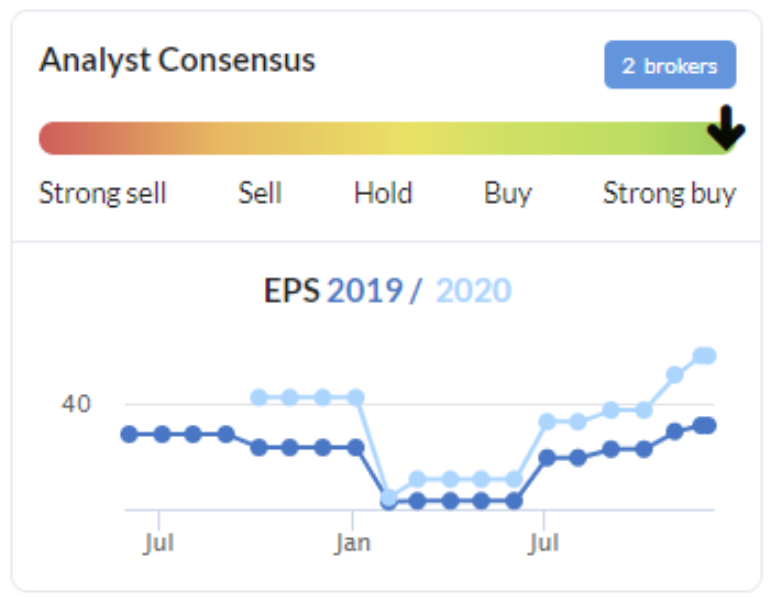
Brokers (including the company’s house broker) appear to remain confident of a big step up in earnings next year:
Oxford Instruments (LON:OXIG) - time to take profits?
(Original coverage: 12/02/2019)
Back in February, I added nanotechnology firm Oxford Instruments (LON:OXIG) to the SIF folio. The holding is now nine months old, so it’s time to review it to see if it continues to satisfy my screening criteria, or if it should be sold.
This nanotechnology firm designs and manufactures equipment “that can fabricate, analyse and manipulate matter at the atomic and molecular level”. Sales are split almost equally between academic and industrial customers. Although I don’t understand much about the firm’s technology, I can tell you that its customers operate in most major industrial and scientific sectors (you can find out more here).
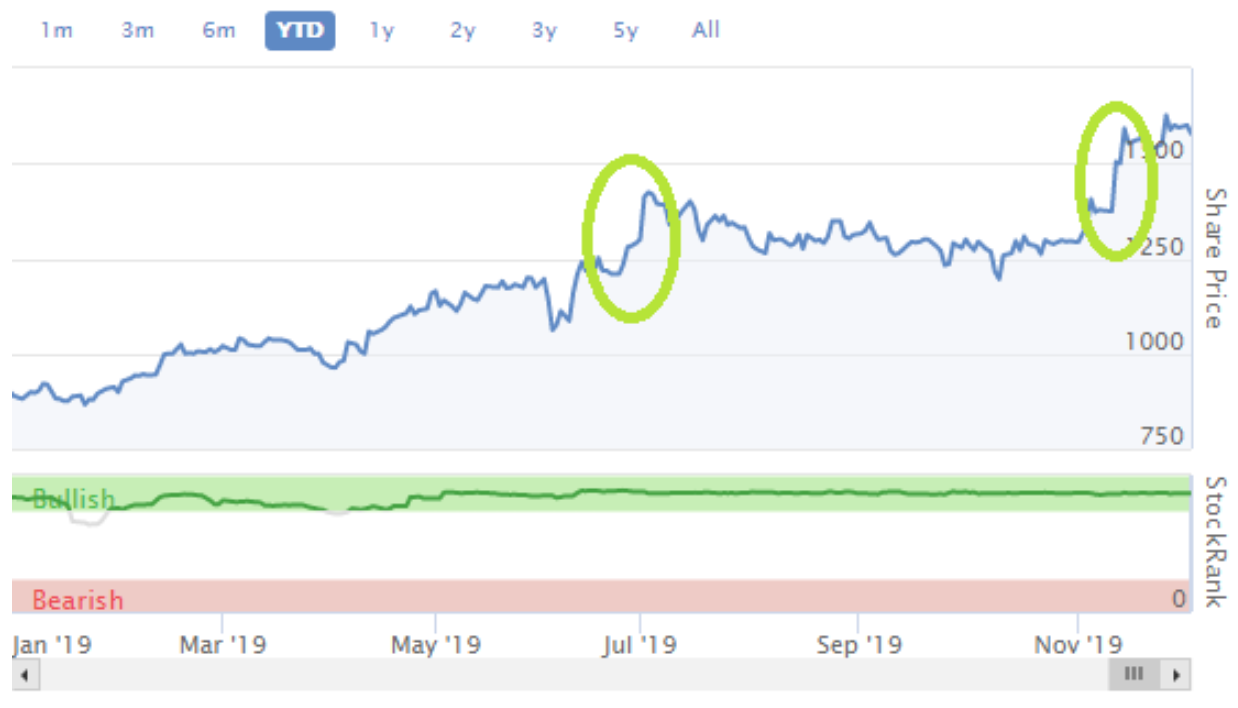
Nine months ago, Oxford Instruments had a market cap of £530m and was a member of the FTSE SmallCap index. Today the group has a market cap of more than £900m and is a member of the FTSE 250. This strong performance has translated into an attractive nine-month profit of 65% for SIF:

The shares delivered strong gains following full-year results in June and November’s half-year figures:
When I bought the stock in February, I commented that Oxford Instruments’ ValueRank of 31 was pretty poor. However, at the time I took the view that the normalised earnings used by Stocko’s algorithms were probably understating the group’s profitability as its recovery continued.
Looking at the situation today, I’m no longer convinced this is true. The stock’s ValueRank has fallen even lower, to just 19/100. Looking at the breakdown of this score, I can see several unfavourable changes:
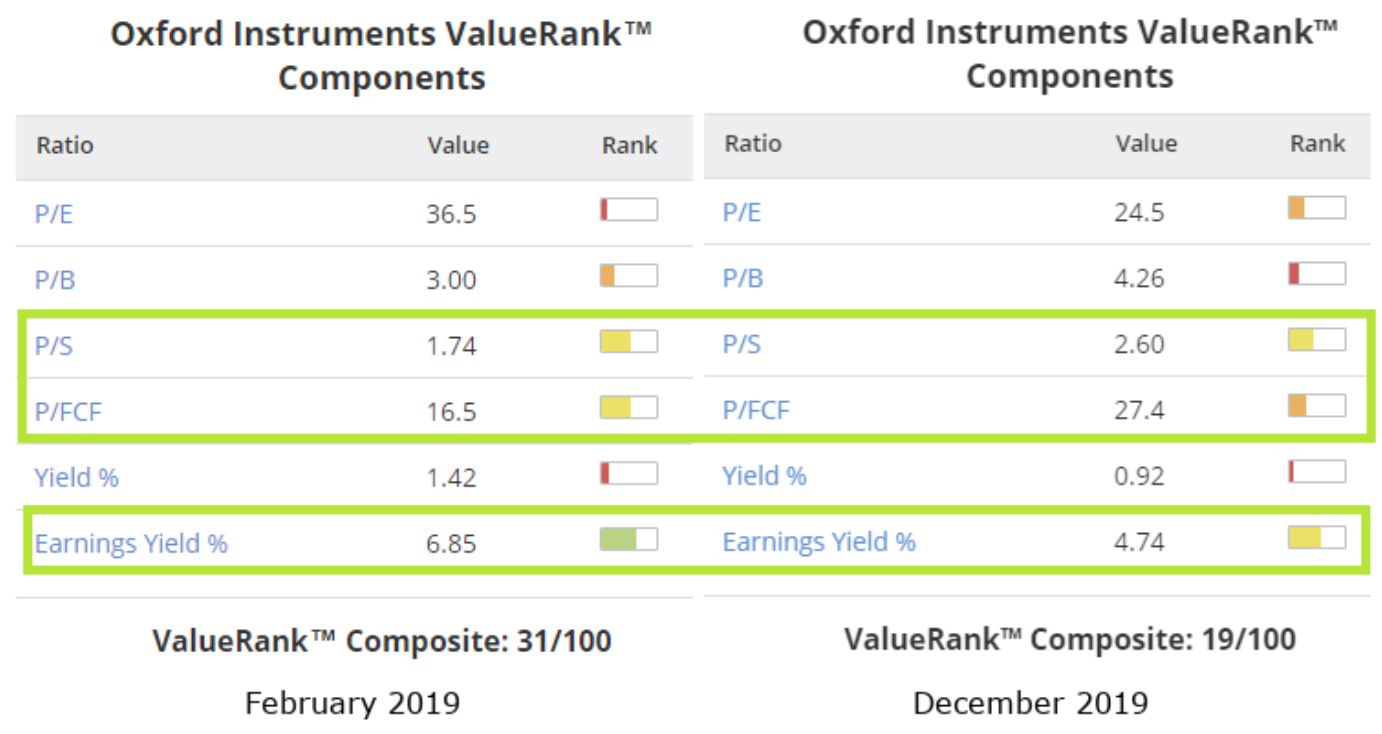
I use price/free cash flow and earnings yield (EBIT/EV) as key indicators of value when picking stocks for the SIF fund. Although I generally pay less attention to the price/sales ratio, I think it can be a useful indicator that a company’s valuation is pricing in a lot of future growth.
These metrics suggest to me that OXIG stock has become significantly more expensive over the last year. My reading of the firm’s accounts confirms this impression. Although the shares have risen by about 65% since February, revenue of £352.9m over the 12 months to 30 September was only 19% higher than in FY18. Reported operating profit for the same period was 13% higher, at £43.3m.
These figures give the group an operating margin of 12.3%, which is credible enough. But it represents a flat trend on FY18 and FY19:
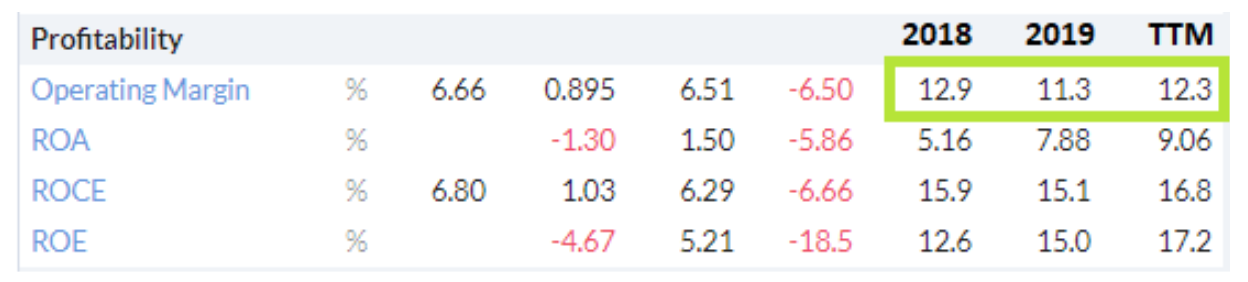
Although the company reported an adjusted operating margin of 14.9% for FY19 and of 15.5% for H1, these figures rely on various adjusting factors. By far the largest of these is the amortisation of acquired intangibles. In FY19, this totalled £9.6m. Removing this charge increased the firm’s operating profit by 25%. But in a business where acquisitions are part of the business model, I disagree with this widely-used adjustment.
Although it’s non-cash, this amortisation charge reflects cash previously spent by the firm. In my view, ignoring the amortisation of acquired intangibles can make acquisitions appear more profitable than they really have been.
Outlook: Despite my reservations, Oxford Instruments does seem to be in decent shape. The order book rose by 8.9% to £186.8m during the first half of the year, while the firm’s book-to-bill ratio was 1.04. A figure over 1.0 indicates that new orders are outpacing completed orders.
Although cash conversion dipped during H1, the balance sheet remains healthy, with net cash of £14.2m. Analysts expect to see continued earnings growth, both this year and in 2020/21:
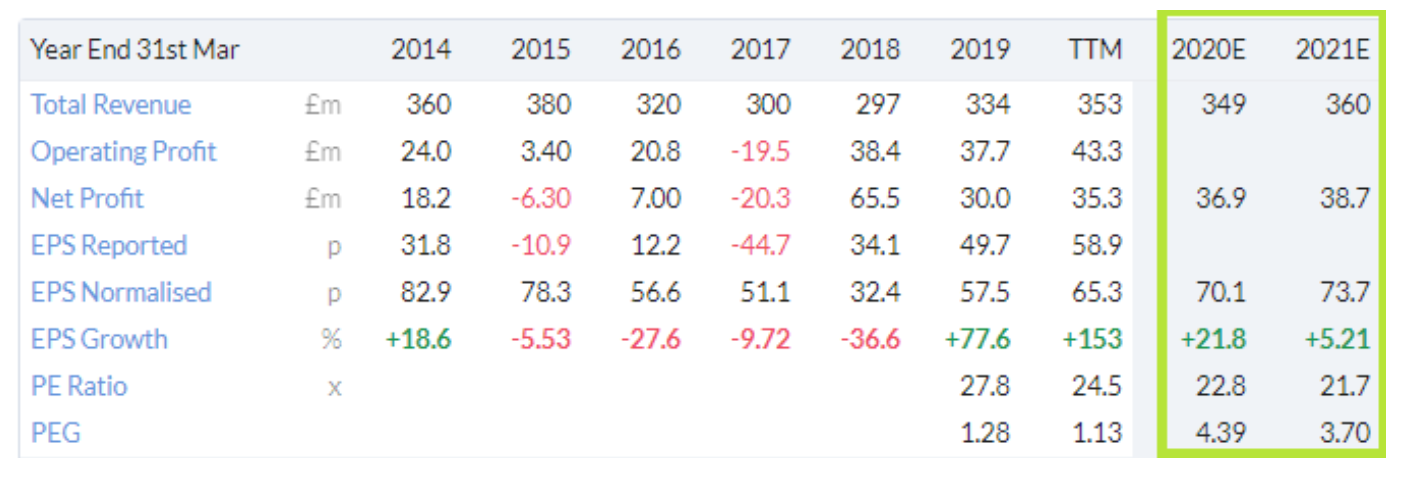
However, the rate of growth appears to be slowing, even if you’re happy to rely on the firm’s measure of adjusted earnings (which I assume is used by analysts covering the stock). I’d also argue that the high PEG ratio and P/E ratings suggest the stock is quite fully priced.
My decision
Running Oxford Instruments through my screening checklist tells a similar story. The group fails my screening tests on three key valuation measures:
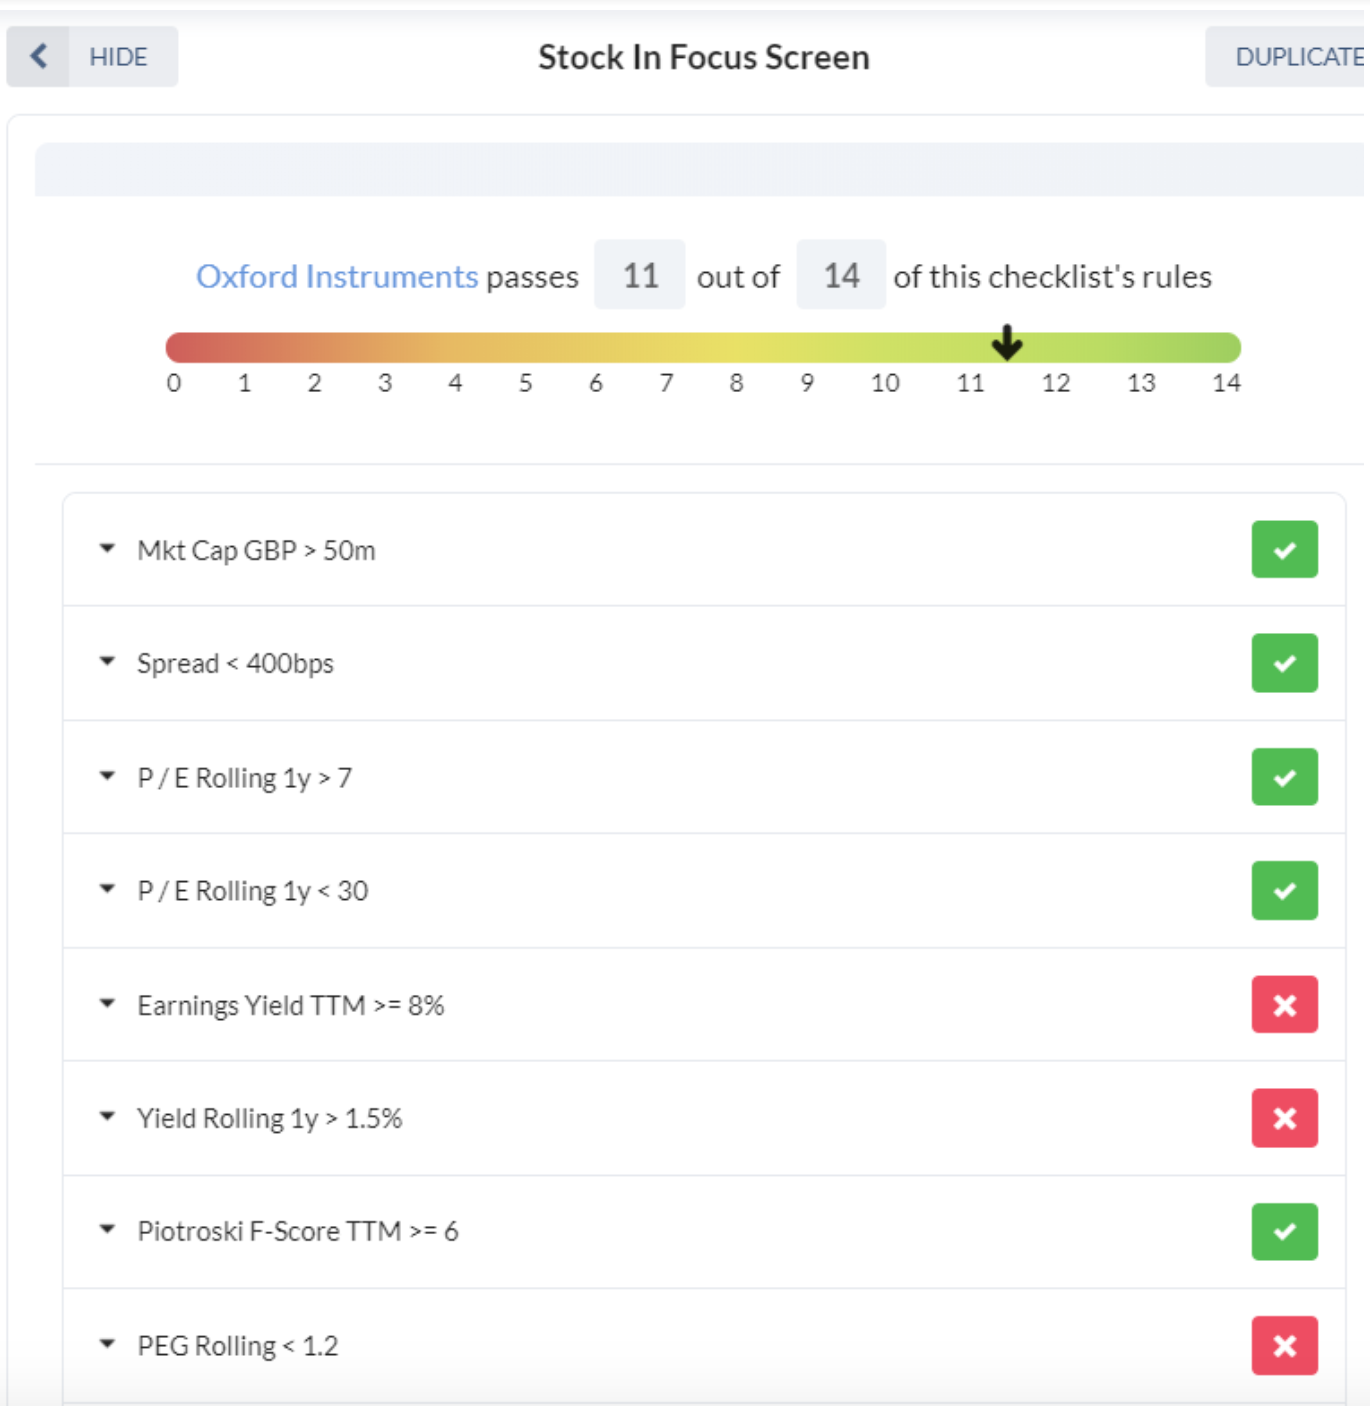
Given this, I have no choice but to sell the stock from the SIF folio. As usual, I will sell the fund’s virtual holding and my own real-money position after this article has been published.
I’m not too unhappy to be selling now. Although further gains are possible, I think the downside risks may also be growing. With the macro outlook starting to look softer, I’m happy to take a 65% profit.
Verdict: Sell
Total return: +65pc
Disclosure: At the time of publication, Roland owned shares of Oxford Instruments and H&T Group.
Disclaimer
This is not financial advice. Our content is intended to be used and must be used for information and education purposes only. Please read our disclaimer and terms and conditions to understand our obligations.

7 comments
Thanks again Roland
Re Oxford Instruments (LON:OXIG) - Worth reading the outlook from Berenburg who gave it a very positive rating last week......
When is momentum peaking? Always a question that has bothers me and your approach of P/S, P/FCF and earnings yield is nourishing food for thought. With your tech background do you have a view on Boku Inc (LON:BOKU) - it was tipped by the Telegraph today. Oxford Instruments was tipped last week - these tips move prices, which is my reason for asking.
Hi catalogue,
Thanks for your comment. Boku Inc (LON:BOKU) isn't a stock I've followed, I'm afraid. The StockReport shows strong revenue growth over the last couple of years, but a long history of losses. So I guess the investment case rests on whether the company can reach a profitable scale. I've no view on this.
Thanks for highlighting the Oxford Instruments (LON:OXIG) tip, I hadn't seen it.
Regards,
Roland
Is there a link to the post where you discuss the selection of your SIF screening criteria? The new site doesn't seem to have a search page yet and the old site has a "can't see the wood for the trees" problem.
Hi epo001,
Here's a link to my original (April 2016) article when I introduced the screen:
https://www.stockopedia.com/content/introducing-the-stock-in-focus-portfolio-128456/
The general shape of the screen has not changed since then, although there have been a few minor changes, made at the time of my annual review in April each year.
2017: https://www.stockopedia.com/content/sif-portfolio-up-19-and-beating-the-market-in-year-one-180153/
2018: https://www.stockopedia.com/content/sif-portfolio-up-18-and-still-beating-the-market-in-year-two-356448/
2019: https://www.stockopedia.com/content/sif-folio-40-in-three-years-what-should-i-change-470951/
You should be able to access the current version of the screen here:
https://www.stockopedia.com/screens/stock-in-focus-screen-113218/
I hope this helps.
Regards,
Roland
Very helpful, thank you.