
Good morning! It's Paul here.
Graham couldn't find anything of interest to write about today. So I've agreed to step in, and write some stuff about 2 interesting companies whose results/updates slipped through the net earlier this week.
Firstly, we have results from perennial dog, Earthport.
Earthport (LON:EPO)
Share price: 6.2p (flat on the day, at 10:20)
No. shares: 931.0m
Market cap: £57.7m
Earthport (AIM: EPO.L), the leading payment network for cross-border transactions, is pleased to announce its final results for the year ended 30 June 2018.
First red flag - slow accounts. It should not take a small cap 5 months to produce its accounts, especially a financial company - as it suggests that internal controls may not be up to scratch. Indeed, this is admitted;
The Board acknowledges that management accounting control and reporting errors took place in prior periods and changes to these processes and other decisive actions are currently underway to address the underlying issues. This includes increased monitoring of the FX business, increased controls and checks, stronger review processes and specific internal reporting changes....
It's been yet another poor performance this year from Earthport;
Revenues: £ 31.9m
Operating loss: £8.5m
Earthport has been producing lamentable results now for 17 years as a listed company.
The balance sheet shows retained losses of £163.4m.
The story is always jam tomorrow. Then when failure is achieved, periodically management is changed, and the story changes. This year it's more of the same;
This year was a transitional year for Earthport where the underlying core payment business performed well despite the material setback of losing the business of a single large customer in Europe. The Board made significant changes to the leadership of the Company reflecting a change in business priorities and strategy ...
The financial year 2018 began strongly and with high expectations for the year ahead, following a period of business growth in the previous year. In order to build on the expected momentum, the Company raised new capital to finance investment plans in capabilities and technology. However, it became apparent during the year that revenue was under pressure due to the loss of a major strategic payment customer and material delays occurred in the implementation process for another strategic partner....
Blah, blah, blah! I've been reading this sort of stuff for 17 years, so please excuse my cynicism.
Where on earthport does it find new mugs, prepared to fund the ongoing losses, over such an incredibly long period of time? After the most recent fundraising, there was net cash of £28.3m at end June 2018, enough to last another 3 years of losses.
My opinion - it's a terrible business. The jam tomorrow promises have never come to anything, historically. Maybe one day, a viable business might emerge? There's no sign of that yet though.
Findel (LON:FDL)
Share price: 227p
No. shares: 86.4m
Market cap: £196.1m
Findel, the online value retail and education supplies business, today announces its Interim Results for the 26-week period ended 28 September 2018.
These figures were published 2 days ago, on Weds, but slipped through our net at the time.
What can we tell from the Stockopedia graphical history?
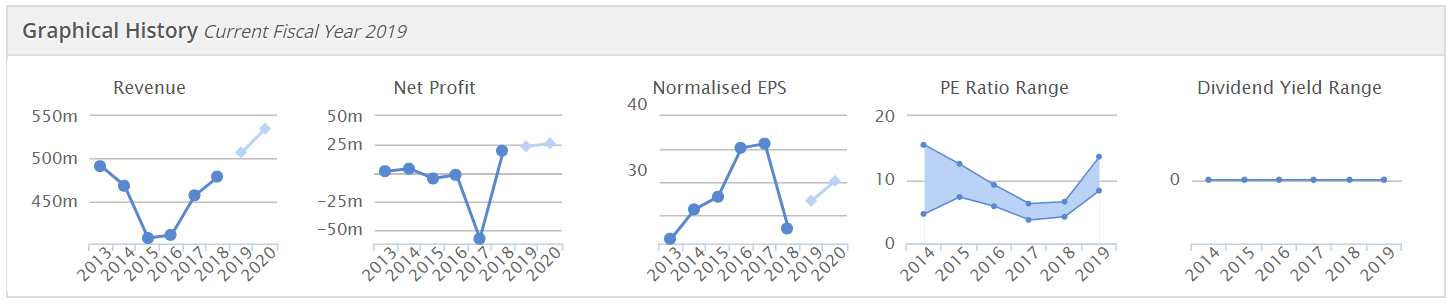
Graph 1 - nice up-trend in place & forecast for revenues, since 2016 (light coloured dots are forecasts)
Graph 2 - bumped along around breakevenfrom 2013-2016, then some kind of big write-offs probably in 2017, since bounced back to decent profits.
Graph 3 - this looks a bit odd, so I checked the share count, and in 2015 it seems that the number of shares in issue dropped from c.100m, to c.85m. Maybe a buyback, or tender offer?
Graph 4 - it's always been cheap on a PER basis, sometimes very cheap. Therefore the stock market clearly doesn't think much of this business!
Graph 5 - divis - none.
Oh dear, this looks distinctly unexciting - negligible revenue & profit growth;
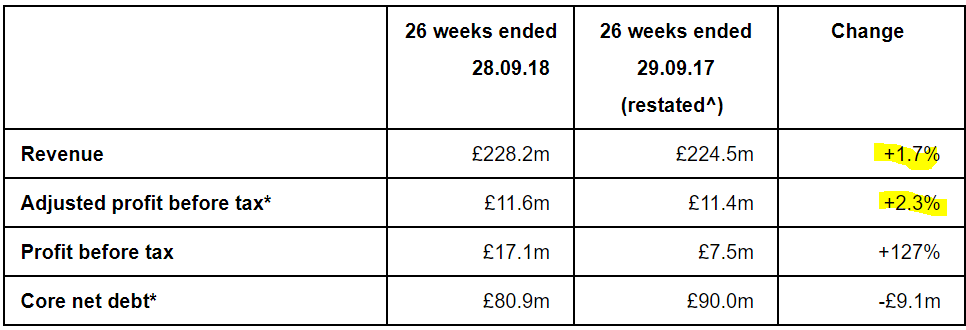
Rather confusingly, it then says that we need to adjust the adjusted figure;
Adjusted profit before tax* on a constant-GAAP basis* for H1 up by 10.8% (2.3% on a reported basis).
Current trading - has improved by the looks of it, but overall looks in line with expectations;
Product sales in the 10 weeks to 23 November 2018 are up 12% vs. prior year
Strong performance post period end; record trading levels in the three weeks to Black Friday
Our expectations for the full-year and the medium-term remain unchanged.
Balance sheet - oh dear, I should have looked at this first, as this is the deal-breaker for me.
NAV: £34.4m. Take off the intangibles of £25.8m, leaves NTAV of only £8.6m.
Current assets are a gigantic £320.7m, which includes customer receivables of £233.2m - this is instalments due from customers.
Current liabilities look relatively modest at £97.7m.
Non-current liabilities is where most of the debt is (securitised on the receivables book) of £272m.
The group is therefore exposed to potential bad debts, in an economic downturn. I'm not at all keen on this type of structure - which looks similar to N Brown (LON:BWNG) .
Seasonality - this is a helpful note. All companies which have any significant seasonality should clearly state this in every trading update & results statement;
The nature of the businesses within the Findel Group mean that profits have shown, and will continue to show, a significant seasonal bias with the majority of profit being earned in the second half.
Valuation - this is a dirt-cheap PER, but there are no divis, and there's also the weird balance sheet to take into account;
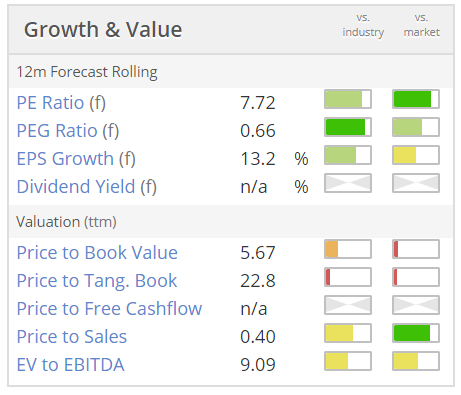
My opinion - it is tempting at this price - a growing, online business, at a PER of 7.7 certainly makes me sit up and take notice. I'm not keen on the balance sheet structure though, so will probably pass on this share.
For more information, there's a freely-available research/marketing note from Edison.
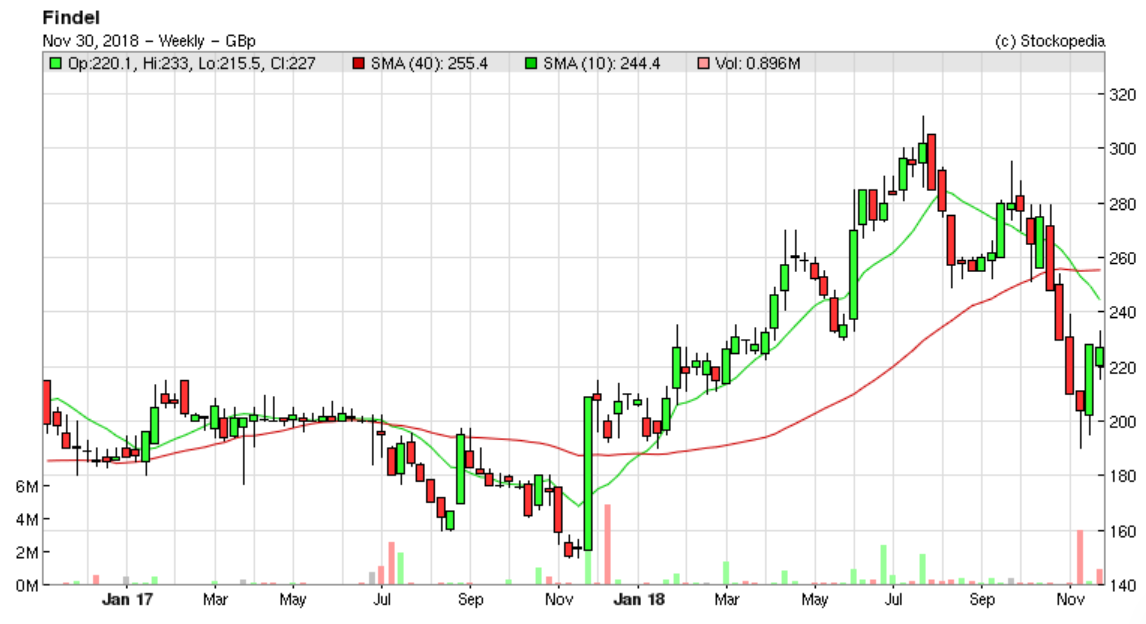
If you like the company, then the recent market sell-off could be seen as a buying opportunity, perhaps? I'm not keen enough to want to buy any myself.
Treatt (LON:TET)
Share price: 451p
No. shares: 58.4m
Market cap: £263.4m
Full year results - for the year ended 30 Sept 2018.
The highlights look OK;
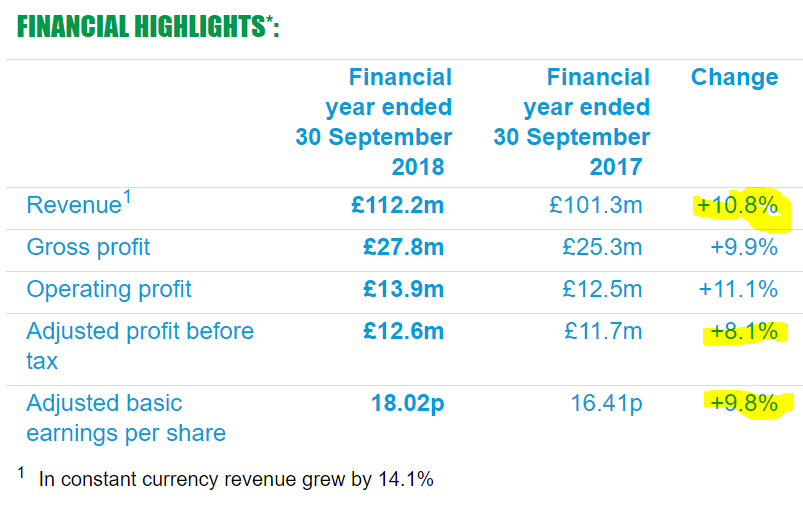
It's nice to see a bit of colour in an RNS. Green headings, and blue text isn't the best combination though - what's the old saying, "blue & green should never be seen" (together). So I've thrown in a bit of yellow highlighting, to make it really garish!
This seems to be a slight EPS miss, as I have consensus of 18.3p forecast. It doesn't really matter, as this share is all about future expansion plans.
Outlook - in line;
"The Group has had a steady start to the new financial year with a number of attractive opportunities in our pipeline of projects with both existing and new customers. We are well placed to capitalise on these opportunities with our capacity expansion in the US expected to complete in the coming weeks. Whilst still early in the financial year, the Group continues to perform in line with the Board's expectations for the full year."
Balance sheet - is very strong, following a placing. The cash is, I believe, ear-marked for building a new factory, to expand production.
My opinion - this share looks expensive on a PER basis. However, that's a red herring in my view, as investors are looking to the future. The key point to research, is how much capacity is going to increase once the new factory is built, and how much this will increase profitability? I don't have any research on that, but would like to find out, when I have more time.
This company looks very interesting. I can't see any reason to rush in and buy them just now, but it's high up on my watchlist.
I have to leave it there for today.
Wishing everyone a lovely weekend!
Best wishes, Paul.
See what our investor community has to say
Enjoying the free article? Unlock access to all subscriber comments and dive deeper into discussions from our experienced community of private investors. Don't miss out on valuable insights. Start your free trial today!
Start your free trialWe require a payment card to verify your account, but you can cancel anytime with a single click and won’t be charged.