
Good morning, it’s Paul here with Tuesday’s SCVR. Please see the header above for the running order.
We reached a pleasant milestone today - the first day of the year when I drew back the curtains at 06:47, and it was daylight! Only just, but I'm a glass half full person. So that's put a bit of a spring in my step today.
Estimated time of completion today - 1 pm.
EDIT at12:41 - I'm taking a break for lunch now, but will add some more sections after lunch. So revised finish time is 4pm.
NB this is extra work, not a delay! So thumbs-downers, keep your greasy mitts away from that button!
EDIT at 16:28 - today's report is now finished.
I've been doing some planning for my telephone interview this Thursday, with Andrew Gossage of Up Global Sourcing Holdings (LON:UPGS) . I've asked UPGS to talk to us about China, because the company is a specialist importer of branded consumer goods from China. The company was receptive to my request for an interview, and suggested we talk towards the end of this week, so that they will have a better handle on how the situation is developing in China, a few days after the usual Chinese New Year shutdown has ended.
I see that overnight, Apple indicated it would see a greater than anticipated hit to revenues, due to coronavirus. Apparently it usually sells about 10% of its product in China, and makes most iPhones in China, so a double hit in the short term anyway, to both sales and production.
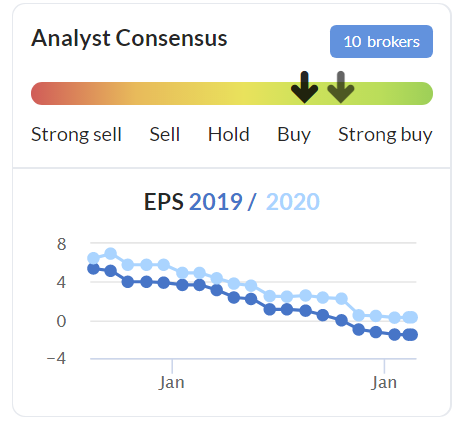
Talking of which, I've just seen that Iqe (LON:IQE) (a supplier of chip wafers for semiconductors) is down about 5% today, presumably in response to Apple's predictable warning. IQE's share price is down to only 58p. I remember doing very well, trading this share, a couple of years ago, on positive newsflow. As it's turned out, the optimism & expectations of big profits, looks to have been hot air. IQE's broker forecasts look dismal now;
.
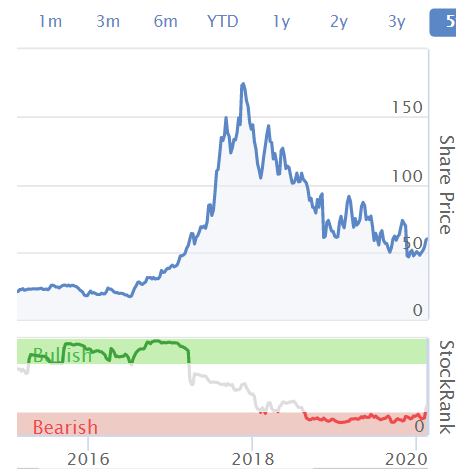
IQE's share price chart looks similar to something out of the TMT (technology, media & telecoms) boom/bust of 1998-2002;
.
What's interesting about this picture, is that the StockRank (see above, it's embedded within the share price graph on the new Stocko site) began falling sharply well before the share price peaked. It had turned negative in early 2018, when the share price was still near its highs. I wonder what the StockRank system picked up on, which foresaw the downturn? Possibly reduced broker forecasts, and/or poor value perhaps? Do remember that the StockRank system is very clever, but not infallible. If it was infallible, we'd all be billionaires. It's proven to work on a portfolio basis, but not necessarily for every stock within that portfolio, so please always bear that in mind. Still, in this case, the falling StockRank was flagging that something was going wrong, well before the share price peaked. Therefore, I'll certainly keep an eye on the StockRank movements for shares I hold, for possible early warnings.
I think this situation is also a reminder that, whilst we like to delude ourselves that we're geniuses during good patches of portfolio performance, the reality is often that we just got lucky in spotting a speculative wave, and riding it. Getting off a speculative wave at the right point is probably a more important money-making skill than any detailed analysis (much of which often turns out to be wrong, as was the case with IQE!). A sobering thought.
There's a lot more luck in this game than most people like to admit - a lot of successful investors have told me this, as well as my own observation. Getting lucky occasionally, and then successfully hanging on to the profits, is what it's all about really. I haven't quite mastered the second part yet!
Cenkos Securities (LON:CNKS)
Share price: 66p (up 8% at 08:16)
No. shares: 56.7m
Market cap: £37.4m
(at the time of writing, I hold a long position in this share)
Cenkos is today issuing an update on trading for the financial year ended 31 December 2019.
2019 was tough, as expected.
Profitable in H2, and FY 12/2019. It made a loss of -£0.2m in H1, which implies a profit of at least £0.2m in H2. Although, as MrContrarian points out in the comments section, this wording is a little ambiguous;
The Company is pleased to announce that, subject to audit, after taking account of the non-recurring restructuring costs of approximately £1.4m that took place in 2019, the Company has been profitable for the second half of 2019 and expects to be profitable for the year ended 31 December 2019.
The way I read that, it seems to be saying that underlying profitability is at least £1.6m (i.e. enough to turn in a FY profit after the £1.4m restructuring costs, and the -£0.2m H1 loss). Why couldn't they just have said that?
It would be much clearer if Cenkos had just put the figures in a table, with columns for statutory, adjustments, and underlying profit, with prior year comparatives. I find that numbers are better than words, to explain numbers! It's a little concerning that a broker which is advising its clients on how to communicate with the market, doesn't display enough clarity with its own announcement.
Cost-cutting - fixed cost base today is £3.0m lower than in 2019. Incurred restructuring costs of £1.4m. Note that at its H1 2019 results, staff costs halved vs H1 2018, to £6.5m (from £13.0m). So it's noteworthy that Cenkos has a highly flexible cost structure -with staff getting lavish bonuses in the good times, but taking the pain in the bad times. The fixed cost base being cut is in addition to the effect of reduced bonuses.
Outlook - encouraging;
Whilst still early in the year, the Company is encouraged with the strength of its pipeline and is pleased to report that the momentum that took place in the fourth quarter in 2019 is continuing into the new year.
The confidence in our pipeline is reflected in the Board's expectation of announcing a final dividend when it releases its results for the year ended 31 December 2019, in late March 2020...
Market conditions may still be impacted by factors outside our control but we have started 2020 well and we look forward to the year ahead."
A dividend, but not stated how much.
My opinion - as mentioned before here, the valuation on CNKS looks very low, being largely backed by cash and near-cash.
The glory days of making tons of profit on Woodford-based IPOs may be gone, but I like the way the business has flexibility to sharply reduce costs in leaner years. Therefore, it can not only survive, but remains financially strong, even in a downturn for IPOs and fundraisings.
An improving outlook in 2020 augurs well I think. Simon Thompson's recent tip of this share could turn out to be more than a short-lived spike. Overall, I think risk:reward here looks good - a very strong balance sheet, combined with a flexible cost base, and improving outlook, sits together nicely. Plus divis whilst we wait for a re-rating.
Angling Direct (LON:ANG)
Share price: 62p (down 9.5%, at 09:29)
No. shares: 64.6m
Market cap: £40.1m
Trading update (profit warning)
Angling Direct plc (AIM: ANG.L), the largest specialist fishing tackle and equipment retailer in the UK, announces the following pre-close trading update ahead of the publication of its financial results for the 12 months ended 31 January 2020.
The company has missed its FY 01/2020 forecasts, as follows;
Revenues actual: £53.1m, forecast: £54.8m (3.1% below)
Online revenues - up 13.3% against last year, at £25.2m, a healthy 47% of total revenues. Of which, 20% are international sales - encouraging.
Physical stores - strikingly good LFL sales, up 12%. Plus 10 new stores opened.
Adj EBITDA - too confusing, because the company reports pre-IFRS 16 (c.-£0.5m EBITDA loss), but the house broker reports the same number post-IFRS 16 (£0.6m positive adj EBITDA). In my view, post-IFRS 16 EBITDA is too distorted to be useful (because some property rental costs are stripped out, and shoved into finance costs, lower down the P&L, thus artificially inflating EBITDA). Surely it would make sense for the FD, and the house broker, to compare notes and report figures on the same basis?
Adj profit before tax - in my view, this is the most meaningful number to measure performance. This should come out at a -£1.4m loss for FY 01/2020, according to a broker update note out this morning, available on Research Tree. This is £1.0m worse than the previous forecast.
Despite the upbeat commentary, this company doesn't actually make any money! Although that is not unusual for smaller, growing (partially) online businesses - they usually need to reach decent scale before meaningful profits start to flow.
Reasons given for lacklustre end to FY 01/2020;
- Weather - flooding post Xmas, impacted fishing activity
- Stock clearance at lower margin, related to acquisitions
- More prudent approach to some legacy costs
1 and 2 sound credible, but I'm a little worried by point 3. FDs should always be prudent, that's a key accounting principle. I'd like more detail on this. What costs, and why weren't they provided for before?
Cash - reported at £5.9m as at 31 Jan 2020. That is down a lot from £13.3m reported at 31 July 2019. This must be funding capex for new stores, and inventories (which tend to be quite high in this niche, due to the requirement to hold large numbers of stock lines, some of which might be slow-moving, but necessary to have a complete range).
Capex - given that existing stores & online are not currently generating any meaningful cashflows, then the question has to be asked whether it is appropriate to keep spending heavily on expansion capex?
My opinion - to drop £1m of extra losses, in the last few weeks of the financial year, is not good.
It's loss-making overall now, and is not demonstrating that the heavy expansion capex is delivering any return.
Given that the previous forecasts have been revised down heavily, and then missed, why would I rely on next year's forecasts?
Therefore, I think the jury is out on this one. Based on the numbers above, ANG has a lot to prove, before I'll be convinced that there's a decent business here.
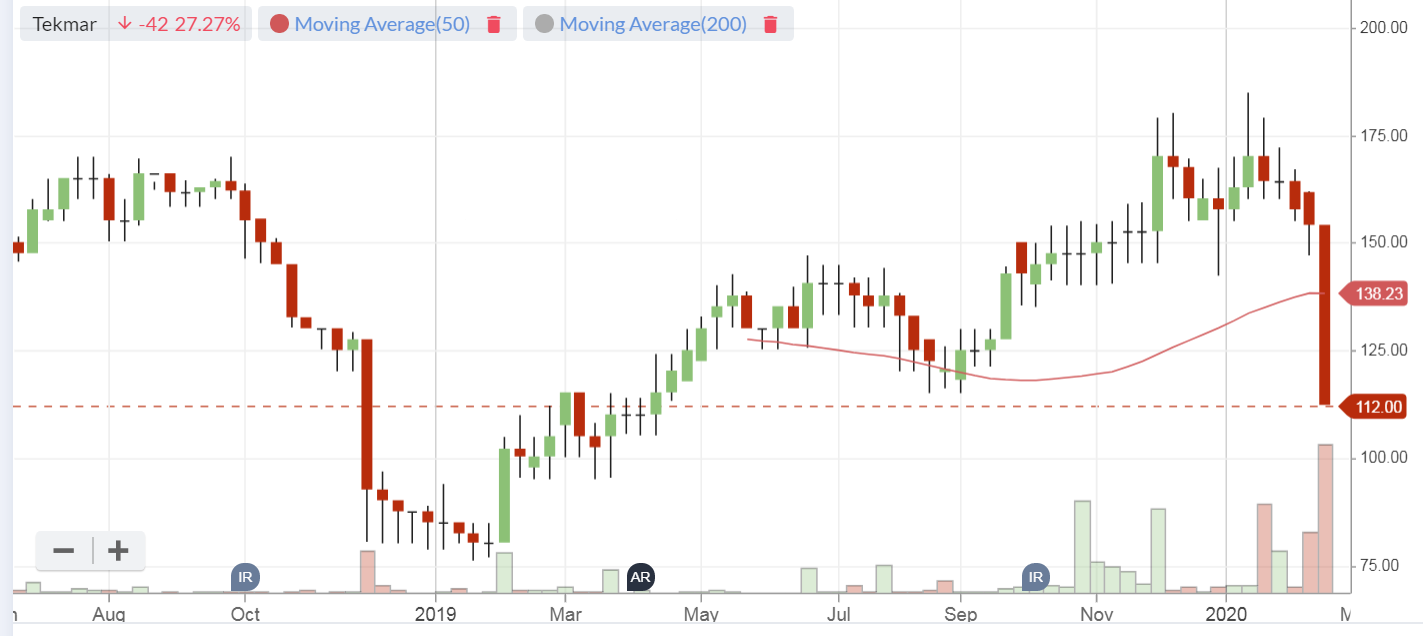
Tekmar (LON:TGP)
Share price: 103p (down 33%, at 10:31)
No. shares: 51.3m
Market cap: £52.8m
Trading statement & impact of corona virus (profit warning)
Several readers have flagged up this announcement as being interesting. It's come up on the list of top share price falls today too, which I always consult in the mornings, to pick up on profit warnings & out-performers on the upside. This is down 33% today, indicative of a medium-severity profit warning (which are typically marked down by about 30% initially, and then the market makers move the price up or down further depending on buying or selling activity).
Tekmar Group (AIM: TGP), a leading technology provider of subsea protection systems for the global offshore energy markets, announces a trading update, which reflects the foreseeable impact of the outbreak of the coronavirus on the Group's performance in the year ending 31 March 2020 ("FY20").
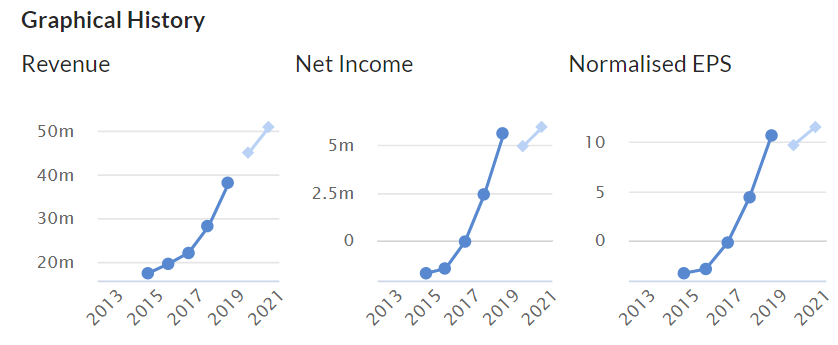
This company floated in June 2018, and I must confess to knowing nothing about it. Hence my first port of call is the Stockopedia graphical history, which shows a lovely growth in revenues & profits, and a high profit margin. So far, so good;
.
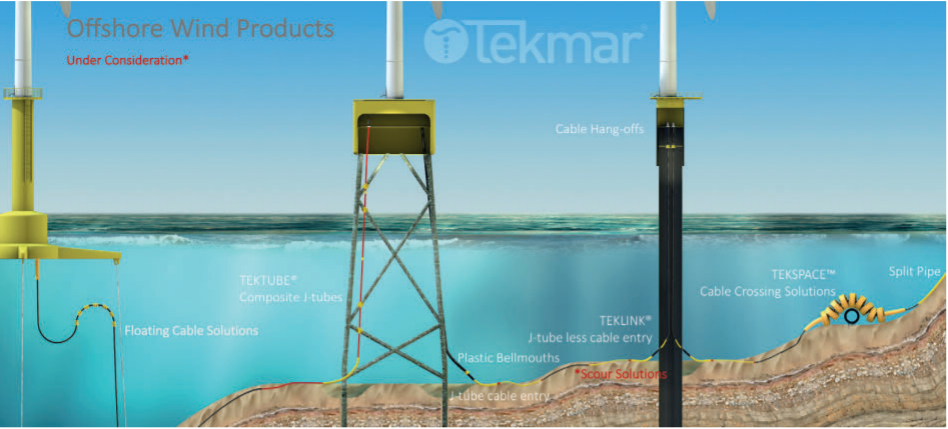
Its AIM Admission Document is here, and I note it has a picture of an offshore wind farm on the cover - which would explain the growth story, given the UK's rapid growth in wind energy (which amazingly, generates 30-40% of all our electricity already, having all but replaced coal-fired power stations).
Here are my notes from a quick skim of the Admission Document;
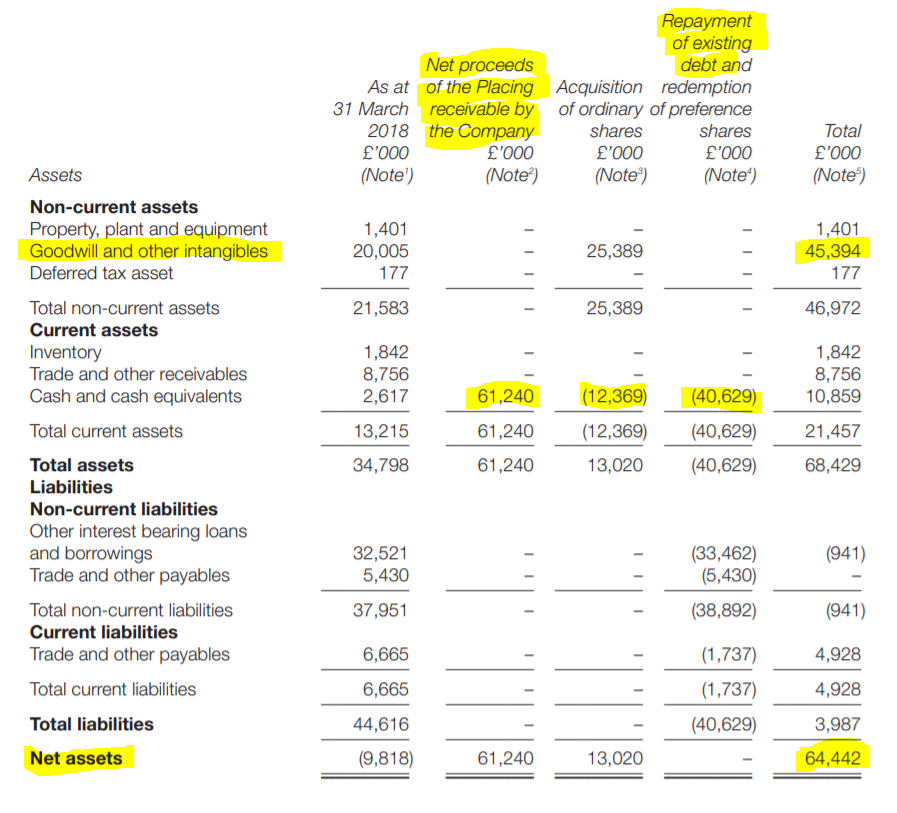
It floated at 130p, raising £61.8m, of which only £9.4m net proceeds retained by the company - so looks like the fundraise was to make acquisitions, and pay off debt, probably from private equity owners at a guess (who load up investee companies with debt, to avoid corporation tax).
See page 77 for a table showing before & after net assets, which explains where the IPO money went. Here it is, with my highlighting of the key numbers;
.
- Claims to be market leader globally in this niche (for wind farms, 83% of revenue at IPO time)
- Founded by 2 commercial divers in 1985, in Norway
- Typical contract value is c.£2m
- It says cable protection is a no-brainer, costing 0.1% of the cost of a wind-farm, but protecting & prolonging life of cables & preventing expensive outages/repairs
.
.
- High margins are defended with patents, know-how, trade secrets (Part 1, section 4)
- Balance sheet pre-IPO was indeed loaded with £32.5m debt [see page 42]
- Good historic cashflow generation [see page 44]
- Controlling party, pre IPO is Elysian Capital I LP - as I thought, a private equity company. PE fingerprints are all over the accounts!
Risk factors - China is not mentioned as a risk, and is only mentioned in passing 3 times in the whole admission document. The disclosure on suppliers is more generic;
Reliance on third-party suppliers
A limited number of third-party suppliers may be contracted for the supply of certain materials or
components. These suppliers may not be able to meet agreed minimum levels of supply. Failure to obtain
a continued supply of components on competitive terms or at all could severely harm the ability of the
Group to develop and realise projects and, consequently, the Group’s financial condition and results. [page 32]
The force majeure risk disclosure probably covers the company's backside against any legal claims from shareholders that the China risk was not adequately disclosed at IPO;
Force majeure
The Group’s operations now or in the future may be adversely affected by risks outside the control or
anticipation of the Group including labour unrest, civil disorder, war, subversive activities or sabotage, fires,
floods, explosions or other catastrophes, epidemics or quarantine restrictions. [page 36]
OK, I think that's enough from the admission document for me to conclude that this looks like a high quality float. That is confirmed by the major shareholder list, which includes luminaries such as Hargreave Hale, BlackRock, Henderson, and Miton. I like seeing those names on a shareholder list, as they know what they're doing. Although HH are known for smashing share prices down when they decide to unceremoniously exit positions that have gone wrong. So a double-edged thing with them on board sometimes.
Directors only hold 3.4% of the equity, according to Tekmar's website here.
.
What's gone wrong today? - disruption re China, both from Chinese suppliers, and Chinese customers.
Overview;
China's necessary and prudent response to the outbreak of the coronavirus, including the restriction of travel in the country, is affecting the Group's performance materially in a number of ways. The Board now expects that the Group's earnings in FY20 will be broadly in line with those achieved in FY19, as a result of the following factors...
I would have preferred more open disclosure of the financial impact. This partially obscures it, by forcing me to look up both last year's results, and current forecasts, and compare them to work out the financial impact. What a waste of time, when the company has that information to hand, but has declined to provide it. I can't find any broker notes either.
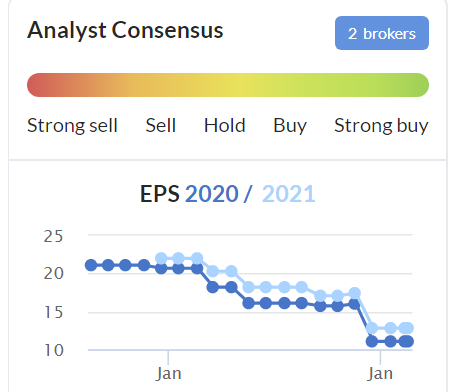
Working from the broker consensus numbers on Stockopedia (from Thomson Reuters), this looks a big miss. Tekmar did 4.35p normalised EPS in FY 03/2019, and we've got a forecast of 9.67p for FY 03/2020. So if the numbers are now going to be similar, then that implies a miss of about 55% against forecast. Ouch. If that figure is wrong, then it's the company & its advisers fault, for not providing us with more detailed information! They really do need to get some proper forecasts out to the market, for everyone to see, not just a privileged few - who could then arguably be accused of insider dealing, if they're using information that has been denied to the rest of the market.
Anyway, don't get me started on that again.
Actually, I've just discovered another complicating factor. The Thomson Reuters normalised EPS figure for FY 03/2019 of 4.35p doesn't tie in with the company's adjusted EPS for last year, of 6.21p. The problem here is that TR makes adjustments to earnings figures, to make them comparable between different shares, but not necessarily comparable with the company's own definition of adjusted EPS, and I don't have any reconciliation of the difference. This is turning into a nightmare, which I cannot exactly quantify due to not having enough information.
Anyway, we've got enough information to work out that this looks like a big miss against forecast. Q4 was a key seasonal quarter for profits, and it's been badly disrupted because of China/coronavirus.
Reasons for profit shortfall -
Travel restrictions - shipments to China by Tekmar, have all been delayed, due to travel restrictions.
... all of the Group's projects scheduled for shipment to China have been delayed and there is little visibility as to when travel restrictions will be lifted
Whilst obviously that's bad news for the current financial year, this presumably is just a delay. So revenues & profits should just shift from FY 03/2020 into FY 03/2021. The goods are not perishable presumably, and the customer presumably would be unlikely to cancel the order. An important point might be any penalty clauses for late delivery in the contracts. Do these include a force majeure clause, to protect Tekmar? I'd be very surprised if they don't, as that's bog standard in all contracts.
This particular reason should therefore not be a concern to long-term investors, as it should over time, get resolved.
Supplies from China - again this looks disruptive, but something that can be worked around, and is temporary in nature;
... the supply of components from China has ceased pending further notice. The Group has the ability to source replacement components from Europe and any resulting delay will not affect contractual delivery schedules for clients, but does affect the timing of revenue recognition and margins on affected projects
I think that being able to source product from Europe instead, is very important, and clearly positive. Even if there is a hit to profit margins in the short term, this should be recovered longer term, so shouldn't overly concern long-term investors.
Office closure - this looks likely to dent the pipeline/order book, at least in the short term;
... the Group's office in Shanghai, which services the whole of APAC, has been placed on official shutdown, as have many of our clients' and suppliers' offices in the region.
China accounted for circa 10% of our revenue forecast in FY20 and represented 20% of our outstanding supply-chain commitments.
And another thing - it's not clear if this is China related or not. Sounds as if it isn't;
Increased costs relating to one project within Subsea Innovation, which have arisen since December, are also affecting the Group's performance in FY20 to a lesser extent. Mitigating measures are being implemented to minimise the impact of these additional costs.
Directorspeak - reinforces that we still don't know how this China/coronavirus situation is going to pan out;
Alasdair MacDonald, Chairman of Tekmar Group, said: "The disruption caused by the outbreak of the coronavirus on the Group's activities and performance has been unpredictable and rapid, impacting the Group materially in our crucial, heavily weighted Q4 period.
With the situation in China and the surrounding APAC countries evolving, we are not yet able to evaluate the full impact of the virus on FY21 and will provide further updates as necessary."
My opinion - this is a very useful update, as others have mentioned, for wider read-across.
What is worrying for investors, is that the company's dependence on China wasn't flagged previously. I wonder how many other companies have similar exposure? Although Tekmar does seem a bit unlucky, in that this has coincided with its busiest seasonal trading period.
The savage market reaction to Tekmar's share price today, looks over-the-top to me, given that it's temporary & an external force majeure factor, rather than anything specifically the company has done wrong.
Importantly, Tekmar has a strong balance sheet, so I don't see any solvency worries at all here. That may not necessarily be the case with other companies though, with weaker balance sheets. This issue is a great demonstration of why companies need to have balance sheet strength, in order to be able to cope with the unexpected.
Overall, this looks like a long-term buying opportunity to me. Although anyone brave enough to buy in the current circumstances, needs to be prepared for the possibility of another profit warning, and incurring possibly heavy short-term losses, if the situation gets worse before it gets better, as is a distinct possibility.
If the market is going to punish China-related profit warnings this hard, then I think it might well pay to exit positions with likely exposure to China now, rather than waiting for the profit warnings later. Particularly with small caps, as it doesn't take much to move the prices. As a friend said to me recently, "if you're going to panic, make sure you panic first".
I've only just spotted that the company seems to have warned on profits previously too, see the chart below. I should probably look into that next, and add another section below;
.
Previous big moves - we've got nothing in the discussion archive here about Tekmar, hence why I'm taking a look back, to fill in the gaps.
Key dates seem to be 4 Dec 2018 - triggering a downturn, and 4 Feb 2019 triggering a recovery. (Tip - adding "crosshairs" under chart settings, then saving the format, using the blue button at the bottom, is a useful feature);
4 Dec 2018 - interim results - contained a profit warning, which is very bad form so soon after listing. Blamed on "short term delay" in contract awards, and a change in product mix. The share price took 2 months to bottom out.
26 Feb 2019 - Contract win for remedial work - this was the next trading announcement, so it's not clear what triggered a strong recovery in share price from 4-25 Feb 2019? It's a £3m new contract (quite big) in a new market, of remedial work on an existing wind farm, as opposed to previous work as part of the original build of wind farms.
28 Mar 2019 - acquisition - immaterial size
29 April 2019 - in line trading update
Therefore we can see from this that TGP had already demonstrated its vulnerability to large, lumpy contract wins/delays, before today's news on China. That's just the nature of the business. It helps reinforce my impression that big falls here caused by temporary factors, and contract delays, are more likely to be buying opportunities than anything more worrisome.
Titon Holdings (LON:TON)
Share price: 92.5p (down 16%, at 15:43)
No. shares: 11.1m
Market cap: £10.3m
AGM Statement (profit warning)
Titon Holdings Plc ("Titon", the "Group" or the "Company"), a leading international manufacturer and supplier of ventilation systems, and window and door hardware, is today holding its Annual General Meeting at which Keith Ritchie, Executive Chairman, will make the following statement...
Difficult trading has continued;
"As I noted in the 2019 preliminary results announcement on 12 December 2019, we continued to face political and economic uncertainties into our 2020 financial year, which made for a challenging first two months. These trends have continued and trading conditions across our geographies in the first four months of the year have been tougher than we anticipated; as a result, we anticipate that underlying profit before tax for the year ending 30 September 2020 will be materially below management's expectations.
Some other companies seem to be reporting an upturn since the decisive general election result in mid-Dec 2019, but not in this case - which makes me wonder if there might possibly be other factors in play here, e.g. competitive pressures?
Despite reduced political uncertainty, we have not yet seen any uplift in trading in 2020 following the 2019 General Election and the UK leaving the EU on 31st January 2020.
Sales in South Korea are down by 10%, so who does Titon blame? The Government!
European sales are weaker due to - Brexit, and a weak German economy. At least they didn't blame it (directly) on Angela Merkel!
USA hardware business is also trading below expected levels, let's blame Donald Trump! (no they didn't really, no reason is given).
Net cash looks good, at £4m (end Jan 2020), nearly 40% of the market cap.
Costs are being cut, in light of weaker trading.
My opinion - there's something odd about this share, but I cannot remember what it is. Do any readers know?
It's got a well-covered dividend yield of 4.4%, although if trading continues to be poor, then I wouldn't necessarily rely on that. Also, this type of micro cap often means that you have to hold for a year or two, just to allow the divis to cover your bid/offer spread, so what's the point?!
Note that there is quite a big non-controlling interest, where the group doesn't own 100% of all subsidiaries, it seems.
The balance sheet is strikingly good, and Titon does have a track record of being solidly profitable, and paying growing divis.
Overall then, despite a poor update today, and broker forecasts in a steep downward trend, it looks a lot better than most UK listed companies with a c.£10m mkt cap. Bear in mind this graph below will be taking another leg down, once the data has been updated for today's profit warning. So investors really need to get to the bottom of what's going wrong here. It can't all be down to unfavourable politics & economics, there must be some internal problems too.
.
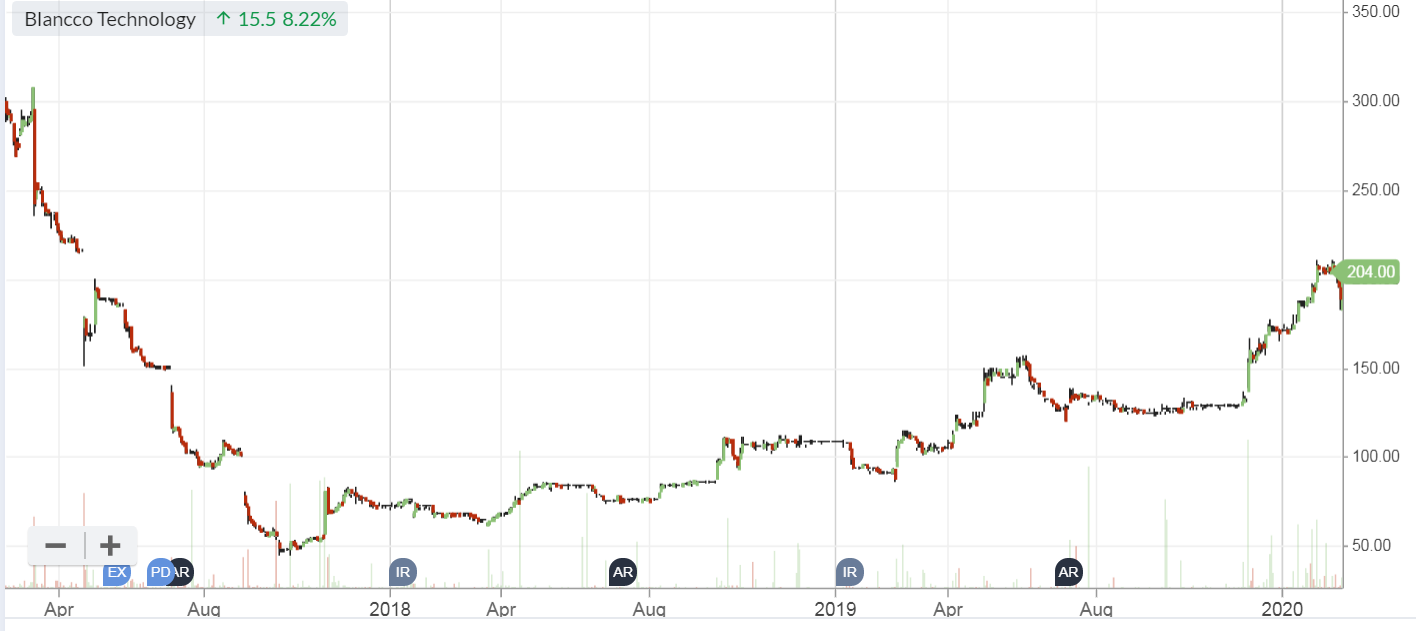
Blancco Technology (LON:BLTG)
Share price: 202p (up 7%, at 16:06)
No. shares: 75.4m
Market cap: £152.3m
Blancco Technology Group plc (AIM: BLTG, "Blancco", the "Company" or the "Group"), the industry standard in data erasure and mobile device diagnostics, is pleased to announce its unaudited interim results for the six months ended 31 December 2019.
That's a very bold description of itself as "industry standard". I'd be very interested to hear from any readers who know the sector, and can verify, or dismiss, this claim.
Headline figures look good;
H1 revenues up 19% to £17.4m
Balance sheet - has been repaired with an equity fundraising, and looks OK now. Although NTAV is only just positive, at £1.1m.
Cashflow - this would be worth checking out, when the full year results come out;
The conversion of profits into cash is depressed in the first half of the year when bonus payments are made to staff in relation to the prior financial year. In this reporting period, cash conversion was further reduced by the payment of costs relating to the acquisition and fund raising in July. These seasonal effects on cash generation will even out across the twelve month period with cash generation anticipated to be in line with market expectations at the end of the financial year.
Development spending - note that it capitalised £2.2m into intangibles in H1, consistent with £4.2m in the last full year. Those are big numbers.
Outlook - in line & confident-sounding;
We are trading in line with our expectations for the financial year ending 30 June 2020 and look forward to the coming periods with great confidence.
My opinion - I get an uneasy feeling from these numbers. Combined with lots of adjustments, and a complicated cashflow statement, I'm not convinced that this is a genuinely profitable/cash generative business.
That's reinforced by the fact that divis stopped a few years ago.
It's had a chequered past, but new management seem to have convinced the market that things are going well now. A fantastic share price performance has seen it 4-bag since the low in Oct 2017.
Overall, it doesn't convince me, but it's possible that I'm tainted by all the false promises made in the past, by previous management here?
It's difficult to argue with the share price though;
Good, that's it from me today. Thanks for dropping by, and see you tomorrow!
Best wishes, Paul.
See what our investor community has to say
Enjoying the free article? Unlock access to all subscriber comments and dive deeper into discussions from our experienced community of private investors. Don't miss out on valuable insights. Start your free trial today!
Start your free trialWe require a payment card to verify your account, but you can cancel anytime with a single click and won’t be charged.