
Good morning, it's Paul here.
I hope everyone is coping alright with the extreme heat this week. My apartment is unbearably hot at the moment, so I had to abandon work yesterday by mid-afternoon.
Let's start today with an interesting results statement from yesterday.
Please see the header above for companies reporting today which I'll be covering here later.
Joules (LON:JOUL)
Share price: 249p (down 2.4% yesterday, at market close)
No. shares: 87.8m
Market cap: £218.6m
Annual Results - 52 weeks ended 26 May 2019
This "preppy" fashion brand is a bright spot in an otherwise rather grim sector. I was wondering how Joules was faring, after reading press reports that competitor Jack Wills looks to be in financial trouble, and might be offloaded by its private equity owner.
Maybe Joules should not be seen as "preppy". Doing some googling, it is mentioned when I search for preppy, but looking at the product & lifestyle imagery, Joules actually seems more focused on middle/upper-class families, outdoor activities & countryside lifestyles.
There's a useful results presentation slide pack here, which also includes lots of nice photos of the product, in lifestyle shots. Worth a look. Slide 17 is interesting, in that the group spends a bomb on marketing, £9.5m, which could help explain its brand appeal.
As you can see below the key P&L figures for JOUL look really good;
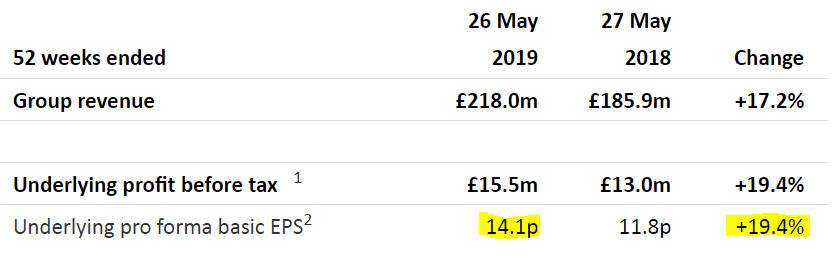
At 249p per share, that's a PER of 17.7 - rather expensive these days, for this sector.
Outlook - sounds reassuring;
We are pleased with the Group's performance to date in the early stages of our new financial year, with trading in line with our expectations.
Looking ahead, whilst the consumer retail environment is anticipated to remain challenging, particularly in the UK, the Board and I believe that Joules remains well-positioned for continued success both in the UK and our target international markets."
It sounds as if JOUL must be gaining market share from struggling competitors, perhaps? As weaker competition drops out of the market, and close stores, then that leaves more business for the survivors.
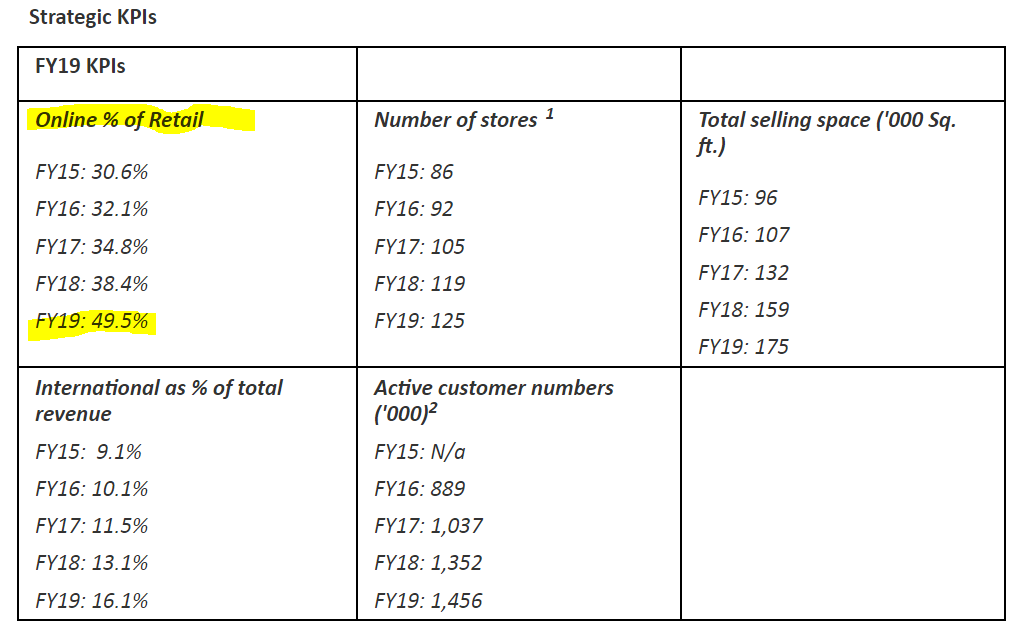
KPIs table - this is a really good idea, presenting some key metrics in 5-year tabular format. I'd like to see this adopted by other companies in their results statements.
The key KPI for me, is online sales. As you can see (highlighted by me), this is nearly half of all business, and growing strongly. That's very important, as I wouldn't touch any retailer with weak online sales these days;
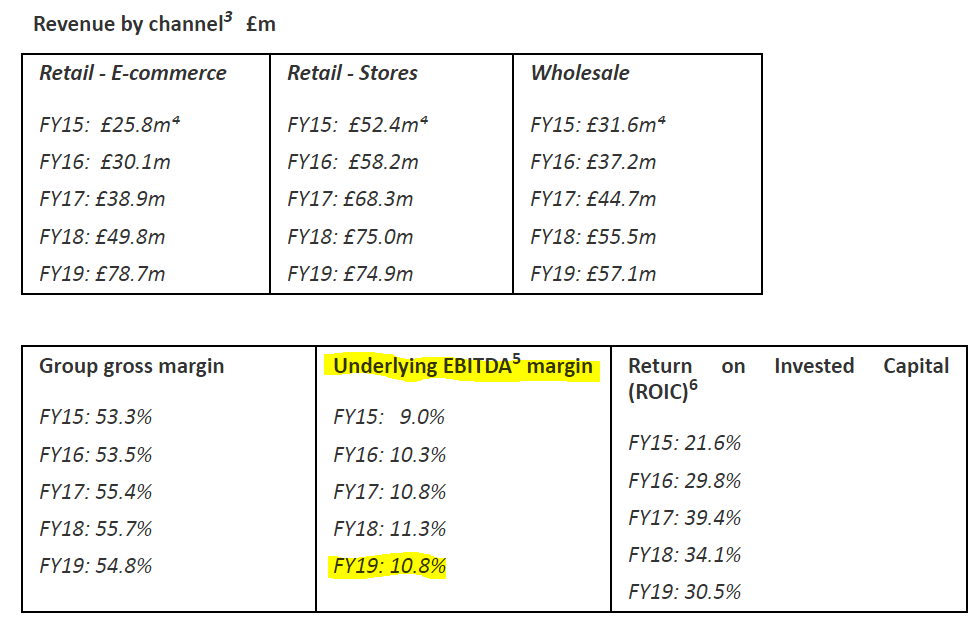
There's another table, of financial KPIs, which is also very useful indeed, and shows excellent 5-year performance. Although note that both gross, and EBITDA margins, have dropped a little in the most recent year - but not enough to cause concern;
What a model of clarity these results are, absolutely excellent stuff, and very investor friendly. It would take a lot of work for us to put together these tables ourselves, delving through 5 sets of accounts, so it's absolutely terrific that JOUL presents this information to us.
Balance sheet - looks pretty solid. NAV is £52.1m, less intangibles of £16.9m, gives NTAV of £35.2m, which is OK.
I note that intangible assets have gone up by £4.2m vs last year, which could indicate development costs being capitalised, so I'll check the cashflow statement next for that.
Working capital looks fine. It has £10.2m gross debt, more than offset by £16.0m in cash. This suggests that the cash position could fluctuate a fair bit, but that's not a problem, and it's healthy overall.
Cashflow statement - as you often find with retailers & hospitality sector, when hefty depreciation charges are added back, the cashflow is often much better than people realise. That's the case here, with a lovely £23.5m operating cashflow in FY19, and £21.1m in FY18.
Most of the cashflow is spent on capex, but they've not given the split of what is tangible, and intangible, of the total £11.5m capex. Although I can work it out, as follows:
Intangible assets grew by £4.25m in the year. Add back the amortisation charge of £2.67m, and I make that intangibles capitalised of £6.9m. That's 60% of all capex. I've done some more digging in the 2018 Annual Report, and all intangibles assets are described as "IT Systems" - a new ERP system is mentioned. I wonder if any development costs of its websites are also capitalised? That's not clear from the annual report, but I'd like to find out (as personally, I see IT development spending as payroll, and hence part of the normal running costs of the business).
There again, its eCommerce operations are growing so strongly, the investment seems to be paying off.
Note that significant additional capex of £14m is earmarked for fitting out the new Head Office. This seems an awful lot, and is likely to see the net cash position reduce in future.
Dividends are modest at this stage, with a yield just over 1%. Once expansion slows down, there should be scope to pay bigger divis in future, so the low yield doesn't put me off at this stage of the group's growth.
Director remuneration - seems a tad high, at £2.3m last year, FY18, for 3 Execs, and 3 NEDs. That included substantial bonuses. Directors own 34% of the shares. Share based payments were made of £2.7m in FY19 - considerably more than dividends paid to shareholders in the year of £1.8m.
I do wonder therefore if the split of the rewards is skewed a bit too heavily towards Directors?
My opinion - despite a few niggles above, the bottom line is that Joules seems to be powering ahead, when many other fashion brands & retailers are really struggling.
Its branding, and product, do seem distinctive, and are clearly striking a chord with affluent consumers.
Current year forecast is for a modest step up in adj EPS from 14.1p to 15.1p, so a PER of 16.5 - which looks about right to me. The forecast could be beaten, as it's quite a modest uplift.
If the company can continue growing as it has done in the last 5 years, then this share could be a good long term investment. It strikes me as more than just a retailer. It's investing a lot in product, and branding, and that is clearly working. Licensing revenues are small, but growing strongly, with e.g. DFS sofas branded as Joules.
Overall then, it gets a thumbs up from me, and would be something I might consider buying myself once the macro picture looks more stable.
My main concern is that, in the current climate, how high can a fashion brand's shares go? Would the current market be prepared to rate JOUL above a PER of 20? Probably not. Which means that, arguably, there's not much upside from the current PER of 16.5, in the next (say) year. If we go into a recession, then the rating could continue to fall, who knows?
So much though I like the company, I feel it's probably not the best time to buy its shares right now. It's going on my watch list though.
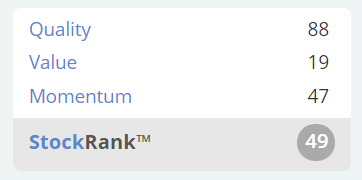
Stockopedia likes it, but is saying the shares are too expensive;
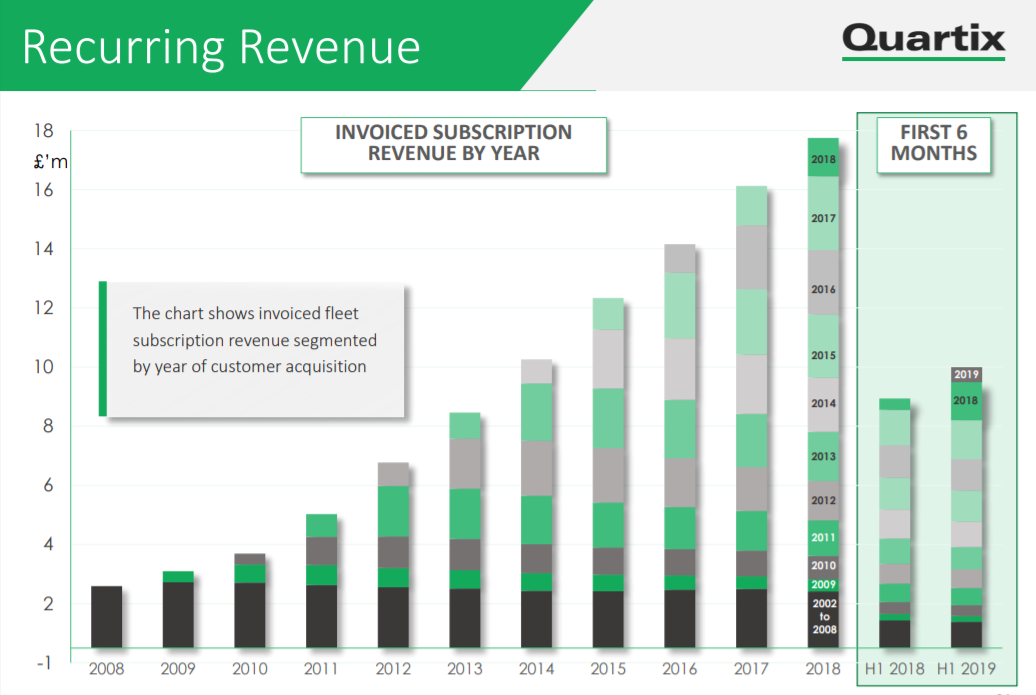
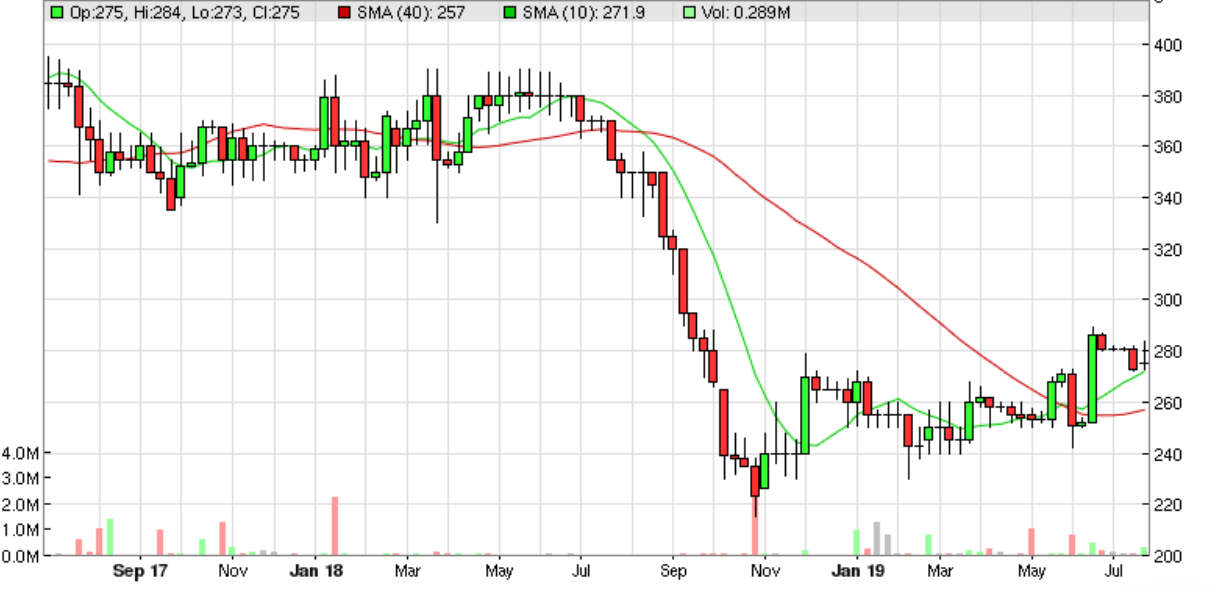
Quartix Holdings (LON:QTX)
Share price: 275p (down c.2% today, at 09:12)
No. shares: 47.9m
Market cap: £131.7m
Quartix Holdings plc (AIM:QTX), a leading supplier of vehicle tracking systems and services to the fleet and insurance sectors, is pleased to announce its unaudited results for the half year ended 30 June 2019.
The financial highlights initially look underwhelming, with H1 revenue down 3%, and profit before tax down about 18% to £3.2m.
However, dig a little deeper, and I think there's a much more interesting story going on behind these numbers;
- Low margin insurance telematics business is being wound down. The key number is fleet revenue (80% of total revenues, and the main profit generator) is up 11% to £10.1m
- Customer acquisition (marketing) has been stepped up, with £1m extra expensed in H1. Whilst a drag on short term profitability, each new customer produces a long stream of future, recurring, high margin revenues.
- New installations - a big increase, up 48% in H1 to 22,500 new installations. Total installations is now 138k & rising. This is what drives future revenues & profits. UK & France both stand out as growing particularly well.
Outlook - sounds confident, and is underpinned by the acceleration in new installations;
We are well positioned for future growth in our fleet business and continue to review the opportunities to invest in this further. We remain confident of at least meeting expectations for revenue, profit and cashflow for the year."
The Group has made a good start to the second half, in line with management's expectations.
The high levels of recurring revenue and opportunities to grow in the UK, USA, France, the rest of Europe in fleet underpin our confidence for the rest of the year and beyond. We will continue to use the financial strength of the business to invest in our core fleet operations.
I like "at least" in the above excerpt.
Dividends - unusually, for a smallish growth company, Quartix generates a lot of cash, and pays out decent divis. The forecast yield is about 4%.
Valuation - on a PER basis, Quartix looks pricey, for apparently little growth in recent years. However, the declining low margin insurance business is masking decent growth in the core fleet business. Plus, by expensing cost of customer acquisition up-front, then benefiting from a long (c. 10 years seems to be implied from the churn rate) revenue stream, is arguably a mismatch that understates profits. If customer acquisition cost were to be capitalised & then amortised over 10 years, to match revenues, then profits would be a good bit higher.
For that reason, the apparently high PER does actually make sense to me.
Broker forecast of 11.6p for FY 12/2019 gives a PER of 23.7
Broker forecast of 12.3p for FY 12/2020 gives a PER of 22.4
Bear in mind that those forecasts are probably conservative - given the strong growth in new installations in H1, I imagine the company could out-perform against these forecasts.
Balance sheet - this is a capital-light business, so it doesn't need a huge balance sheet. What there is looks OK to me.
Cashflow statement - a very decently cash generative business, that basically pays it all out in divis! How good is that?!
Segmental analysis - in note 2 - this looks new, and seems to give more information for us to see the moving parts more clearly. I'll go through that in more detail later.
Results presentation video - this is an excellent, 5 minute summary from the boss, Andy Walters. Extremely useful in understanding the key points.
There is a second 5 minute video, from the CFO, running through some key KPIs.
Here's an interesting slide showing the strong customer retention;
My opinion - I really like this company, it's very much the sort of thing that I would like to add to my long-term personal portfolio at some point, once all the Brexit stuff is sorted out, one way or another.
The product is clearly very good (long customer retention), and new subscriber growth rate is increasing. New markets are opening up. There's a time lag before that will benefit profit, but it's clearly in the pipeline. I think patient investors should do well with this share, thinking in terms of a (say) 3-5 year timescale.
The company is paying decent divis along the way, and won't need to raise any fresh equity (so no dilution).
It's not cheap on a conventional PER basis, but the best companies never are.
Also bear in mind that this share can be illiquid, so buying/selling is not always easy.
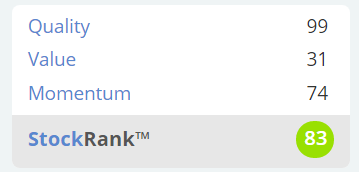
Stockopedia's computers like it too, with a "High Flyer" classification, and a high StockRank;
Sopheon (LON:SPE)
Share price: 800p (down c.15% today, at 10:55)
No. shares: 10.2m
Market cap: £81.6m
Trading update (profit warning)
Sopheon plc, the international provider of software and services for complete Enterprise Innovation Management solutions, issues the following trading update for the six months to 30 June 2019.
This share opened down c.30%, but has since recovered half of that drop, at the time of writing. It will be interesting to see where the share price eventually settles.
What's gone wrong? -
- H1 revenues are now expected to fall, from $15.9m in 2018, to $13.7m in H1 2019.
- EBITDA for the first half is expected to be approximately $2m (2018: $4.1m).
Checking last year's results, it capitalised $2.6m development spend for the full year. Therefore halving that for H1 this year gives $1.3m. Take that off EBITDA, and H1 this year is only likely to show about $0.7m cashflow - not very good at all for a company valued at $81.6m.
The reason? Contract delays. Sopheon is heavily reliant on up-front licence fees, so any delays can have a material impact on results. That's the Achilles Heel of many software companies. It's changing as companies move increasingly to SaaS revenue models, but that involves taking short term pain, for long term gain.
Outlook - management are positive about the pipeline, and I have no reason to doubt that;
Our sales pipeline includes a large number of opportunities where we are strongly positioned and that we remain confident have a high probability of closing in the balance of the year...
Since January, we have increased our sales pipeline value by 48 percent, and the number of opportunities above $500,000 in deal value by 29 percent...
Broker update - see Research Tree for an update. FY 2019 forecasts have been reduced as follows;
Revenue down from $37.5m to $34.0m. With only $13.7m in the bag from H1, this leaves a $20.3m target for H2 - a sequential rise of 48% on H1. That's possible, I've seen other companies do it. D4T4 springs to mind. But how on earth are investors meant to assess the likelihood of H2 turning out strongly? It strikes me as a leap of faith - you either believe in the ability of management to deliver, or you don't. The strong performance of recent years adds weight to the idea that this might just be a temporary glitch, but ultimately I have absolutely no way of knowing. It's educated guesswork trying to value companies with lumpy revenues, as the decisions are in the hands of potential customers.
Over time, predictability should improve, as more customers move to predictable, long-term SaaS revenues;
An increasing proportion of these opportunities are opting for a multi-year, Software-as-a-Service (SaaS) model rather than perpetual. This change in procurement preference to a rental rather than purchase model is coming sooner than we expected, but is in line with the Group's long term strategy.
A greater number of customers in the pipeline opting for SaaS licenses will, in the near term, have the impact of reducing revenue in exchange for increasing recurring revenue in future periods, and consequently a greater lifetime revenue from each customer.
The thought occurs to me that management perhaps need to work out some new KPIs, to explain this change. If they were to perhaps show a revenue chart, of new contracts, demonstrating the long tail of future revenues, and compare that with the old model of perpetual licences?
Net cash - there's lots of it;
With net cash of $18.7m at 30 June 2019 compared to $16.7m at 31 December, the balance sheet remains strong and highlights the Company's ability to turn profits into cash.
Balance sheet - last reported at 31 Dec 2018, it looks very good to me. So there are no solvency issues whatsoever - this company could easily afford to ride out a longer period of soft trading, were that to occur.
My opinion - Sopheon has done tremendously well in recent years. I remember, about 4 years ago, it was financially distressed, and things looked rather precarious. Since then, profits have soared, cash has piled up, and dividends have been paid. A very impressive turnaround.
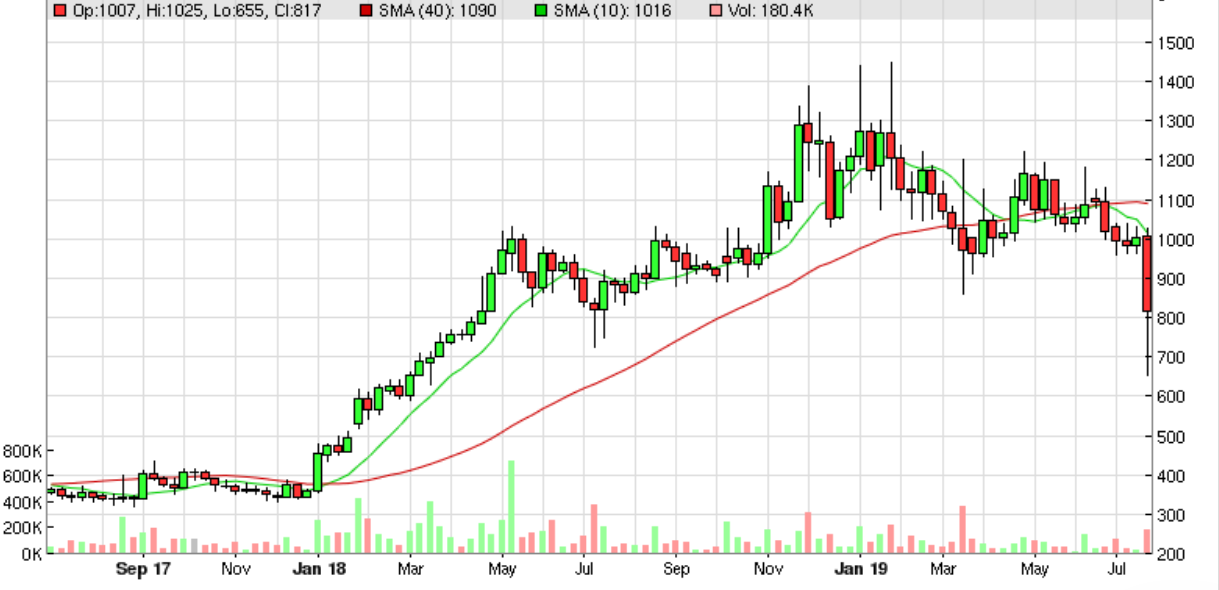
See the Stockopedia graphs below;
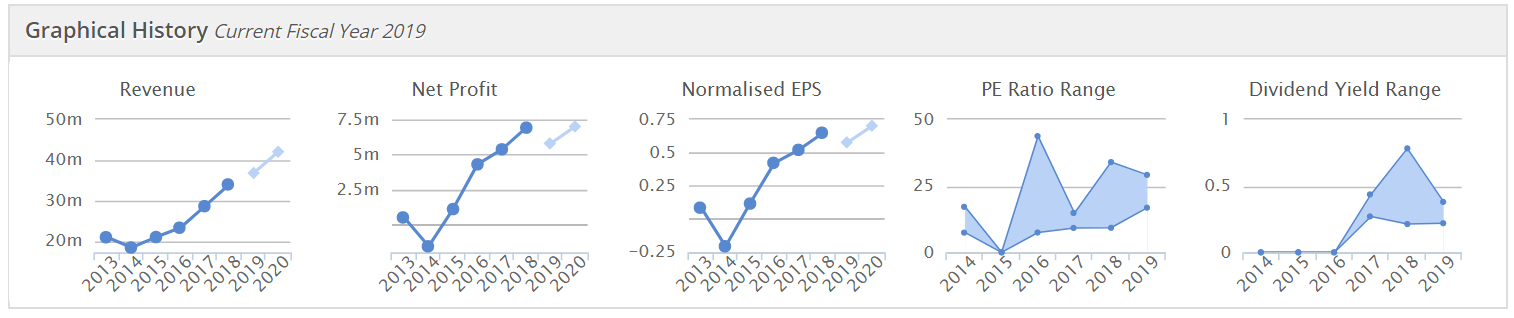
Is today's profit warning a recoverable glitch, or a sign of something more serious going wrong? I've got absolutely no idea! Revised EPS forecast for FY2019 is 42.7c, or 34.2p, gives a current PER of 23.4 times (based on a share price of 800p).
If you think earnings are likely to meet or beat revised forecast, and that this is a one-off bad half year, then it could be worth taking a long term view and buying on recent weakness. However, if H2 is not as strong as predicted, then the risk is of another profit warning, and another lurch down in price.
As I have no idea which outcome is more likely, I'll remain neutral on this share. Good luck to holders!
That's all for today.
Regards, Paul.
See what our investor community has to say
Enjoying the free article? Unlock access to all subscriber comments and dive deeper into discussions from our experienced community of private investors. Don't miss out on valuable insights. Start your free trial today!
Start your free trialWe require a payment card to verify your account, but you can cancel anytime with a single click and won’t be charged.