The Goldilocks Portfolio: How many stocks is ‘Just Right’?

Readers will be familiar with the story of Goldilocks, the curious girl who wanders into the house of three bears and eats their porridge. One bowl is too hot, one bowl is too cold, and one bowl is just right. The story serves as a kid-friendly illustration of the ‘happy medium’ principle — the idea that the best outcome lies in the balance between extremes. The principle is relevant in many fields, including investing, and particularly in the context of portfolio diversification. Investors often wonder how many stocks are ‘too many’ (’too hot’) or ‘too few’ (’too cold’)?
Various gurus offer advice. For example, Peter Lynch argues that ‘the average person can concentrate on a few good companies.’ He cautioned that ‘by owning too many stocks, you lose this advantage of concentration.’ It’s solid advice, but it still leaves lingering questions: what exactly counts as ‘concentrated,’ and when does ‘too many’ become a problem? We’re going to tackle this question with a particular focus on factor investing strategies. These strategies can help private investors beat the market, but only when the portfolio size is carefully managed…
This portfolio is too big
A large body of research suggests that factor investing strategies do outperform the market. Cheap stocks typically outperform expensive stocks. This is known as the value effect. Stocks that have gone up often keep going up. This is the momentum effect. And finally, profitable, cash-generating stocks outperform unprofitable, cash-burning ones. This is the quality effect. Our StockRanks give a higher score to companies with exposure to all three factors - i.e. quality, value and momentum (or QVM).
High-QVM stocks generally produce strong returns. Our simulated performance has returned around 300% since 2013 (assuming a semi-annual rebalance). The catch is that factor investing strategies work ‘on average’. If you randomly pick a handful of strong QVM stocks, your performance might not match the broader basket of all high-QVM stocks.
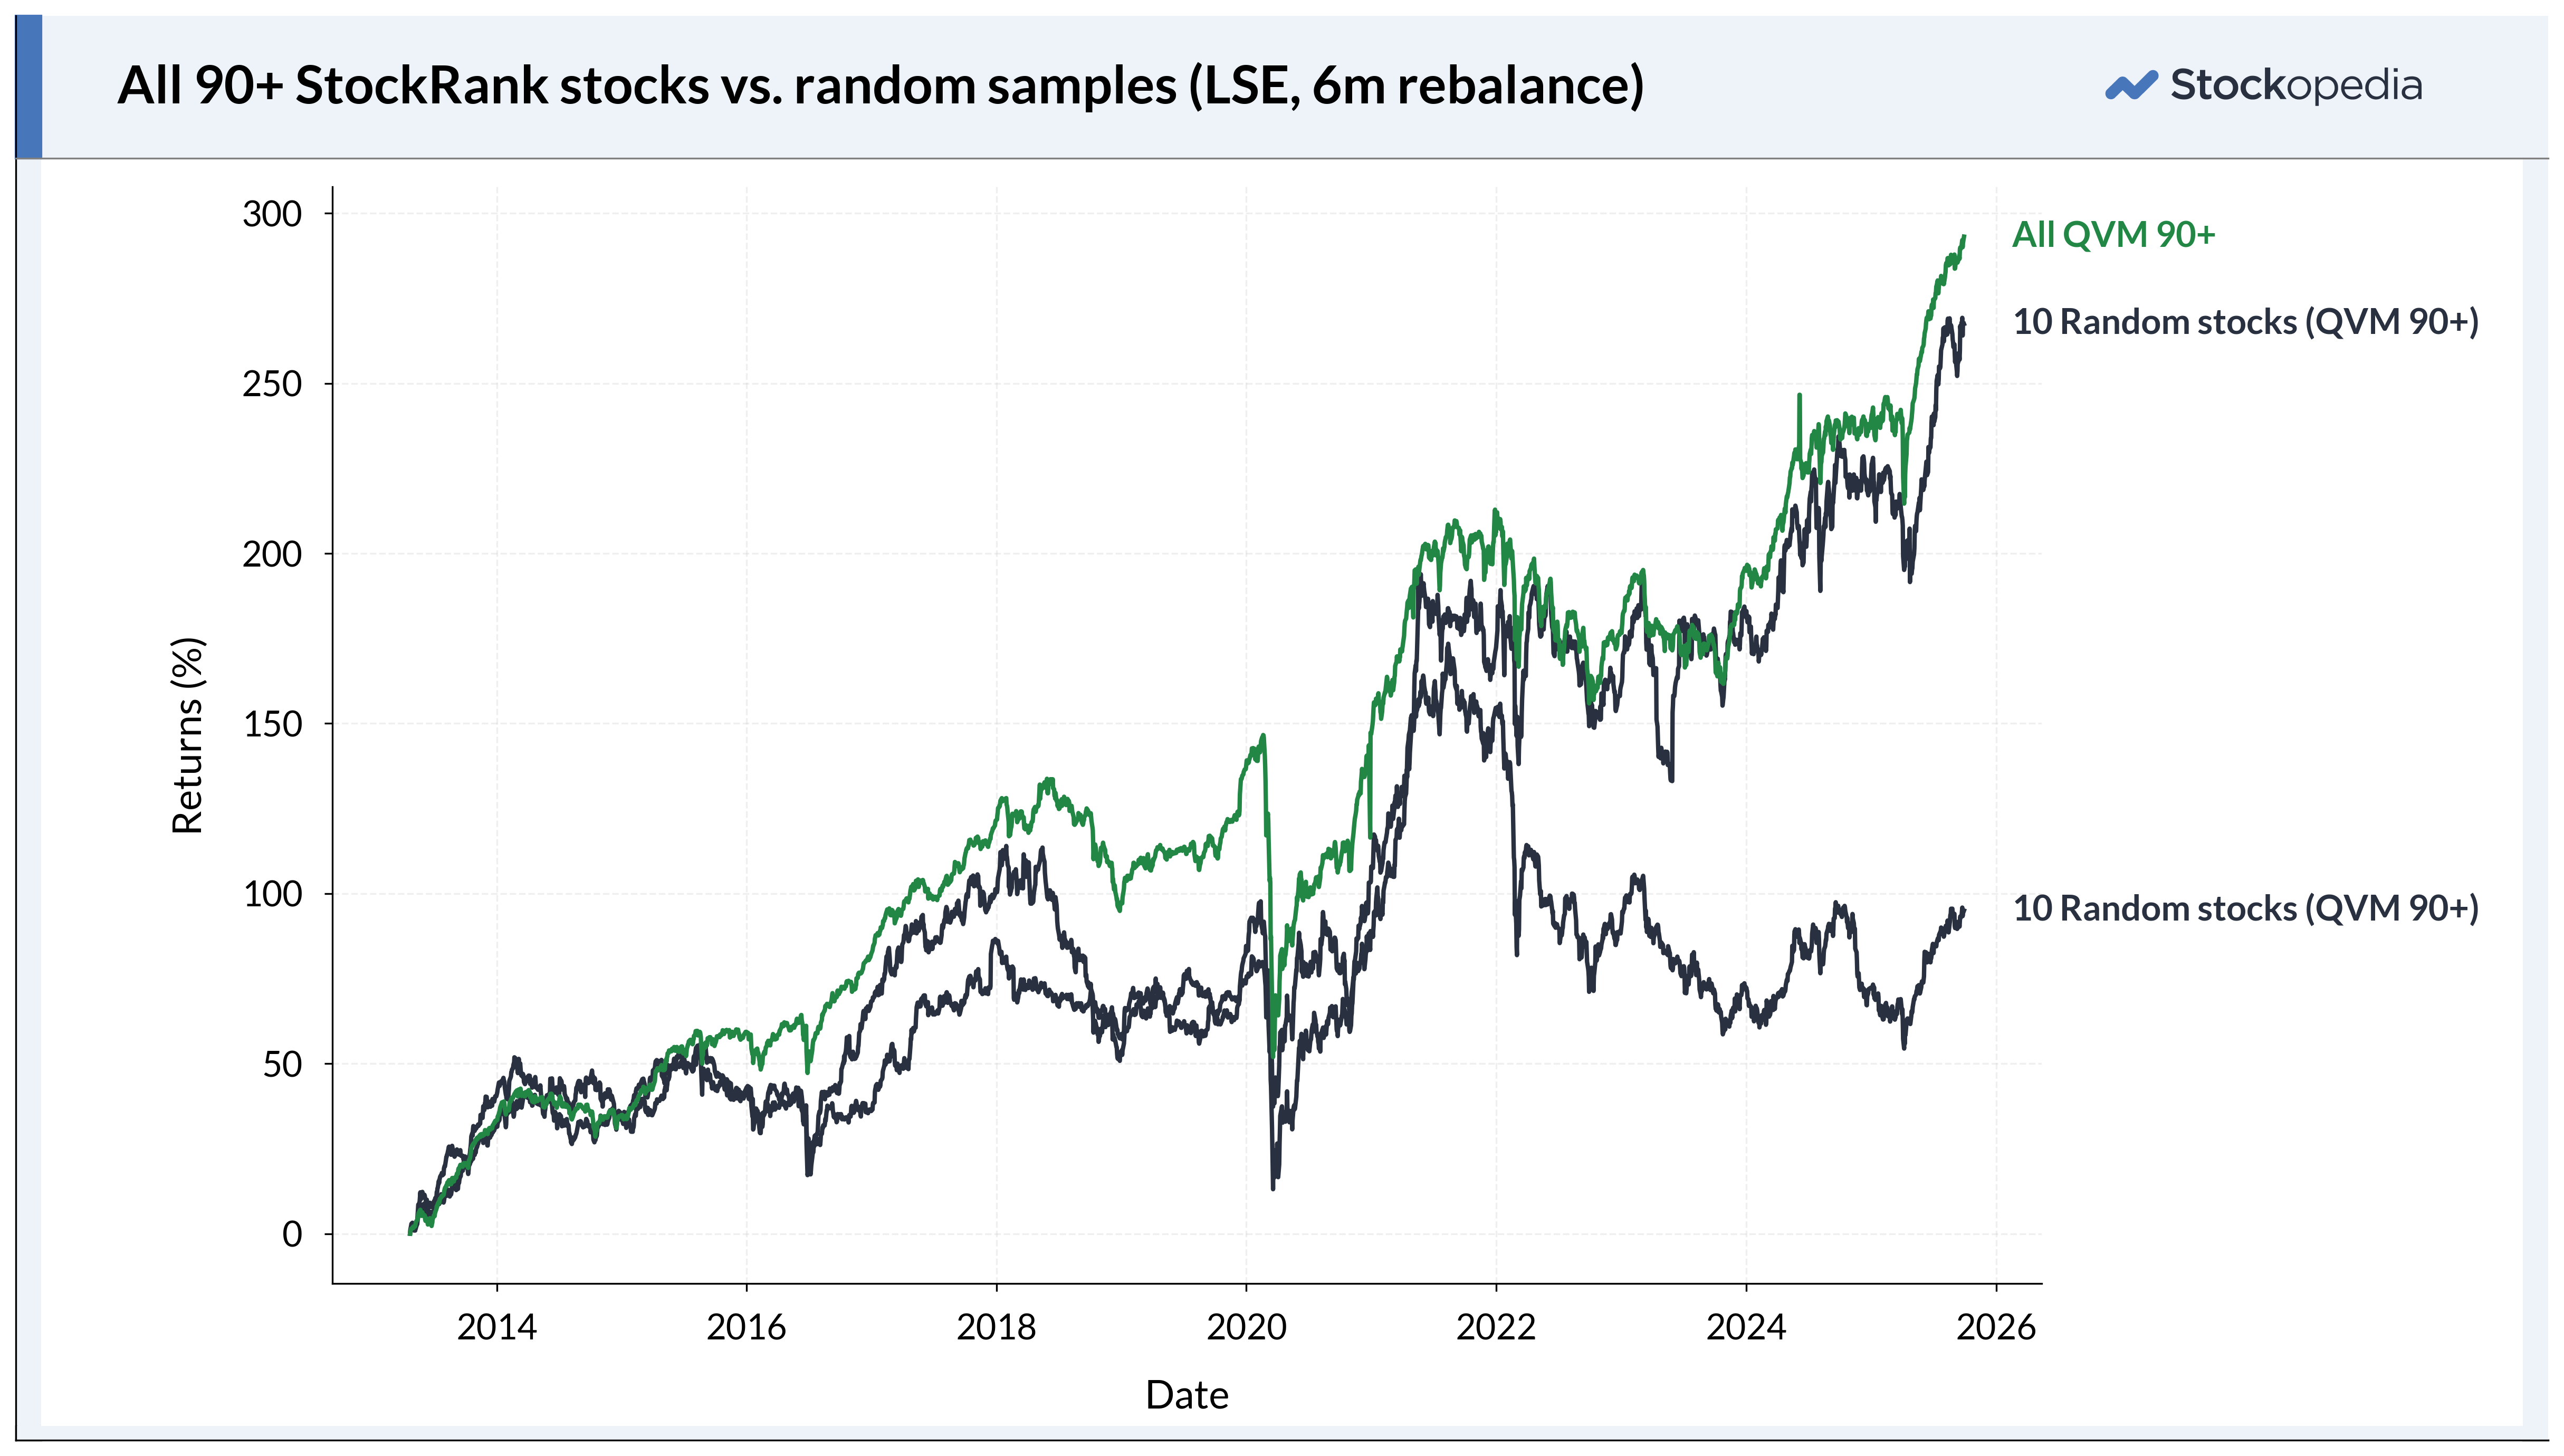
To successfully implement a QVM-based strategy, investors need to hold a “sufficient” number of stocks. At any given time, roughly 150 LSE stocks boast a QVM Rank above 90. Does that mean investors should own all 150? Of course not. Even a portfolio of 100 stocks would meet Peter Lynch’s definition of ‘too many.’ We can therefore rule out two approaches: the ‘random’ approach — throwing darts at high-QVM stocks — and the ‘total’ approach — buying every high-QVM stock out there. So there must be another way.
Instead of picking stocks at random, investors can rank the market by StockRank and select the ‘top-n’ stocks. The highest-ranked stock will have a QVM score of 100. The next highest might have ranks of 99 or 98, and so on. Generally speaking, the top 50 StockRank stocks had a strong correlation with the broader basket of all 90+ QVM stocks (see ‘All QVM 90+’ below). 0.95 is very close to a perfect correlation of 1.
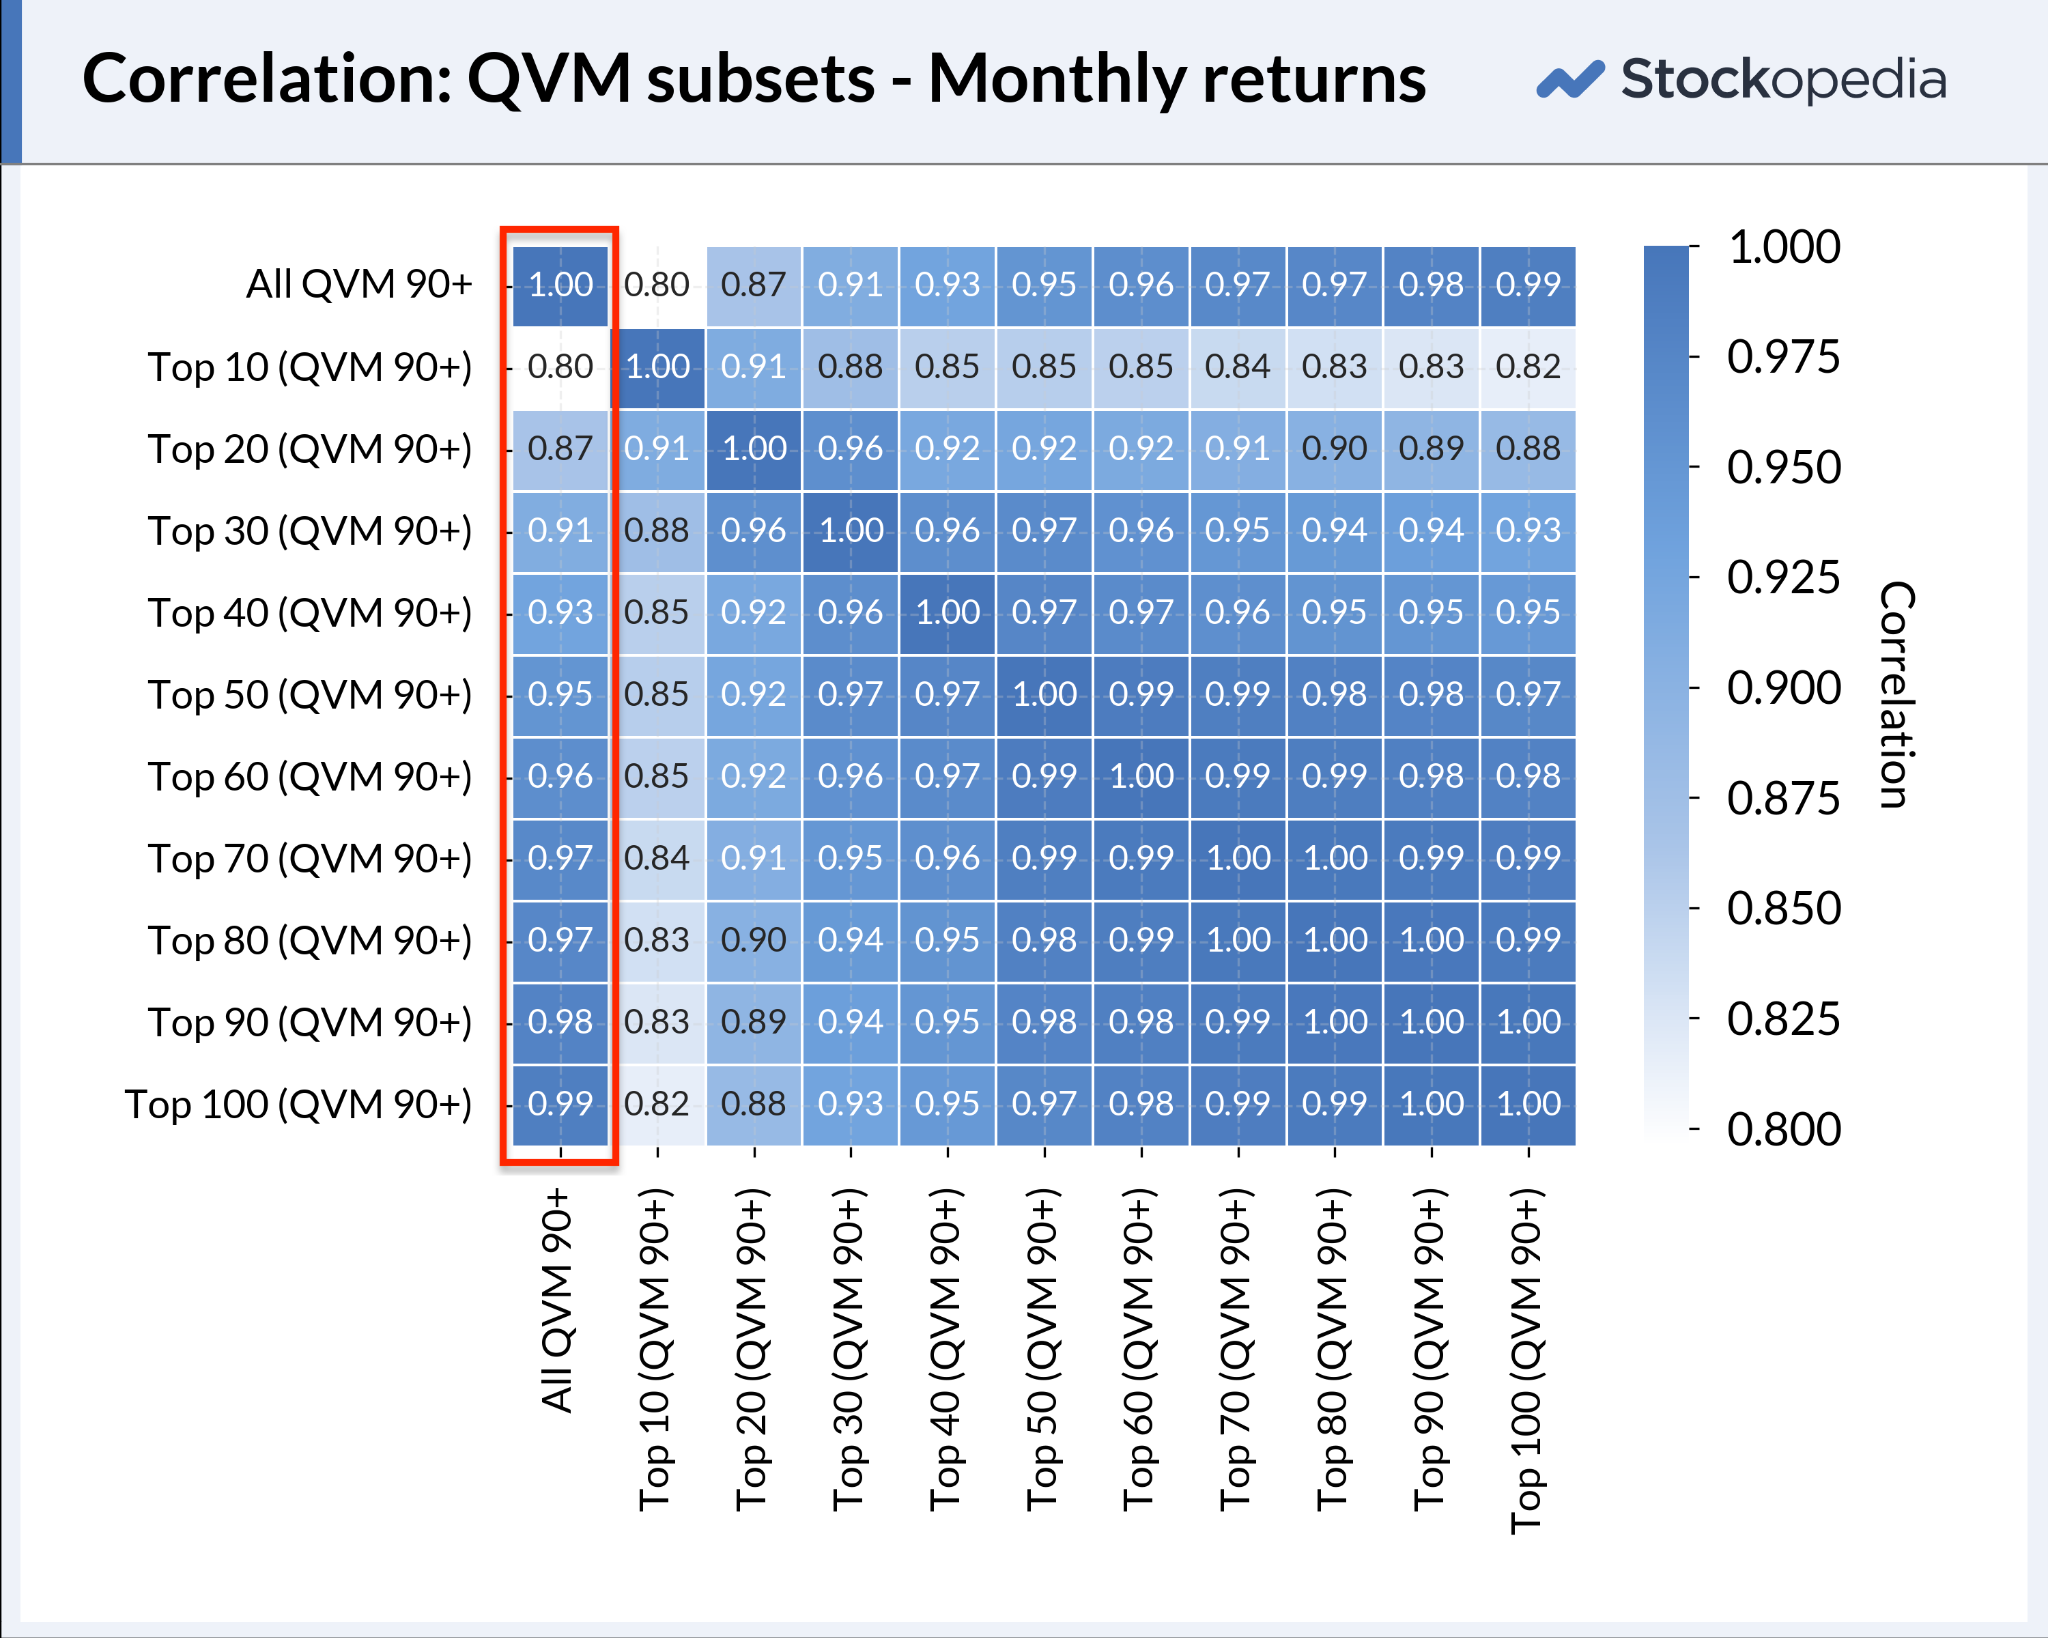
At the same time, the Goldilocks of investing would find this basket of stocks too big. A portfolio of 50 stocks can be expensive, because running a portfolio involves several costs, including stamp duty, the bid/offer spread and broker commission. Fees would eat away at your performance as everyone from brokers to the government takes a slice of the pie.
This portfolio is too small
If 50 stocks feels like too many, the next question is this: what is the smallest number of stocks a private investor needs to hold in order to implement a QVM strategy? The magic number could be around 20 to 30 high QVM stocks. The top 30 StockRank stocks generally had a 0.91 correlation with the overall basket of all 90+ QVM stocks (see above). Again, this is close to a perfect correlation. The correlation increases as more top-ranked stocks are added to a portfolio, but it does start to plateau once the top 30 are included. Even a portfolio of the top 20 QVM stocks shows a strong correlation of 0.87 (out of 1).
Does this mean we found the ‘Goldilocks portfolio’? Not quite...
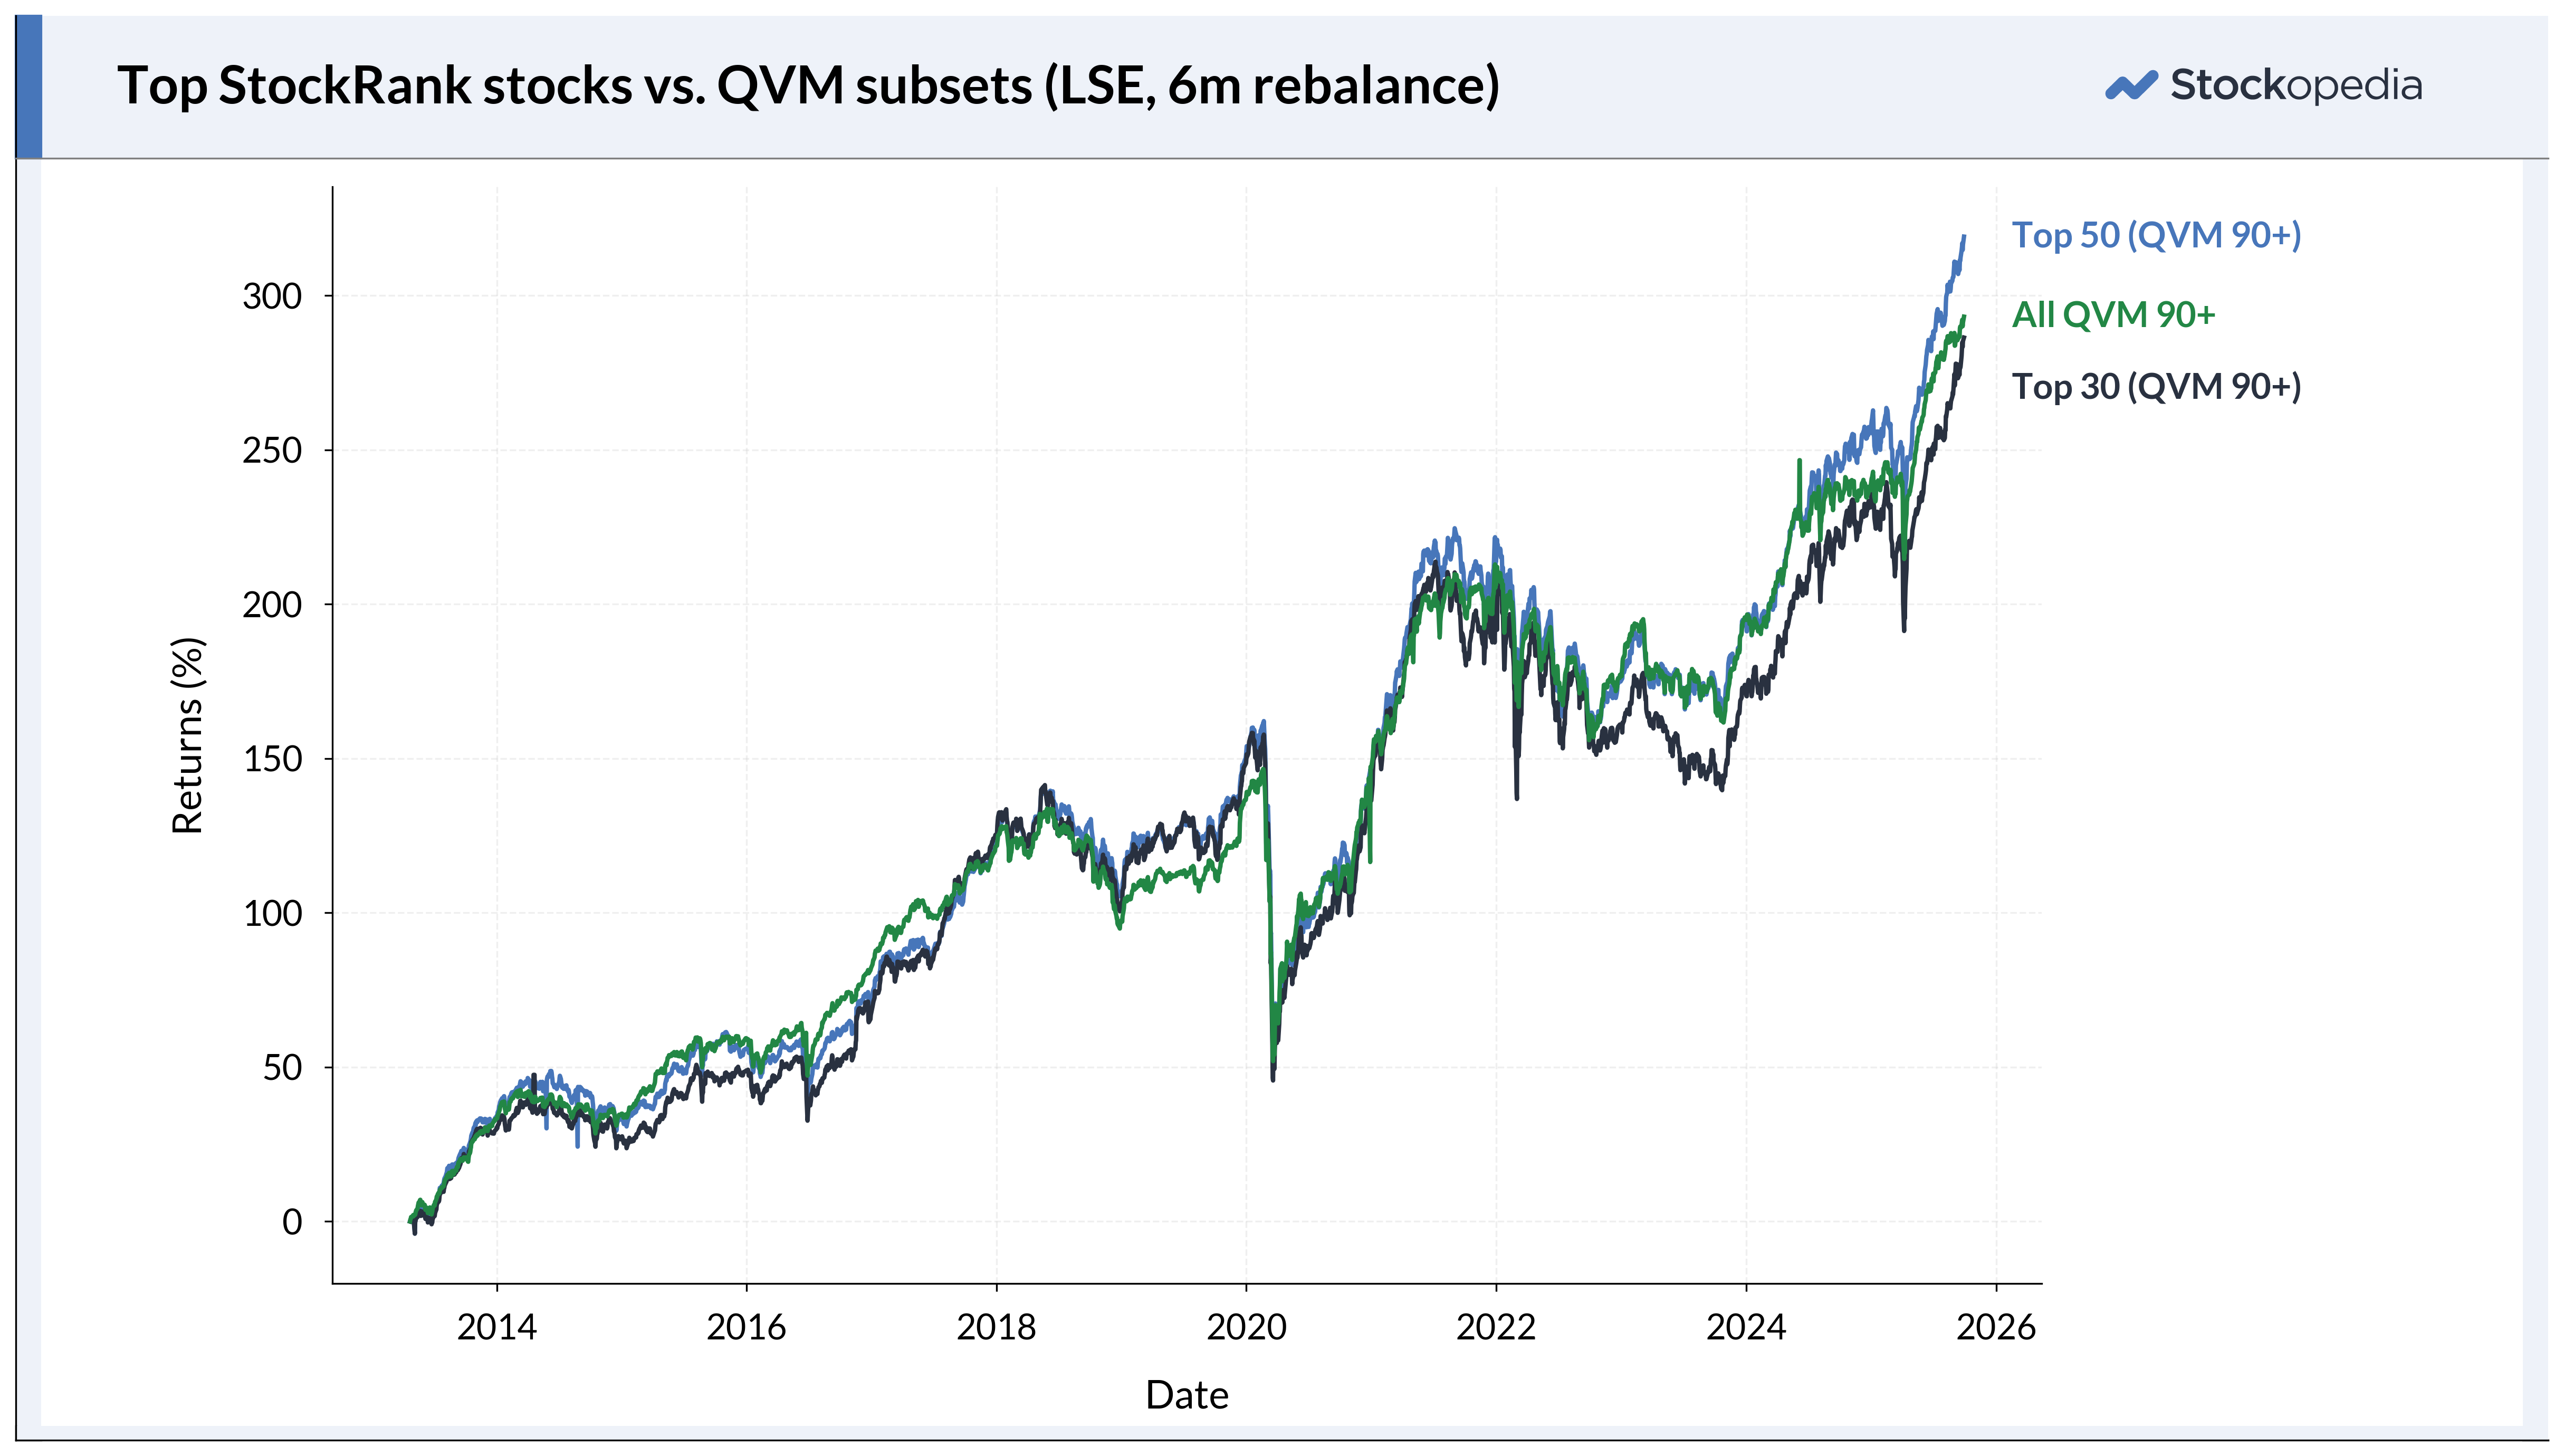
Simply piling into the top 20-30 QVM stocks isn’t a guaranteed path to success. These stocks can be volatile. When the market is performing well, the top 20-30 QVM stocks can outperform. However, when the benchmark struggles, these stocks may well underperform.
This volatility results partly from the fact that high-QVM stocks tend to be concentrated in cyclical and sensitive sectors. When the economy expands, cyclicals often rise faster than the market. When conditions deteriorate, cyclicals tend to fall harder. In other words, cyclicals amplify the market’s direction. They are regarded as ‘risky’ and because they are risky these stocks often trade at lower valuations. As a result, cyclicals are over-represented among high-StockRank stocks (which gives a higher rank to cheaper stocks).
2016-17
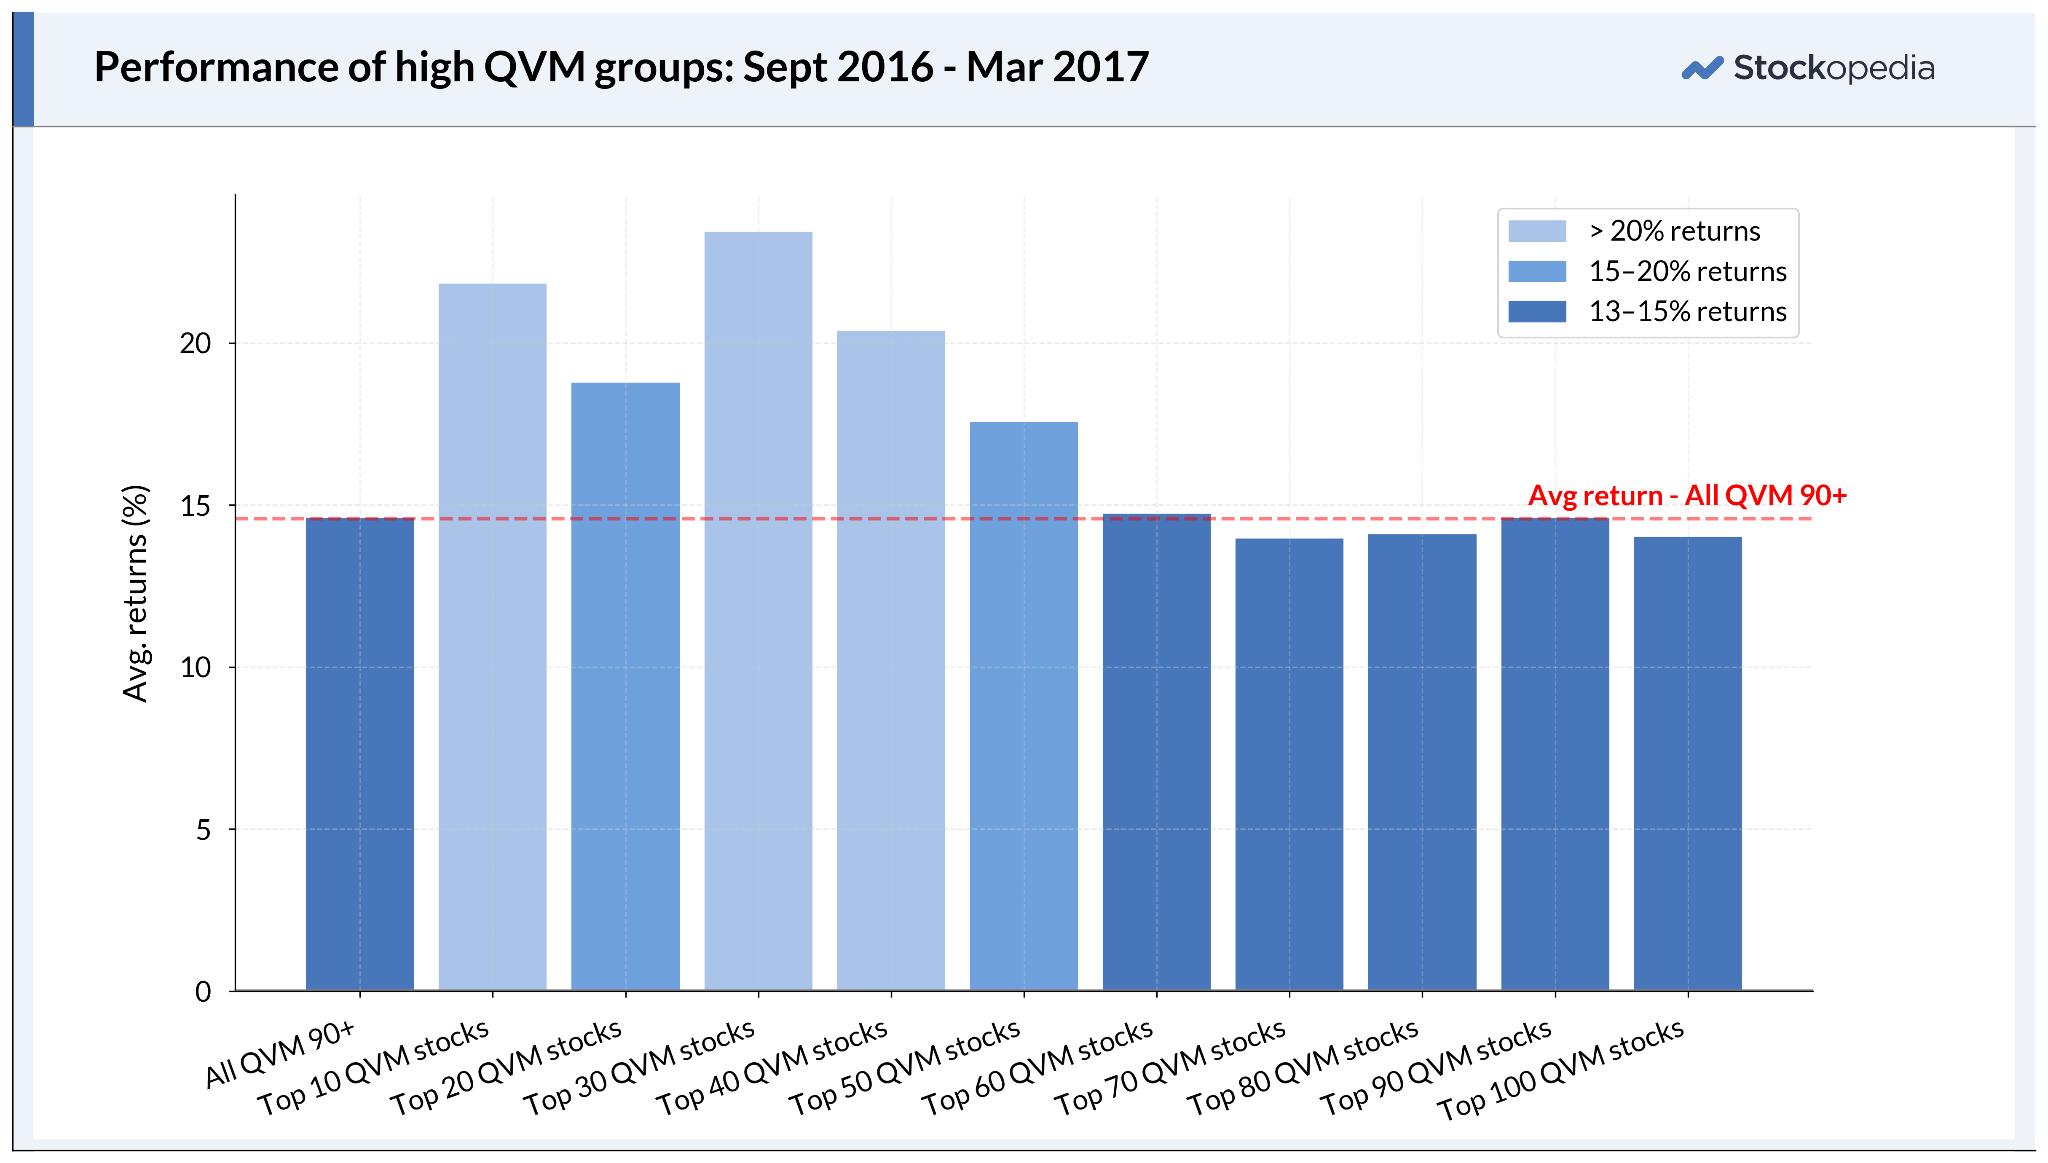
2023-24
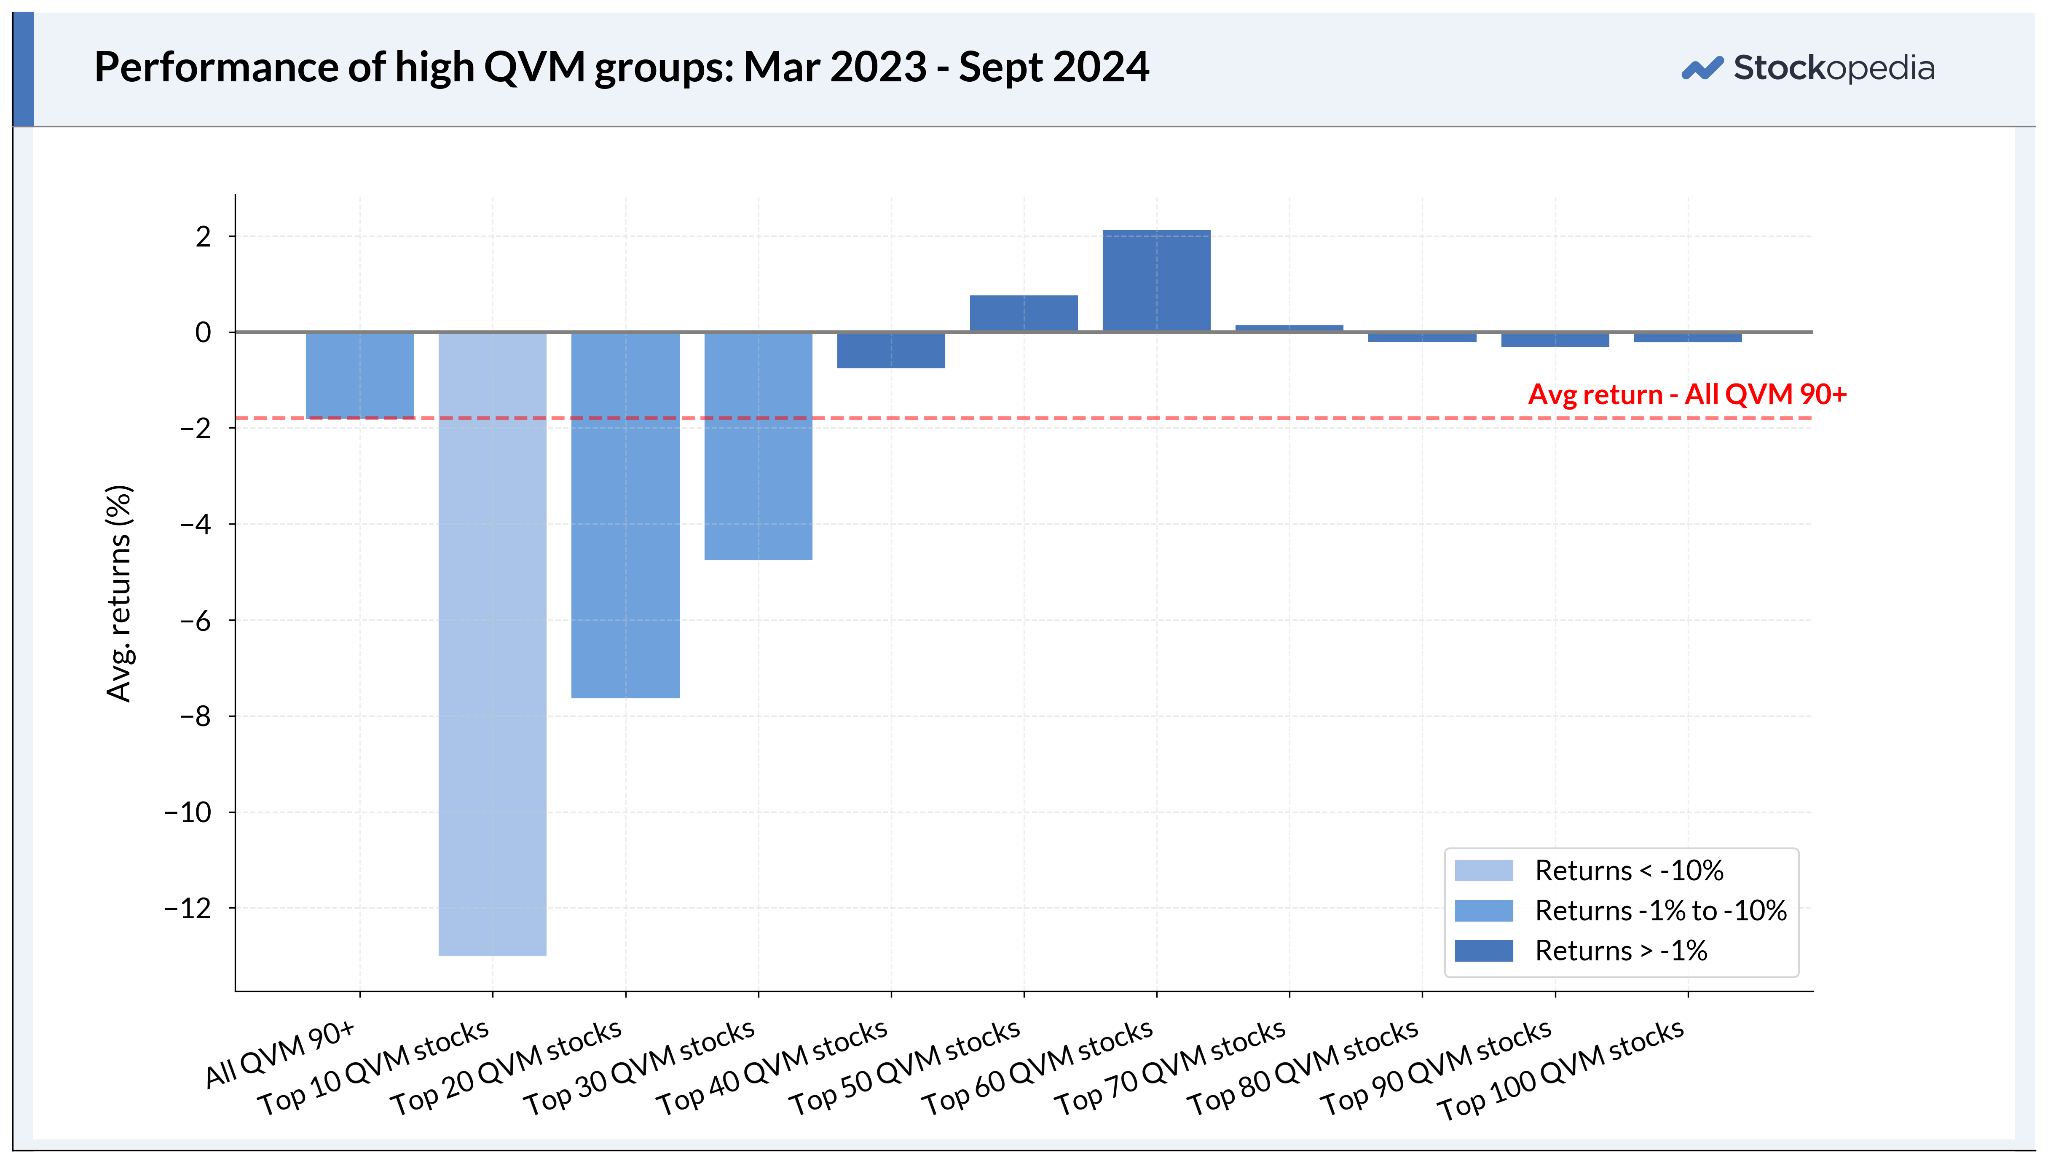
After adding all the high-QVM stocks to a portfolio, the sector breakdown is shown below. Cyclical and sensitive sectors clearly dominate. The ‘just right’ portfolio is still out of reach, but we might get there with one final ingredient: effective sector diversification…
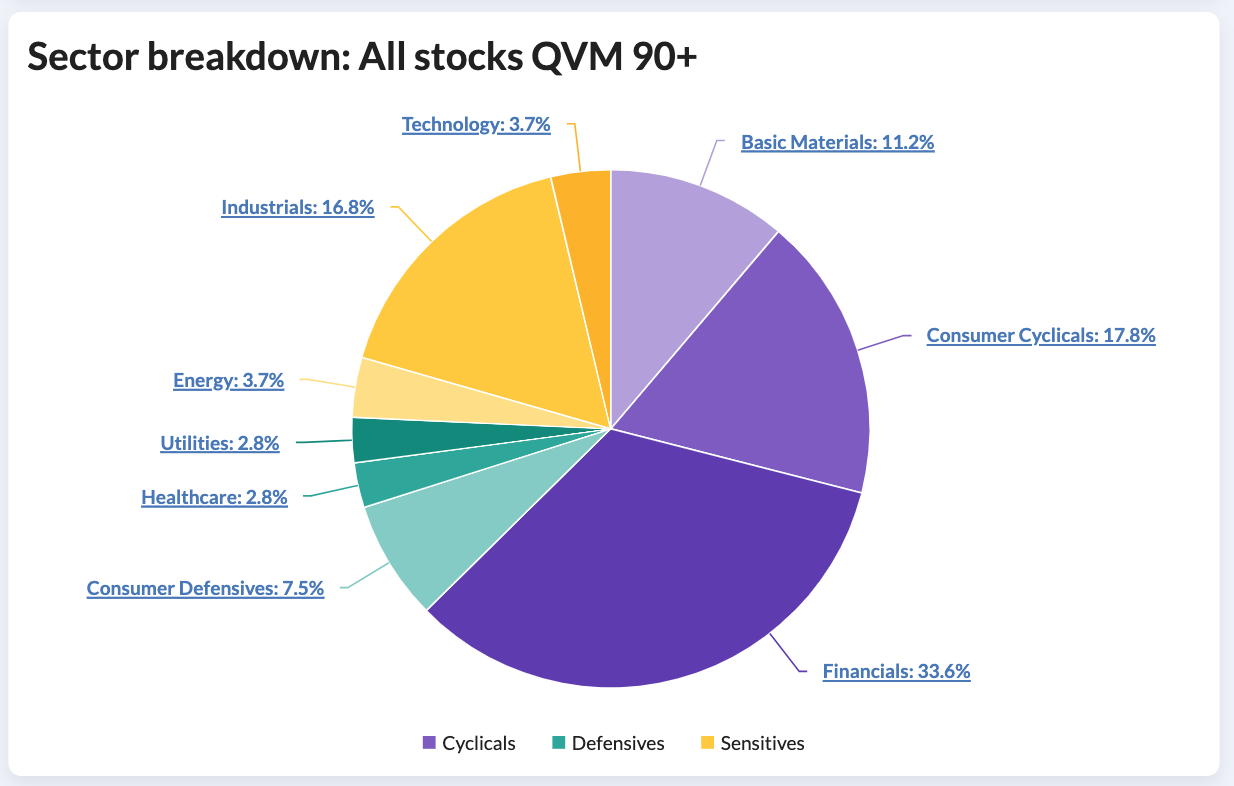
A final adjustment to make the portfolio ‘just right’
Sector diversification can reduce the risk of sharp drawdowns, because spreading investments across sectors prevents portfolios from being overly exposed to downturns in any single sector. If there are 10 economic sectors and an investor wants to hold 30 stocks, they could select the top 3 StockRank stocks from each sector. Alternatively, rather than diversifying across all 10 economic sectors, investors could focus on the three “super sectors”: cyclicals, sensitives, and defensives. In a 30-stock portfolio, they could select the top 10 StockRank stocks from each super sector.
For many private investors, a 20-30 stock portfolio with sector diversification could be the Goldilocks solution, assuming, of course, that those stocks are exposed to the factors that drive returns: namely quality, value, and momentum. This approach requires some hands-on management to track sector allocations and maintain the top-ranked stocks. But it’s manageable: since January 2015, Ed has been blogging his NAPS portfolio, which follows a similar strategy by selecting the top QVM stocks in each sector. The rules have evolved over time, and you can read the full history and updates here. The strategy returned 310% between January 2015 and July 2025. This not only beat the FTSE but, perhaps more interestingly, beat the ‘QVM Benchmark’ - i.e. the basket of all 90+ QVM stocks - which returned ~200% over the same period.
If anyone has experience implementing a factor-based strategy, I’d love to hear about it in the comments below. I’m deeply interested in bridging the gap between investment theory and practice. To explore this, I’ve invested a small amount (~£250 only) in a large basket of high-QVM stocks (holdings listed below) using Trading 212 to avoid broker commissions. This is not a serious sum of money. It is more of a ‘research’ fund, which can grow over time. My main aim is to identify a strategy and method that allows me to reliably and seamlessly track what I call the ‘QVM benchmark’ - the overall basket of high-QVM stocks.
Disclosure: I have invested in the following securities.
| Name | Ticker | Exchange | Stock Rank |
| Fidelity Emerging Markets | FEML | LSE | 99 |
| Global Ship Lease | GSL | NYQ | 99 |
| High Co SA | HCO | EPA | 99 |
| Kingfisher | KGF | LSE | 99 |
| M P Evans | MPE | LSE | 99 |
| Polar Capital Holdings | POLR | LSE | 99 |
| Smiths News | SNWS | LSE | 99 |
| Character | CCT | LSE | 98 |
| Currys | CURY | LSE | 98 |
| Gattaca | GATC | LSE | 98 |
| Ithaca Energy | ITH | LSE | 98 |
| Jupiter Fund Management | JUP | LSE | 98 |
| Kromek | KMK | LSE | 98 |
| Ramsdens Holdings | RFX | LSE | 98 |
| S&U | SUS | LSE | 98 |
| Seraphim Space Investment Trust | SSIT | LSE | 98 |
| Springfield Properties | SPR | LSE | 98 |
| Altyngold | ALTN | LSE | 97 |
| Galliford Try Holdings | GFRD | LSE | 97 |
| Pebble | PEBB | LSE | 97 |
| Seplat Energy | SEPL | LSE | 97 |
| Staffline | STAF | LSE | 97 |
| Carclo | CAR | LSE | 96 |
| City of London Investment | CLIG | LSE | 96 |
| Construcciones y Auxiliar | CAF | MCE | 96 |
| Frontier Developments | FDEV | LSE | 96 |
| Ninety One | N91 | LSE | 96 |
| Petershill Partners | PHLL | LSE | 96 |
| Pollen Street | POLN | LSE | 96 |
| Secure Trust Bank | STB | LSE | 96 |
| Sylvania Platinum | SLP | LSE | 96 |
| Anglo-Eastern Plantations | AEP | LSE | 95 |
| Biopharma Credit | BPCR | LSE | 95 |
| Capital | CAPD | LSE | 95 |
| Central Asia Metals | CAML | LSE | 95 |
| Imperial Brands | IMB | LSE | 95 |
| Johnson Matthey | JMAT | LSE | 95 |
| Angling Direct | ANG | LSE | 94 |
| GSK | GSK | LSE | 94 |
| Impax Asset Management | IPX | LSE | 94 |
| Standard Chartered | STAN | LSE | 94 |
| Supreme | SUP | LSE | 94 |
| Yu | YU. | LSE | 94 |
| Dr Martens | DOCS | LSE | 93 |
| Integrated Diagnostics Holdings | IDHC | LSE | 93 |
| Kier | KIE | LSE | 93 |
| TP Icap | TCAP | LSE | 93 |
| Schiehallion Fund | MNTN | LSE | 92 |
| Logista Integral SA | LOG | MCE | 89 |
| Vodafone | VOD | LSE | 88 |
Disclaimer
This is not financial advice. Our content is intended to be used and must be used for information and education purposes only. Please read our disclaimer and terms and conditions to understand our obligations.
47 comments
Great article. I realised a while back I had acquired too many stocks (over 70!) and am now consolidating down. It's a £1m plus portfolio comprising pension, ISA, and family trust designed to produce regular income. ATM I'm trending on average annual return of 30% plus and having only recently subscribed to Stockopedia am redesigning the portfolio around a small number of shares ranked as either Max - 4% of portfolio, Focus - typically 2.5% with a small number of 1% holdings. That's aimed at getting the number down to 40 stocks. Focus has to be on income but am factoring value as the key criteria for determining whether that income will continue to flow!
I'm currently working on a pure-play Momentum rank strategy. I buy at 99 and sell at 97 - US stocks only (tighter spreads and no stamp duty).
Its a high churn strategy, so I use Trading212 to avoid commissions.
So far, it has produced a 38% annualised rate of return, despite it including a bear market at the start of 2025.
In the long run, I expect this to come in at around 20%-25% annualised.
High beta portfolio, mind. Not for the faint hearted.
Screen rules:
- Mkt Cap over $300m
- No pink sheets, OTC shares, SPACS, Collective Investments
- Momentum Rank >= 99
- spread less than 50
Equal position size across a 20 share portfolio.
I’ve been doing something similar since mid 2017.
20 stocks rebalancing quarterly. Stock Rank >80, then select top 20 by momentum. UK listings only. Was quite volatile as you say so introduced a filter only 2 per industry group. From memory had a lot of consumer cyclicals going into covid.
+200% since and takes about an hour or 2 every quarter to sort out. if it doubles twice in next 8 years i’ll be retiring!
Hi Alex- a quick clarification if I may? You write: 'To explore this, I’ve invested a small amount (~£250 only) in a large basket of high-QVM stocks (holdings listed below) using Trading 212...' Is this £5 per each stock or did you create aTrading 212 pie? Thanks
Hey, Thanks for the question. T212 allow you to own fractional shares, but I think there's a minimum of £1 per share (from memory, don't quote me). I only invested £100, so £2 per share (50 stocks). The remaining £150 is cash in the account, which I will use a bit later.
PS - I didn't use the pies. I couldn't quite see if it is possible to use a limit order with a pie. It's something for me to check. Limit orders are important, because if they are not charging commission, they are potentially making their money from the bid-ask spread.
Thank you for your replies & clarfications, Alex. You cannot place Limit Orders on a T212 pie. But do you actually mean LO or Stop Loss?
Hey, I meant limit orders in this case. I suspected you wouldn't be able to use them with T212 pies. Thanks for confirming.
I'm running a NAPS portfolio (its formation was described here), but I decided to switch to a more actively managed approach in 2025 as inspired by Ed's QVM experiment (discussed here). My 1yr performace is currently around the 35% level:
How do you sell? And do you replace the whole portfolio each Jan 1st or run winners? Thanks and well done
I originally deployed my portfolio cash in three tranches over nine months. So rather than replace the whole portfolio at once, I actually hold each individual share for one year, and replace it on its anniversary date.
Along the way, a couple of companies were taken over and I had to decide whether to stay in cash until the anniversary or replace immediately. I decided to replace immediately and that led to a couple of shares having anniversary dates well away from the three original tranches.
This year I added sell rules: if StockRank falls below 70, or if there is a profit warning. That got me out of some other shares prior to their one-year tenure, which introduced even more dispersed anniversary dates. So now, I effectively have a rolling portfolio: I track my anniversary dates in a spreadsheet, I use Stockopedia alerts for the StockRank rule, and I read results announcements for profit warnings.
These articles inspired me for my current methodology:
'NAPS to QVM' Experiment
Profit Warning Survival Guide
Surfing The Stock Ranks
At the end of the year I will assess if my sell rules benefited or hindered the portfolio.
Thanks for the detailed reply, will be interested to hear your updates, certainly sounds a good system and less stress as you have the rules set
excellent article. I did wonder whether the styles would be better tool for ensuring diversification rather than sector - high flyer, contrarian, turnaround and super-stock etc. I tend to use the dual ranks rather than the stock rank for this reason. I was minded of some comments from the Aberdeen UK small companies manager about value and/or growth stocks doing better over different time periods. Proportions could be based on returns since inception. Style neutral is the anomaly .
Maybe it's time for an update on the NAPS portfolio? I know it was going like the clappers back in August but since then...? markets not been great has it. Would be good to see the rough as well as the smooth!
Hi WTT,
I monitor the NAPS portfolio on a spreadsheet. I get slightly different results from Ed Croft because I include trading costs, stamp duty and dividends. At the beginning of the year I assumed £2500 invested in each NAPs holding and replaced Alliance Pharma (acquired) with SDI as Ed did, adding the profit on sale to the portfolio return.
On this basis my estimate of the capital gain is 26.3% exc. dividends and 31.7% with dividends and the profit on sale from Alliance Pharma. This is definitely down from NAPs performance earlier in the year but still a pretty impressive return. Inevitably my own version of the NAPS (more like the Ed's QVM version that he initiated this year) set up with real money at the end of August doesn't seem to be matching the NAPS performance with a paltry return of 6% though I guess it is early days !
Hey,
Just a quick note: It is worth considering that the NAPS is not a QVM benchmark, as such. The appropriate benchmark for a QVM strategy is arguably the top decile of QVM stocks - i.e. the basket of companies with a 90+ StockRank.
This 'benchmark' has returned just over 1% since August; that's less than your 6%. It may not be totally obvious from the chart, but on 25 Aug, the top decile was at 337.38%, compared to 342.93% now.
That's a 1.26% gain - i.e. ((442.93/437.38) - 1) * 100
NB - I think Ed will be updating on the NAPS in the new year.
Alex
Hi Alex
Thanks for the confidence boost. Given the number of investment trusts I hold which are seriously under water (pretty much all renewables and infrastructure sectors) any positives are welcome. The QVM approach that Ed described in his blog with its more ‘active’ rules approach to the NAPs portfolio is what I have implemented in a stocks and shares ISA with Interactive Investor (they offered £100 of trading commission in August so could buy 20 stocks for free! ). This more ‘active’ approach uses soft stop losses related to risk types (Conservative, Balanced, Adventurous, etc), sector diversification , selling on profit warnings and acquisition announcements, and replacement of sold stocks with the next highest rank that meets sector diversification criteria. Additionally stocks that issue ‘ahead of expectations’ or similar positive updates will be retained even after the normal NAPs holding period of a year. This approach is certainly proving to be active as 4 stocks have already been sold including that great early winner for Ed SDI (LON:SDI) which replaced Alliance Pharma!
Thanks for that, still doing very well!
Did you presume he sold and replaced SDI?
Yes I think that was what Ed reported in one of his blogs if you mean sold Alliance Pharma and replaced with SDI (LON:SDI) . As far as know SDI (LON:SDI) is still in the NAPs. However, having reread the blog I may have got my wires crossed on this.. Ed made the change in his QVM variant of the NAPs but left the NAPs with 19 stocks (I think it’s getting late
I have it at about 27% year to date...
Fantastic, thanks Ed
Did you sell SDI or is the stop loss (soft) 15% from entry or from current high? Thanks, QVM really demonstrating its worth again
Hi Alex
good article. You asked about others experience of implementing a factor based systems. I’ve been running a factor based system for a little over 10 years. Compound return a little under 17% pa over that time period, split between 2015-20 at about 13% and 2020-25 at about 22%.
I focus on a very small investable universe - small caps between 50-1000m with strict sell rules and c 20-25 stocks at any one time.
Factor investing has been one of the best decisions I’ve taken with my money. My performance using my own judgement (in the period 2000-2015) was volatile and ultimately below the market. Over time, I’ve come to accept that I am neither smarter or cooler headed than the market. But, I can follow rules.
I think there are many ways up the mountain though, so I wouldn’t advocate anyone blindly following my (or indeed anyone’s) approach. I was struck by Phil Hoffer’s articles and stories last month. He used the same principles as I do, but arrived at a radically different investment universe and methodology. Ultimately I think you have to develop a method that suits your mind and stomach.
An opinion (can’t back it up with analysis, but informs my own thinking). Diversification is important, of course, but I think it is secondary in importance to the question of : when do you sell?
If you imagine that you are a blind stock picker throwing darts at a board. You aren’t allowed to choose what you buy, but you ARE allowed to decide which darts to remove from the board and rethrow. Over time, even a blind stock picker will end up with every dart in the bullseye.
It follows (in my mind, anyway), that what stocks you buy matter far less to your long run score than which ones you sell. Refining my sell criteria and approach is the main thing that has changed over the last ten years and remains the area I spend the majority of my effort on the portfolio. I don’t know for sure, but am reasonably confident that this is also the reason my returns have improved.
Kelvin - can you share your sell rules please. Its are area that I am really struggling with and I need a rules system.
What blows my mind up is that when the market falls, everything falls, hence "hard" price numbers and % fall numbers don't really work. It currently seems to me that using a rigid stock rank / momentum or other stock type rank number as a trigger is the way to go.
Just as an example TPFG has trended down due to softer housing market concerns. However they have most areas of the housing market covered so if one area goes down another goes up.. All their numbers are declining but its "the market" that is the issue, not the company. I have no idea what the tactic here should be.
Hi LLG (I’m sure you are both lovely and gorgeous!)
As of today I have three simple rules:
1. sell a profit warning instantly.
2. Sell if the Stockrank goes more than 10 points below the buy level I would use for that size of stock.
3. Sell if there is a takeover offer
I wrote them up a few years ago - on this link here. https://www.stockopedia.com/co...
and this link here. https://www.stockopedia.com/co...
i still feel like a novice on this though - it’s incredibly hard to backtest a strategy so I won’t pretend to have it figured out at all. You have to keep a track of all your sell decisions in a parallel portfolio and then compare this against what you bought. But that’s not a statistically robust way of evaluating the sell rules in isolation from other factors.
I’ve been doing some research on this, at the moment just some notes in my journal, but this is a nice prompt for me to pull it together into a coherent post (next weeks job!)
Thankyou very much for this.
I'm going to make myself a document with a couple of simple sell rules that covers stock rank numbers and Ichimoku sell indicators and see how it goes.
I put on my profile how my nickname arose. Its a very long running joke in the family. I should really use my real name on here which is plain old Stephen Iles. I use the nickname all over the place when a "User Name" is required as it makes me laugh.
I agree that sell rules are more important than buy rules. It is easy to be logical and cool with shares we do not own. But this is nearly impossible with those we do own.
It is interesting that most investing books focus on buy rules and neglect the sell side of trading. Not sure why that is?
Thank you for this. I understand 1 & 2 but why 3.
Its relevant to me as I have a large holding in Anglo Asian Mining (LON:AAZ)
Regards
Michael
3. Anglo Asian Mining (LON:AAZ) is hardly ripe for a take-over unless by Putin. I disposed of Anglo Asian quite a while back (no divis) but was a bit premature in that action. I think the returns turned up in other small miner holdings so no matter now.
I sell on a takeover offer because the open market price vs offer delta is (on average) not great enough to justify holding to completion when accounting for risk.
Broadly, if there is an offer there are three scenarios:
1. The offer completes on the terms proposed
2. The offer falls through (buy side walks or cannot complete diligence)
3. Counter offer emerges at a higher price.
In most cases (90%+) scenario 1 applies, and the market price is usually the offer price minus a discount that reflects the time spent holding the stock until completion. That discount is usually small - 8-10% annualised.
=>so you should sell. If your expected return on capital from your wider portfolio is lower than the market average, then you shouldn’t be investing personally at all.
In scenario 2, the impact of a failed offer is usually a catastrophic (50%+) fall, so you should sell
It is only in scenario 3 that you MIGHT get a higher return than your expected return on capital. That’s less than 10% of cases (probably much less)
Of course you might have specialist knowledge or insight that gives you high confidence that you know better than the market. But the whole point of factor based investing is to remove individual judgement from the process and adopt rules that help you win more often.
As with all things, I could be wrong, and keep my eyes peeled for data that could help make better rules. But for the moment as I accept that I’m not smart enough to reliably pick the <10%, I sell rather than try to overthink it.
Thank you.
Spot on this is where Robbie Burns is so good, I've been on some of his seminars and his research criteria is pretty quick and that's not a dig at Robbie as he has simple processes in place to screen out dross.
What he is a absolute master at though is binning losers quickly and this in reality for most of us is so hard to do particularly if you find your recent purchase/s heading south 1-2 weeks after buying them.
Yep - I’m not quite as ruthless as Robbie’s systems recommend. But I have learned - painfully and expensively the importance of cutting your losers.
I find it somewhat scary when dividing portfolio cash available by the number of stocks for the portfolio. Say you had £1 Million ( I have no idea what size peoples portfolios are ) and go for 20 stocks - thats £50,000 per share invested with not a huge amount of looking into each company.
A holding of say £5,000 feels more comfortable but that means 200 stocks which is bonkers.
Maybe it's all relative and you just get used to dealing with bigger numbers.
So, back to work to grow my portfolio to give me a big wodge of cash to worry about !
Just numbers was my wife's comment. The reality is that every number must be meaningful otherwise they are meaningless and should not be entertained.
You can phase into and out of a position in 3 or 4 staged transactions - build a full position as your knowledge increases/ reinforce success; phase out as momentum falls away/uncertainty increases.
With values of £50k per share with the UK Market one would have to be very aware of getting stuck with an illiquid share. Selling becomes extremely difficult when an illiquid holding starts to go South.
Correction to my early comment, we also hold Ninety One which is on the list.
Apart from a good supply of cash there has been nothing to stop me from buying into a large number of companies, monitoring and weeding the weaklings out and strengthening those on a winning streak. It's a slow process, results will be coming through for years ahead. Around the hundred mark now, perhaps I should be calling it the CentiNAPS because it loosely aligns with Ed's theory. Below is the year-to-date performance. Dividends are appreciated but not considered esential. I certainly agree with all that Alex is saying, good job!
Silver
Hey, Thanks for this. Just out of interest, I presume CentiNAPS means a take on the NAPS with 100 stocks (rather than just 20). Do you apply sector diversification approach, or do you simply buy a large basket of 'any ole' high QVM stocks?
Hi Alex, yes, currently 94 holdings. I buy dips as well as high QVM stocks and chase small gold and metal miners up. A third of our portfoios are in those miners, they give me space to work on the QVM side. Of your list, I would have liked to have kept POLR, GFRD, YU. and maybe DOCS but sold them too soon just as I did with IMB and STAN and regret it. Those that I am holding are SNWS, CCT, ITH, SLP and CAML.
Great article Alex. I've only been a subscriber for about 9 months and have played around with a number of similar ideas whilst I'm researching and building knowledge. The interesting thing I've found with blindly following any sort of system is that it may work well on paper but is hard to follow in practice.
I had a portfolio of 40 high SR companies for a while, allocating the percentage of stocks in line with the total percentage of stocks (not market cap) that sector represented in the index. This portfolio was well ahead of the index for a few months and it then reversed after a few profit warnings. When I dug into the companies that warned I could see the problems were not hard to find. I found that hard and was really kicking myself for not doing some basic research. Overall I was still ahead of the index but I found it hard to maintain because I didn't understand how much risk I was taking. The lack of knowledge of what I was buying made it feel like I was gambling and I doubted I'd still the course if I experienced longer term under performance.
Since then I've kept the sector split but now have an equal £ split for all companies in a sector with the sector £ total being a percentage of my portfolio that matches the market cap of that sector within the index. So Vodafone (LON:VOD) is my only telecoms stock and I started with 1.8% of my £'s in that. In financials I have 6 stocks starting with each holding with about 4.5% of my funds.
I also moved to selecting companies from the qualifying list based on how well I understand the strategy, how well defined it is (is it fluff or are there target numbers to achieve) and how the company are performing against it. My aim is to sell only if the ranks deteriorate significantly and/or the strategy story no longer holds up. The theory being that a high QVM stock (within its sector) with a good plan that they are at least meeting will drive a re-rating. Time Finance (LON:TIME) is one example of a business in my portfolio that has a clear strategy with clear number targets and has a track record of hitting those numbers.
It's very early days. I'm about 6 weeks into this little experiment and I'm tracking well behind the index. My worst performer at -25% is SDI (LON:SDI) and my best at +20% is GSK (LON:GSK). All trading updates and results have been at least in-line with many ahead. There are two today Hill & Smith (LON:HILS) in-line and Afentra (LON:AET) in-line.
Although I'm still finding it tempting to trade out of the like of SDI and a couple of the others I'm just about able to wait until the results before taking any action. So, trading on news and not on fear or any set stop loss. I think I'll also find it easier if one does issue a warning or slow down and I have to sell because I understand why I bought it and what I expected of it. I topped up ITV (LON:ITV) when they dropped because a major shareholder sold a big stake and had the confidence to do that which was good. I'm still down about 3% on them though.
Because I'm doing worse than the index when I'm getting plenty of ahead results I'm finding it very challenging just sitting on my hands and following my plan. However, I'm still following it and I think I've more chance of keeping on track this way than if I was suffering the same under performance by following any type of system. I may be wrong though as it is frustrating to add lots of time, energy and intellect only to derive a worse result than if I'd just picked either the index or a basket of 95+ SR's.
Time to set up an investment trust following your QVM idea?
Thanks for this Alex,
I am currently trying an experiment running a dummy NAPS portfolio across the 4 Regions I subscribe to - UK, US, Europe and Developed Asia.
I have simply screened for the top stock ranked shares across all 4 regions and selected the 2 best ranked shares, from each sector, regardless of region.
Another approach that I might try in future would be to select the top stock ranked share from each region/sector but that might make things a little unwieldy with about 40 stocks.
I am trying to understand if these different approaches offer more diversification via a type of broadly global NAPS portfolio rather than a solely UK based NAPS portfolio.
It's only been running a few weeks and is beating the FTSE all share by 1% or so, but it is very early days.
Richard
Thanks Richard. Do let us know how it goes.
It's great that you're experimenting internationally too. We do need to do more research on this front. Generally speaking, the QVM factors have worked well overseas, particularly in Europe (see below). At the same time, in Europe there are more stocks and we need to ascertain how many stocks you need to own in order to 'track' or 'mimic' the entire 90+ basket - i.e. what is the 'minimal subset', as it were?
We said in the UK, 20-30 stocks could potentially be enough to 'track' the QVM benchmark, but there are typically ~150 LSE with a rank above 90+. In Europe, there are currently ~600. I guess I'm saying I'd like to research whether 20-30 high QVM stocks is enough to capture the performance shown on the chart below.
Either way, you are trying it with 'paper money' first, so you'll be able to see results soon enough. I like your experiment-driven approach!
Thank you Alex, I've found that very educational to start the day on. By coincidence - not planning, we hold 34 stocks, at least 10 of those I should have taken losses on years ago. We only have 4 on your list but when I get my buying boots on again, I'll follow this advice. I'm currently raising cash (Trump/Bitcoin/AI/ leverage etc.) but Angling Direct, Capital, Ramsdens and CLIG will not be sold.