The Setup – three simple rules that captured the 36% drift in H1 2025

If you like to read the RNS news each day, you’ll have seen this happen again and again.
A company trading statement lands in the feed at 7am. The announcement says the company is trading “ahead of expectations”.
On the open, the shares gap up 5% or more, and then they keep climbing. Sometimes the shares end the day 10% or 20% higher.
You can’t bring yourself to buy, so you look away and search for other bargains.
But when you look back on the shares a few weeks later, they are up another 30% or more. You knew it, and you kick yourself.
Could this be avoided?
Yes. If you are wondering how you could be more decisive in future, this is the article for you.
There are three simple decision rules to ask yourself in this situation, which year to date have already returned over 36%, in 12 setups with only one loser.
Why simple rules matter
Our mission at Stockopedia is to make investment decision-making easier. That means stripping out the noise and reducing guesswork, by discovering what really works.
The reason we spend so much time digging through the data is simple: we’re looking for evidence-based rules of thumb that make it easier to act with confidence.
Benjamin Graham said it best in “The Intelligent Investor”:

“People don’t need extraordinary insight or intelligence. What they need is the character to adopt simple rules and stick to them.”
Plenty of evidence backs this idea up.
In a 2000 study titled Clinical vs Mechanical Prediction, psychologist William Grove reviewed over 130 studies that compared expert judgement against mechanical, rules-based predictions.
Only 6% of the time did the experts do better. Whether it was forecasting heart attacks, criminal reoffending rates or startup success - simple rules won out.
In investing, it’s just the same - simple checklists can seriously improve our decision making. They really do give us an edge.
The 3-rule setup that’s worked all year
If you’ve been following the research studies we published earlier this year, you will already know the principles - but here’s the setup that’s been working best:
- The company says it’s trading “ahead of expectations”
- The share price jumps 10% or more on the day
- The StockRank is above 75
That’s it. A catalyst, a confirmation and a quality filter.
These rules have triggered twelve times year to date - and if you’d bought at the close on the day of the announcement the results would have been remarkable.
Here’s the full list:
Date |
Name |
Ticker |
Jump |
Gain Since |
StockRank |
Mkt Cap £m |
2025-01-10 |
ANP |
12% |
-2% |
86 |
75 |
|
2025-01-13 |
FTC |
12% |
64% |
76 |
198 |
|
2025-01-15 |
CURY |
11% |
36% |
98 |
929 |
|
2025-01-16 |
CNC |
12% |
25% |
76 |
119 |
|
2025-01-28 |
PGH |
11% |
49% |
85 |
54 |
|
2025-03-25 |
FDP |
13% |
29% |
77 |
367 |
|
2025-04-03 |
CURY |
15% |
21% |
98 |
1,008 |
|
2025-04-08 |
RFX |
15% |
46% |
100 |
66 |
|
2025-04-16 |
PROC |
11% |
7% |
80 |
33 |
|
2025-04-24 |
SFR |
23% |
59% |
82 |
59 |
|
2025-05-06 |
FTC |
10% |
57% |
82 |
209 |
|
2025-05-22 |
WRKS |
22% |
36% |
96 |
19 |
|
Average |
14% |
36% |
86 |
261 |
This year’s hit rate for these rules is remarkably good at 92% winners with a 36% average gain. Yes, there are duplicate signals for Currys and Filtronic, but if the second for each is stripped out the results are the same.
Is this unexpected?
Well, in simple terms, no.
Earlier in the year I studied the market reaction to ten years of trading statement announcements. Stocks that met the above three rules have gone on to deliver average 6-month returns of nearly 15%, with win rates around 67%.
So yes, H1 2025 has been much stronger than usual. It’s been a good market. But it’s not out of the blue.
“Ahead” points the way at the start of new trends
We’ve long championed the power of Momentum here at Stockopedia, but I know many investors worry about joining a trend after the price has already moved.
Well this setup is the antidote to that fear.
These trading statement reactions aren’t the end of the move. They’re often the beginning.
Whether it’s Filtronic’s 48% surge on the SpaceX contract in April 2024 or the Works.co.uk jumping 22% in a day two weeks ago - these moments can be the catalysts that reset expectations and kickstart new price trends.
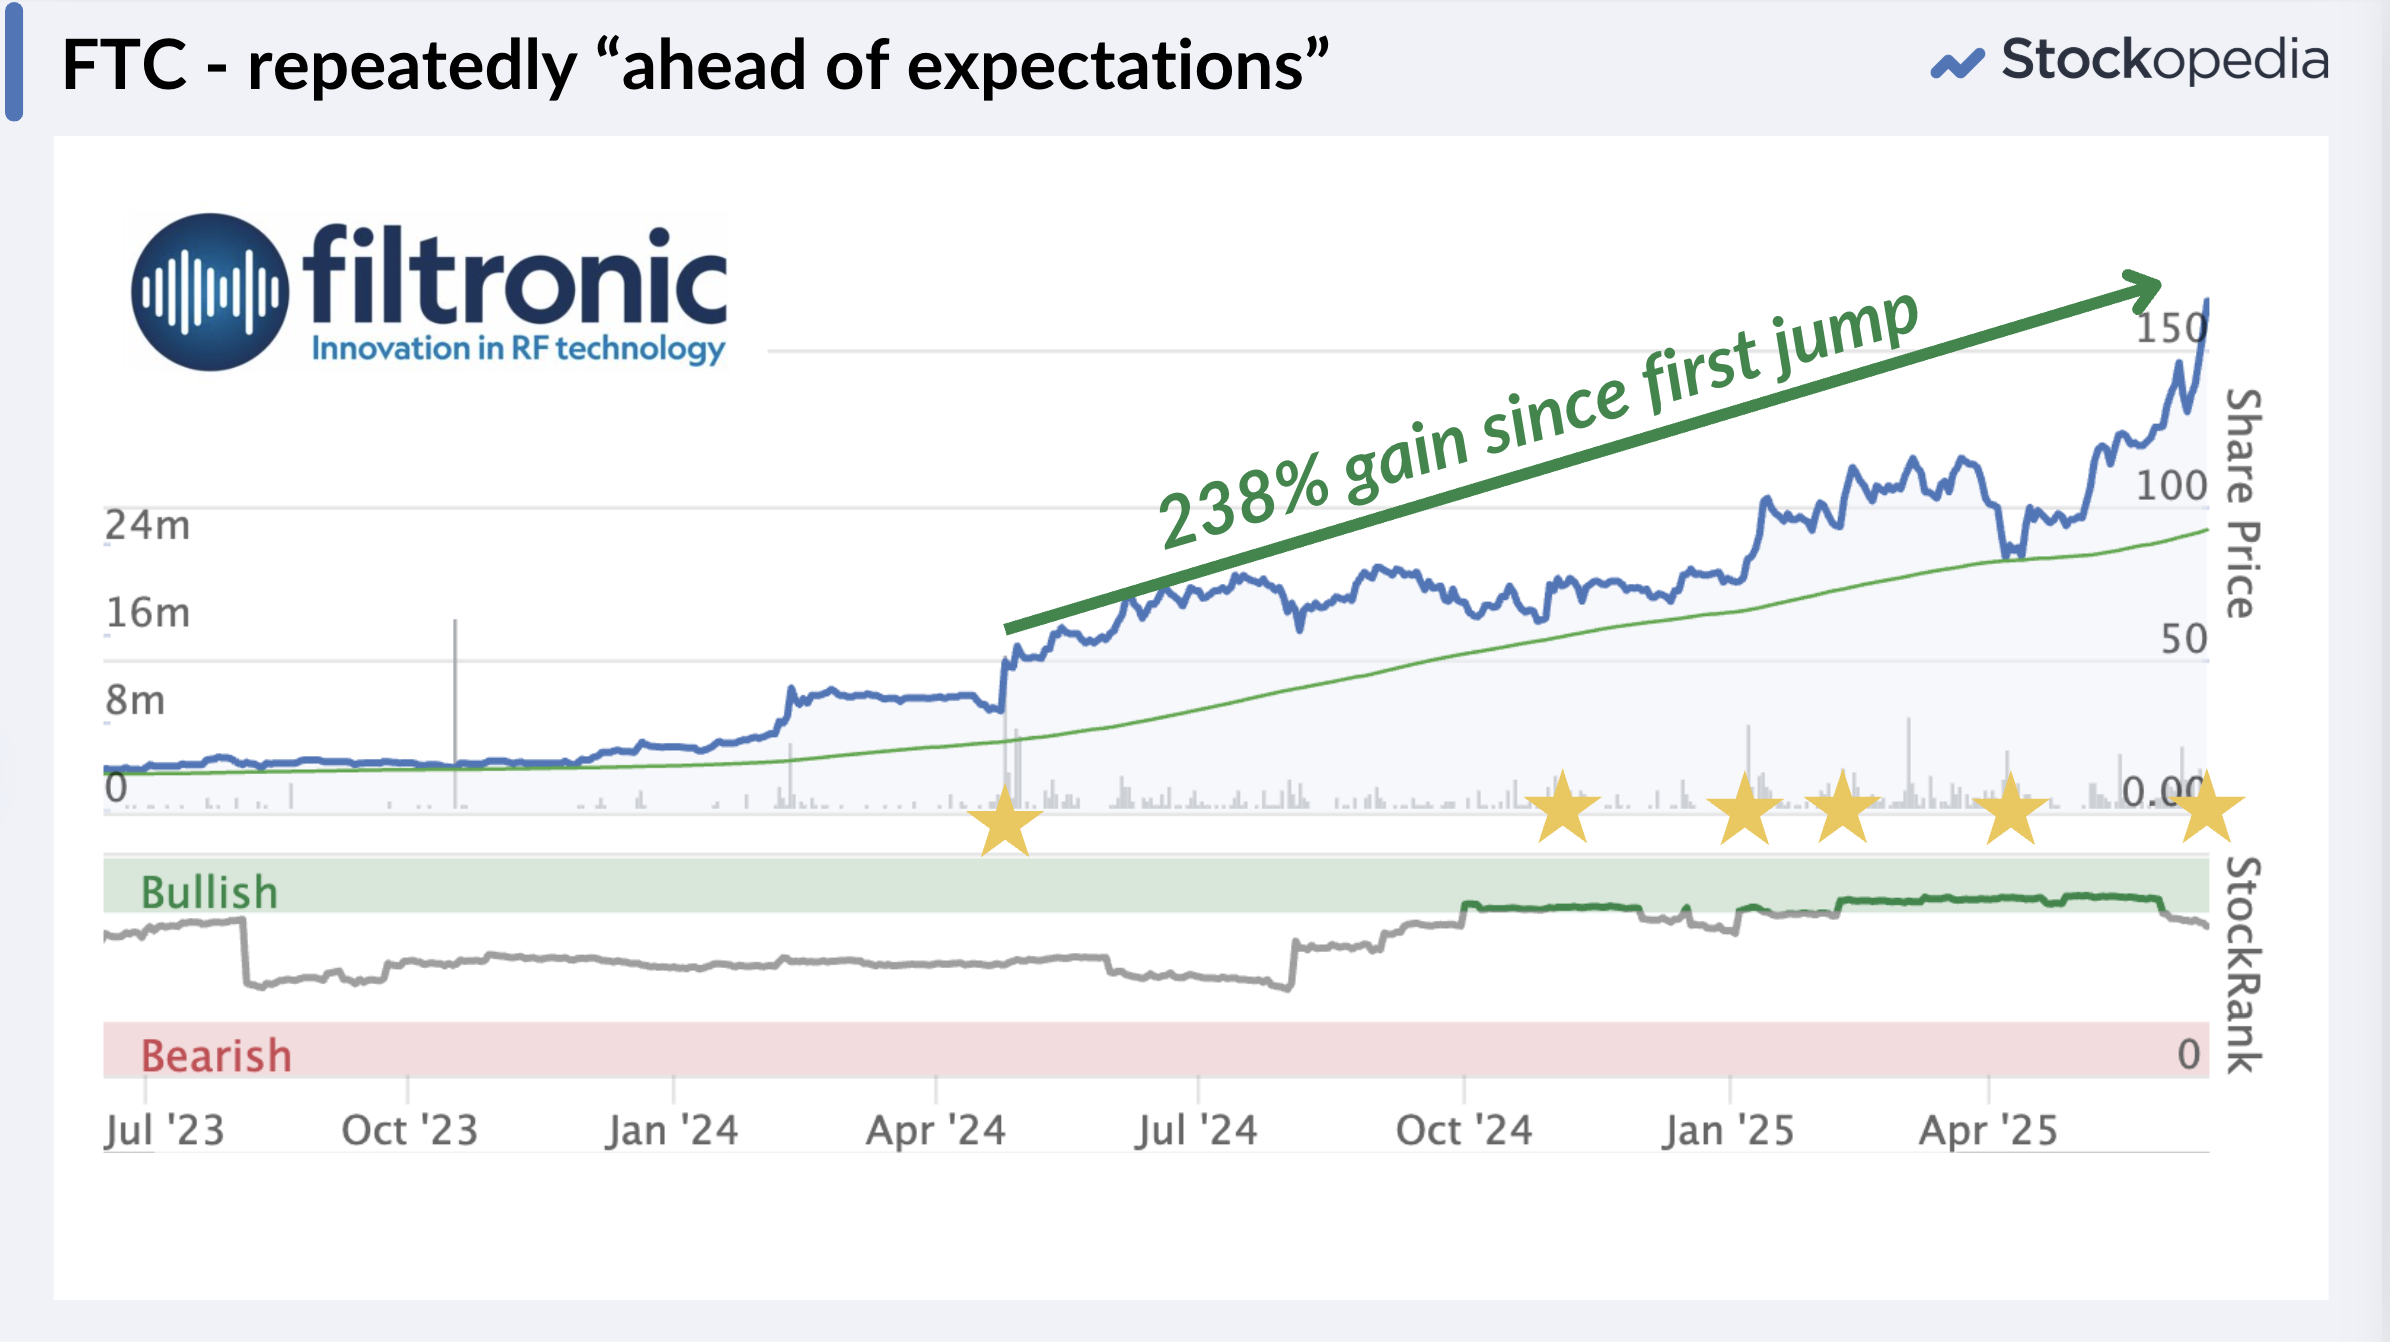
So if you care about timing your entries well, and if you want to avoid the opportunity cost of sideways motion, then pay attention to big share price reactions to positive trading statements. And if you want to improve your win rate even further - limit your decision making to higher StockRank stocks.
Sometimes, simple rules really do just… work.
For further reading
If you are interested to learn more about the theory and power behind this setup, I strongly encourage you to read these three short pieces. They lay out the evidence behind this pattern, and why it keeps working.
Disclaimer
This is not financial advice. Our content is intended to be used and must be used for information and education purposes only. Please read our disclaimer and terms and conditions to understand our obligations.

178 comments
Dycom Industries (NYQ:DY) jumped up 13% have beaten earnings expectations by 13% despite missing revenue expectations by 4.7%
I've held since Sept '25
** Shares of software company Pegasystems (NSQ:PEGA) jump 12.4% to $64.10 premarket
** Posts Q3 adj. EPS of 30 cents, compared with analysts' average estimate of 20 cents - data compiled by LSEG
** Q3 revenue of $381.4 mln also beats estimate of $345.2 mln
I've held since the end of July '25
Friedrich Vorwerk Se (ETR:VH2) jumps 16% as the firm's Q3 results came ahead of expectations and it raised its FY2025 guidance for the second time
The pipeline manufacturer now expects an EBITDA margin between 20-22%, up from 17.5-18.5%
https://www.stockopedia.com/sh...
I've been a holder since June '25
Capital (LON:CAPD) today closed +11.6%, stockrank 97, after a trading statement that included: "For the second time this year, we are increasing 2025 revenue guidance". I guess that qualifies.
Yes there is a Capital (LON:CAPD) broker EPS upgrade of +12% for 2025 so they qualify as a "Jumper". The MSALABS division in particular expects sales to rise by 60% this year. Precious metal testing is an important aspect of MSALABS services, and with high gold and silver prices, drilling activities and sample testing are projected to increase substantially. Additionally, shares that CAPD hold in 3 junior gold mining companies are rising, positioning the company advantageously.
MTO and G4M could be contenders today and might be worth taking a look at.
Agree. MITIE (LON:MTO) closed +14% with "FY26 operating profit guidance upgraded to at least £260m" and SR 88.
Gear4music (HOLDINGS) (LON:G4M) only managed +8.51% with "Full-year outlook ahead of exps" and SR 88. So may be not, depending how strict you are with the rules.
Gear4music (HOLDINGS) (LON:G4M) already qualified on it's previous update.
Morgan Sindall tested the unfilled gap in early September. We now have a new unfilled gap, so maybe better to wait for a test of this unfilled gap.
Look at Made Tech (MTEC). Beat expectations 26th June, up 18% on the day, now maybe reacting positively to the unfilled gap. Gaps are supposed to fill so when they dont it should be very positive.
MGNS today if closes +10%?
It qualified back on 17th June with a 14% rise and gapup on the day but pretty much went sideways after
Any thoughts on Goodwin today?
Cant see any comments in Goodwin`s report about its performance versus expectations, Said one of its division (not profits as a whole) will significantly beat last year, but dont know if this was expected or not. The market liked the news as its up 19.7% but its stock rank is only 60.
There are no broker forecasts for Goodwin - hence no "expectations" officially.
It really says everything about the state of the markets and investment research since MIFID II in the UK that a £1bn cap company is not covered !!!
Would KGF count today, upgrading full year guidance, is that the same as ahead of expectations?!
My view is its not the same as above expectations. The words used in the report were: We now expect to deliver FY 25/26 adjusted PBT at the upper end of the previously guided range of approximately £480m to £540m. They did raise the cash flow figures though, and the 14% rise reflected the market liked the news, but to me the order is 1st significantly above, 2nd above, 3rd slightly above, 4th top end of expectations, 5th in line.
If GRFD closes above 10% today then it would meet all the criteria. It definitely meets the stock rank, expectations are slightly above, though I would prefer above or significantly above if possible. Not sure if its better if the results are a trading update rather than final/interim results, as they said at last trading update on 9th July results slightly ahead of expectations, so is this a reiteration of this. But shares only rose 5% that day. Currently my broker says up 10.5% so if that holds for another 35 minutes it will meet the criteria.
Actually re-reading the report, it is above expectations for 25 results. Its just slightly above for 26, so GFRD met all criteria today.
did you buy?
Not yet, I misread the above/slightly above. Will see tomorrow morning.
i dipped in with a small position, testing the theory
Same!
GFRD today?
IBEX (NMQ:IBEX) reported "strongest quarterly growth in 3 years" beating analyst expectations. The share price climbed 36.5% yesterday. Ibex has a stockrank of 97.
I've held since 11th Feb 2025 (disappointingly it was only in my smallest account but mustn't grumble)
Gear4music (HOLDINGS) (LON:G4M) passed the 3 Jump criteria yesterday with a trading update delivering Q1 sales up 27%. This jumped the share price by +14% on a Stockrank of 90. G4M expressed, “confidence to once again increase its expectations” with Progressive lifting EPS by +30% (from a low base) , whilst Singers increased theirs +17%. H1 results are 18th November.
Does James Cropper results today meet the criteria do we think (assuming the increase so far holds)?
If James Cropper closed over 10% today then in my opinion it would fit the criteria. However my main concern is on IG the spread quoted at the moment is 259.8-282.2. Then the stock rank is 75, so its marginally passed. Next it only slightly beat expectations, yet if you look at an earlier article on this subject, companies who significantly beat expectations may do better. So though its passing I`m not convinced enough to risk that spread.
Australia-based specialist power and communications infrastructure and services provider Genusplus (ASX:GNP) has just released FY results beating expectations. It closed up 13.91% has a stock rank of 91 and is making new all time highs.
I've held since the end of July.
Hi All, doing some screening on this, would GLB (Glanbia) be an example? Results on 13th Aug said adjusted EPS ahead of expectations and looks like price was up 13% on the day. Would adjusted EPS count?!
Adjusted EPS counts for me. But the share had a stock rank of 59 on the day of the results, so according to Ed`s 3 criteria, it would not qualify. After the 13% rise the momentum rank shot up from a very low momentum rank of 34 on 13th August, and this is why the stock rank is high now, as momentum is currently 93. But if you were buying on 13th August you would just see stock rank 59
Ah of course i didnt think of that! Thanks for the reply, ive managed to set up an automated alert in Sharepad for 'ahead of expectations' so ill keep a look out for future updates!
Caledonia Mining (LON:CMCL) may have qualified today depending on what rules you are using. SR 92, close to close increase>8% and "ahead" type update "Profitability expected to be materially ahead of market expectations”. One to watch?
Volex (LON:VLX) playing out quite nicely after the big gap and rise last Thursday. Was followed by low volume then buyers stepping back in with significant volume yesterday
wrong thread please delete
Dear Ed, Another fascinating article. At the start of your article you said.
On the open, the shares gap up 5% or more, and then they keep climbing. Sometimes the shares end the day 10% or 20% higher.
The 5% gap did not apply to Personal group (LON:PGH) PROCOOK (LON:PROC) Severfield (LON:SFR) or Works co uk (LON:WRKS) after looking back at the previous nights close and the opening price the next morning.
How much importance do you give to the 5% gap on the open?
TJ - I was really just building the narrative at the start of the article! I've actually not found that the size of the gaps on the day in these situations have as much predictive value as the end of day's change.
I would theorise that some maybe gap and sell down, and perhaps there are those that open moderately and then climb with demand. Perhaps the end of day change is more indicative of truer market confirmation.
Shearwater (LON:SWG) another 'Ahead', SR 81 (why?) up 33% as of 12am
It may pass all three rules but Shearwater market capitalisation 11m (or 15m after 33% rise), made a loss in 6 out of the last 7 years, and bankruptcy risk somewhere between cautious and distress.
That's why I wondered about the SR being so high!
Everplay (LON:EVPL) watch for the finish as up 9.44% already, already in a decent trend and breaking resistance. SR 85 and 'Ahead'
Everplay just taken out intra day high
noticed Begbies Traynor (LON:BEG) rose 10 % today, is it following the 3 rule setup?
My view is no as its not stated it will beat market expectations, it says profits in 2026 in line, revenue at upper end of range of consensus, which is not clearly above. Finally the share is only up 9.46% today, not 10%, so the share has only met 1 of the 3 criteria- the stock rank.
hi guys,
is there away on the site for setting alerts or screens for "ahead of expectations" or similar ?
Some interesting moves today
BnB. Thanks for the Amphenol (NYQ:APH) info. I wasn’t aware of Prysmian SpA (BIT:PRY) but have just looked it up on Google Finance and I see it has a €18B Mrk Cap and a trailing PE of 25x, which I will happily see Volex (LON:VLX) aspire to instead.
My further advice would be to never look at a trailing PE again. They are misleading. They only tell you about the past while markets have eyes only for the future. Consequently, shares are generally priced against their forecast earnings in the form of a fc PE or fc EV/EBITDA, or, more tellingly their forward free cash flow yield. If you look those you’ll see that Volex is already somewhat more expensive then Prysmian, especially when you consider how much more successful the Italian market leader has been in converting profits to cash.
That said, I like all three (including Amphenol. And each represents the cables and connectors subsector in their respective geographical versions of the BnB fund.
BnB - I dont like PE "trailing" either, but that is the way Google Finance expresses their Prysmian PE.
Could'nt it be that Prysmian and more particularly Volex (LON:VLX) are undervalued if you buy into Ed's Jump hypothosis? Volex (LON:VLX) had a Day 1 >10% Jump in April and again last week.
I definitely see potential upside. You only have to look at the Prysmian chart for that. But I think both are fairly valued now and APH is somewhat above fair value - by 20% according to my calculations. Unless you’re just hitching a brief ride as a trader, then it’s not worth overthinking the valuation. All three have strong long-term prospects in a digitalising world.
If you look at the long term picture, Volex (LON:VLX) has been pretty much range bound since 2001! Resistance over all those years, at around 372p, has now been broken with high volumes and a couple of big moves, ingredients of a Monster Stock!
Last few days activity. Worth mentioning that i've attempted to exclude any sucker stocks or those with F-score <=3, or quality or stockrank <=31. Those included: rise on the day>8%, volumes either 5*avol(50) or volume max in a year or max weekly volume in a year or gapup>=0.75*atr(40) or gapup>5% or (chclose>5 and new high 52). I think that covers it!
I'm surprised how quickly this idea has started working since the article. One a week would be nice!
Looks like Morgan Sindall (LON:MGNS) will continue on
Movers today
Volex (LON:VLX) made a >10% (17%) Jump on Thursday and then another +5% gain yesterday. A significant Day 2 increase after such a large Day1 jump is unusual and tends to indicate a continued upward drift over many weeks, as the market assimilates positive news.
I decided to put PEAD theory into practise and to double up Friday mid-morning (Day 2) when Volex (LON:VLX) was up +3%. Will await the outcome with interest!
The volume on Thursday for Volex was the highest since 27th July 2021, which maybe suggests institutions are trying to buy the share. I believe this edge increases if there is also massive volume on the day, preferably highest volume in a year, but maybe top 5 volume in the year is enough.
I have done some homework on Volex (LON:VLX) in comparison to a much larger US competitor in a simalar cable manufacturing sector. The US company is Amphenol (NYQ:APH) whose Stocko 1 Y SP graph is below:
Like Volex, Amphenol (NYQ:APH) had an identical +12% April share price Jump on Ahead of Expectations in April. This was the APH biggest single % gain for a decade. Amphenol (NYQ:APH) have gone on to make a series of new 52 Wk Highs which has driven up their Mrk Cap to $118 Billion.
Of greatest contrast though is the Amphenol (NYQ:APH) PE of 47x vs. Volex (LON:VLX) PE of just 15x! Maybe investors have figured that both companies are in a sweet spot and that the Volex PEx difference is just too great?
I’m sorry but your comparison of Volex with Amphenol is misguided. Amphenol is manufacturer of the highest grade of sensors used in industry, with gross margins 50% higher and both operating margins and returns on operating capital 100% higher! It would be harsh to assert that APH makes uniquely valued added products for AI data centers, while VLX twists dumb wires together to connect the clever parts. But there is a germ of truth in that generalisation. The correct comparison is with Prysmian, the world’s largest cable manufacturer and whose products are considered to be the industry standard to which VLX will aspire. If you carry out a comparison of those two, you will find that the valuations and margins are broadly similar. Volex is at fair value.
Volex (LON:VLX) Just to add support, Nat Rothschild said in the IMC presentation yesterday (well worth a watch) that trading for the first 2 months of this year were ahead of expectations. It's also looks possible their 5 yr plan to achieve $1.2bn turnover could be achieved a year early.
Volex hasnt specifically said in its results update that its results are above expectations, however Roland has implied this. So I now have a dilemma is it above expectations. Stock Rank is 75, price is currently up 17% so looks like it will meet these criteria. Also Volex is very close to its highest volume in a year, presume it will be as the market hasnt closed yet, so in conclusion definitely worth considering.
My personal view is that if I'm going to have a process then it needs defined rules that can be followed (or ignored). Either way you have a basis to develop and measure. As soon as you get into immeasurable things "implied" or estimating graphs, then it all becomes very ambiguous for me and my mood probably plays a too significant part of the decision. But that's just me, I'm sure a lot of others are better at this than me and can be a bit more free flowing.
'Graphs' as measured by linear regression or 'best fit' are not estimated though. It's pure math. Thats the rule. The trend is your friend and trends persist
Absolutely agree, at the end of the day graphs just put certain data into graphical form. I should have said I'm not good at looking at daily price movements to judge linear regression lines.
I'll try and post the big price/volume movers every day as its part of my process but you'll have to cross reference the stockrank
Just to let you know that Made Tech (LON:MTEC) issued an "ahead of" announcement today and is up 14% so far. SR only 71 so may or may not qualify for you depending on your criteria. Found using Copilot AI which seems a promising tool for this (different AIs are good at different things). It might be useful to collectively come up with a definite list of phrases we see in company announcements.
Strangely Make doesn't appear on the "advancers" section of the today home page. I was hoping that might be a simple way to check daily for >x% risers and SR but doesn't look reliable.
It's seventh in the list if you drill-down on the advancers screen, assuming you've highlighted AIM All-share and aren't defaulted to FTSE All-share.
Thanks. School boy error on my part. I knew nothing about the company and haven't really used the daily home section before, so didn't realise it only displayed info on the index selected.
I shall apply this & hopefully it continues
Thanks Ed. Excellent paper. I bought Volex (LON:VLX) on 7 April on an "ahead" trading update - they rose 12.4% on the day and have kept going! Note the SR moved to 75 on the day!
Excellent “Jump” work by Ed, Dog Tail and Paul which combines systematic analysis with the common behaviour bias of avoiding buying too late, after a sudden price Jump.
Stockrank Rule of 75?
It may not be a coincidence that 1 of Ed's 3 Jump Rules is "Buy" @ Stockrank >75 and that Stockrank <75 is a previous Ed "Sell" threshold. See...
Ed ….“Use Sell Thresholds: e.g. Introduce a dynamic “stop loss” - based on a rank (e.g. Sell on StockRank <75)”.
https://www.stockopedia.com/ac...
The proposition here is that selling when a stock’s StockRank falls below 75 exits stocks that are losing their edge for Quality and/or Value and/or Momentum. Systematically selling <75 SR stocks avoids inertia, anchoring and regret aversion.
So it looks as though we have a market beating Jump Stockrank Buy “Rule of 75” which has Sell potential as a bonus! Stockopedia members can access Stockrank scores at will, with no AI required!
Is there a problem with the news feed? l looked Next 15 (LON:NFG) and it says no news that meets my criteria. There must have been some results, director dealings and trading updates etc. in the last 2 years. This is the second stock l've had this with.
Not a criticism but...if investing can really be reduced to three simple rules such as this then AI and automated trading will really take over.
Shares performing above expectations.xlsx I have been tracking shares performing above expectations every evening since late November, though I havent looked at Stock Ranks until Ed`s article this week. I`ve updated the above spreadsheet this morning with the Stock Rank the day prior to the above expectations report (for accuracy). I`ve then worked out the average performance for all above expectations reports (my interpretation on the day) which was 9.9%. I`ve also worked out the average performance for all shares who also rose 10% on the day and this was 10.2% (this is in green). Finally I worked out the average performance of the shares which met all Ed`s criteria ie stock rank 75 and 10% daily rise (this is in blue) and the result was 21.6% which is slightly lower than Ed`s results as the performance in December 2024 was below average, but I have 20 data points so I think its stronger evidence. If anyone wants to work out if 8% rises are better, the data is here, but my suspicion is it would not improve the performance. But its much better to analyse it this way than to look at shares which have a stock rank of 75 today, which is a statistically biased data set, as it excludes many of the shares which have performed poorly since their great trading update. If the stock rank is 75 today its recent price performance is probably above average, which we wouldnt know when we saw the trading update. The price column in the spreadsheet updates to the current price so hopefully this spreadsheet will still show performance in the future as well. By the way I really miss Paul Scott`s spreadsheet which used to accompany the small cap report, as it actually told us whether his recommendations were performing or not. Overall I believe Ed has identified an edge, though obviously we need more than 20 data inputs to confirm this or not
Nice work
Avg return for >8% is 14%, hit rate is 71%. >10% hit rate is 74%
Based on your spreadsheet, a balance occurs between 9% and 10% on the day and between stock rank 73-76, also considering the number of stocks that qualify (range 19 to 24). Returns vary from 18.85% to 20.53% (before returns drop off considerably) so not much in it. But 75 and 10% appear optimal like Ed says balancing the number of stocks you need to own.
Thanks for working this out. It seems to confirm my feeling that stock rank 75 and daily rise of 9-10% are the optimum numbers. I prefer 10% as I`ve always felt if a stock falls 10% in a day it may be worth exiting the shares so rising by double figures in a day may also be significant psychological.
Yes it seems the sweet spot is somewhere with an above 9% on the day rise and a 75 plus stock rank. So basically what Ed said.
These thresholds could be loosened a little if a trailing stop loss was introduced. There are quite a few shares with a stock rank between 50 and 75 that did well, but also quite a few that did badly. A trailing stop loss might eliminate the poor performers.
Ive just come across your post comment -Thanks 'Dont let the tail wag the dog' for sharing your spreadsheet with us! Would you be able to reshare a current (updated) version?
The file should now be updated. Sorry my updated version is another file with personal data, but I`ve copied the results over now. Hopefully its correct- if there`s an error let me know.
Orchard Funding (LON:ORCH) has just hit all 3 criteria, are we all plunging in at 08:00 Monday?
However with only 10% free float, maybe not
Orchard Funding (LON:ORCH. Maybe not but at least consider this. Their RNS of 31st March said “The board has not changed its view that the continued admission of Orchard's shares to trading on AIM may not be in the best long-term interests of the company or its shareholders. We do not have short-term plans to address this issue and will therefore, for current purposes, continue with the AIM admission. In light of our strong first half performance the board has agreed to pay an interim dividend of 1p and an additional special dividend of 1p."
Yes, a very strange statement indeed and what do they class as ‘short-term’, 3 months? 6months? and if one of their options is delisting, then nobody wants to get shafted with no compensation/buy-back option
One director holds around 57% and it listed the AIM, buyer beware.
Debt is far too high as well.
Not yet, it depends on the share price rise, on the day, it could fall back, to under 10%. Some of these fall back after a large rise, see Morgan Sindall (LON:MGNS) comments, below.
I tend to ignore the above expectations statements if the market capitalisation is below 50m so I personally wasnt following Orchard Funding (ORCH).
Like many of us, I'm impressed and interested enough in this article/research by Ed to start looking for potential candidates for investment.
Unsurprisingly, first stop is Morgan Sindall (LON:MGNS, with yesterdays' 15% jump, ahead of expectations announcement, and 98 stock rank.
The problem is, last Octobers' trading update was ahead of expectations, and produced a 21% share price jump that day, with the stock rank over 95. Following that, the stock traded sideways, and 4 months later had lost (and more) all of the gain.
It picked up again after March's trading update, but wouldn't it be great if all stocks behaved precisely as we'd hoped....
Yes - I have to admit I haven't looked into the perfect entry point post the first-day pop.
I'm not saying the close on the first day is the perfect entry point. It's interesting with MGNS as it gapped up so much. Some people look to try and buy on retests of gaps... but some stocks also just trickle away upwards after +ve announcements, and others see their share prices hit as sellers take advantage of increased demand. It's hard to know in advance.
Also some get super over-extended quickly. I've no idea if WRKS is going to maintain it's current rather punchy levels post take-off... you'd imagine traders are suddenly going to dump some stock... or perhaps there's an institution at large... v. hard to tell !
That's an interesting question. There are a number of ways of determining how to treat a gap depending where it is on the trend.
Last Octobers gap can be classed as an exhaustion gap as it occurred at the end of a long trend, sellers getting out on good news.
This weeks gap could be seen as a breakaway gap, a gap after a long period of consolidation or sideways movement, signifying the start of a new trend.
Filtronic (LON:FTC) has had a couple of continuation gaps up since May, neither of which were large so you can safely bet that it will continue the trend
You could argue that Diploma (LON:DPLM) had an ahead statement on interims 20/05 with a massive 18% buyable gapup and 15% rise on the day. Now curved backup to prior resistance. Looks good to continue
Paul Your bending the rules a tad - SR was only 47.
It was 71 on the day (you'd be buying on the day) plus it's 78 now and increasing, so even better!
It was 47 on 20/5/25: https://s3.eu-west-1.amazonaws...
can't see any trading update either.
71 does not qualify, if you care to read the rules.
Stalker is back! Doesnt show on the rns but does on the DSMR (which I thought was odd). Rules can be broken else we'd never get anywhere as a species! 10% either side of the criteria is reasonable imo
It was 47 on the day read the print. Stocko charts are incorrect as shown on Reach (LON:RCH).
Right Ed, I believed everything that you said so now I need a screen for this. How do I go about automating it?
How can we make a Stockopedia screen for this and other similar ones, like earning momentum?
This is a high turnover short term strategy, relying on PEAD. A member of the momentum family. I suggest that these are held for only 4 months, which is enough time to allow for the delayed reaction to play out. This means that the bid offer spread needs to be modest, because there will be a lot of turnover.
No doubt many will disagree because this means selling 'good' companies. But if they are good they should have qualified already on another screen. If they didnt qualify for a reason other than PEAD, then why keep them?
Reducing the trigger to 8% will give enough candidates to ensure that this strategy is not overly concentrated in a few names and also means high bid offer companies can be rejected.
Some are still going up strongly after 4 months, Filtronic (LON:FTC) Is up 38%, in the last month, Frontier Developments (LON:FDEV) is up 58%. Both were bought in January/February. Most stocks in the folio and still going up, so selling after 4 months, this year, would not have been a good strategy. Filtronic (LON:FTC) first trading update to trigger over 10% rise, was 14 months ago.
I get this. Earnings upgrades have their own type of momentum.
Many who benefit from PEAD then continue up because of earnings momentum. I suggest a separate earnings momentum strategy needs to formulated. Some PEAD shares can be moved to the earnings mo. portfolio if they qualify. These strategies would be complementary.
My 10 year study suggested that the optimal holding period was probably 6 months. Longer holding periods were fine and did continue to accrue returns. Most PEAD research suggests 8 months is about optimal.
Of course... if you do get serial surprises (ahead, ahead, ahead) you definitely shouldn't sell.
Nonetheless - these lessons are valuable for long term investors too. Too often we can focus our research on stocks that go nowhere for months (years?) - but focusing your research on shares that are significantly ahead, or ahead, with market action that confirms demand ... it's so helpful. Think Games Workshop in 2016/2017 or Rolls Royce in 2023 - the 3 setup rules help find the long term winners, not just the short term trades.
Hi Edward, you've studied this data for 10 years - that's impressive and adds even more credibility to me. I also like the perspective on hold periods. I do think there are benefits to holding good quality companies for long periods but the returns aren't always fabulous and you do need to rethink your strategy from time to time.
Though I think these are great findings, I have looked at Procook (PROC) and Severfield`s (SFR) Trading Updates on the days concerned and cant see they are clearly ahead of expectations, particularly Severfield. Perhaps its a subjective thing but I didnt see this at the time, nor did the Daily Stock Market Report. I also think XPS Pensions should have been included for its materially above expectations update on 14th February. I`m not sure reducing the daily increase to 8% would have been an improvement as then you may have bought Argentex on 21st January as revenue was above expectations, Stock Rank 77 and price rose 8.4%. But overall I think there may be an edge here, but only if you have all three criteria, as several shares have beaten expectations, risen over 10% but had a stock rank below 75 and disappointed afterwards.
8% you would have picked up Morgan Sindall (LON:MGNS) earlier.
Some of the ones below 75 SR have done well later and there SR has risen, Staffline (LON:STAF) is one. Maybe worth watching those as the SR often gets upgraded after a big rise. But then Reach (LON:RCH) went the other way.
I clicked on the Severfield link in the article and the announcement reads..
The Group expects FY25 underlying profit before tax to be in the range of £18m - £20m, in line with our expectations which were established at the time of the trading update on 3 March.
This does not look like an "ahead" announcement so there is some subjectivity in interpreting the wording.
The way forward would be for the Stockopedia team to collectively determine in the daily report what was an "ahead" announcement and then include it in a new Announcement Portfolio. The performance could clearly be monitored and possibly the best time to sell also established.
I think that this is a interesting article but I am wary that the 3 simple rules could out perform other trading strategies so easily. I suspect that the 3 rules strategy has had a tailwind from the general re-rating of the UK market from a very low base in 2025. It will be interesting to see if it can out perform in other market conditions.
Did you get a reply to the SFR question? I could only read in line with our expectations.
Hi TJW
Not sure if your comment was aimed at myself - but can confirm that no reply was received back to myself. I seems to me clearly that that Severfield was not "ahead" but "inline". Hence my comments that there needs to be some clarity on how these statements are interpreted.
Subsequent discussion on this thread is interesting. Whilst there might be 3 simple rules, there seems to be a number of caveats to their application - timing of the trade etc. I am not even sure if this is an investment or trading strategy.
An interesting thread - but the strategy needs fine tuning in my view.
How do we get a reply from Stockopedia to your question as it appears valid?
Yes - it does look like you are right - Severfield being inline.
As mentioned elsewhere in this thread my "process" for compiling the table comes from a raw "text matching" algorithm - which looks for variations of patterns like "ahead of expectations", "exceeds current market expectations" and so on...
So there can be false positives - when the phrase matched is not precisely about earnings or revenues - which is the case for Severfield.
Admittedly, I should have checked it before publishing... nonetheless if I had and removed the stocks you mentioned, the average return would be higher!
Also - if we included the "false negatives" - where the phrase matching didn't catch one or two shares that really were beats - some of which have been mentioned in this thread, then the average could change.
It's the principle that matters - the three rule setup appears a strong one. It captures the catalytic moment of high odds earnings surprises well - and the post-announcement drift has a high win-rate with good returns on average.
Nice work Ed
It was definitely a miss by me ! It's always best to be honest. I'm not proposing changing the article though... as my 10 year results are based on the same algorithmic matching process... and I can't possibly catch all the false positives! The false positives do seem to be in the minority, so I'm comfortable with the error rate. And as many have flagged, the false negatives do very well too - so it evens out.
Interestingly I tried using OpenAI but I found it did a worse job than phrase matching. I would imagine the AI will improve though.
Thank you
Is there a Stockopedia screen for this?
How can we make a Stockopedia screen for this and other similar ones, like earning momentum?
I did some testing today. Above 8% rise from previous close at first glance appears to be a good benchmark, else you miss a few good 'uns. On the day volume 1.5x avg50 day is prevelant. Also, there doesn't appear to be much correlation with the size of a gap up and rise on the day that contributes to enhanced future gains, which I'm surprised at
Interesting. I agree that an 8% rise is probably enough to scare people away from buying, which is the reason that it rises later on. Obviously we can play with numbers all day long, but i have a feeling that changing to 8% would be an improvement.
At 10% 12 companies were triggered. At 8% how many would have been triggered?
Its only a rough estimate as ive no access to the Stockrank as of 01/01/2025 plus im not looking at the rns 'Ahead of' bit (too much work) purely looking at the gain from close previous day + stockrank>75 as of now. You get 50% more stocks with 8% rather than 10% but returns and hit rate are roughly the same
Thank you.
You can get the historical Stock Rank from the graph on the Stock Report page
Too much work!
Difficult to tell on some, was Reach (LON:RCH) 71 or 79?
If there is a print on that day, you can check that.
With regard to Reach its Stock Rank was 71 on 17/1, it was 80 on 20/1 and 79 on 21/1. The Trading Update was 20/1 when price rose 20.8% but you would not know price had closed above 10% until the end of the day, so I assume you would use Stock Rank 80 or 79 as the respective Stock Rank though its dependent on what time Stockopedia records the Stock Rank. So by my reckoning Reach should be included in these results as well, unless your calculating stock ranks prior to the Trading Update. This needs clarifying as the momentum rank probably rose significantly after a 20% price rise
Ed said it was 71, see earlier post. So did not qualify.
So the historical Stockopedia Rank of 80 on 20/1 would only appear after the market has closed on 20/1. I think I read that Stockopedia updates in the early hours of the morning, so the Stock Rank of 80 for 20/1 would only appear between midnight and 0600 on 21/1. So if you traded on the day of the update the figure would be 71. However for shares which close up 8-12% for the day how would you know they were going to close over 10% or whatever figure you determine you require before 1630. So surely some of the time you would need to trade the day after the update to ensure all the criteria was met.
Yes, it is the rise on the day, so after the close, then you could buy the next day. Some of these do dip, on the next day, due to profit taking.
Ed, on your table the average increase is 29% but you say it is 36%?
In your article back in January, you had various stocks mentioned but these are not included in your results here, such as Reach (LON:RCH) and McBride (LON:MCB).
Apologies - I've fixed that now. It's 36% not 29% (was 29% at time of original draft!)
Regarding Reach and McBride - you are right that both jumped 20% or more on trading statements in January. But neither quite makes the cut for the setup described.
There are lots of marginal cases that don't quite hit the mark of the "3 way setup". They might not quite match all three of the "ahead", 10% jump and 75 StockRank rules.
I like threes.
So it is only "ahead of expectations" that qualify? How about contract wins? Staffline (LON:STAF) had one on 16/5/25, shares were up 19% on the day.
Reach (LON:RCH) Yes it is not clear on the chart, it does have SR 80.
Ed
Great article again! I read with interest your article from earlier in the year, and was keen to put it into action, but appear to have missed out on some of these great companies. I hold 4 out of the 10 companies detailed (from a variety of screens). How can I ensure I don't miss out on the other 6 in the future? What is the best way to screen for this?
Ted
Ted - the simple answer is no you can't screen on it (yet). But there are workarounds for the vigilant daily.
What you can do is this...
1. Read the Daily Stock Market Report - the summary table is amazingly powerful, Graham and team do a superb job every day - I always scan for "ahead" announcements early. That's how I spotted Morgan Sindall (LON:MGNS) this morning before the open.
2. Watch the "Today" page "Most viewed in the community" widget. We have a super smart community, and almost every "ahead" / big jump announcement gets community interest. MGNS was at the top of the list this morning.
3. And of course, you can use the News Feed (filtered for trading statements). Of course many outlook statements do come in Results and/or Contract news stories - but the filters and price action on the right help spot the best stories.
If you start from 12 months ago the results are even better with an average gain of 64%. Food for thought!
Hi Paul. How did you set up that screen. Is it open to high or on daily gains (open-close)?
Googlefinance. Day gain is close price from previous days close, gap is open minus previous close
Surely there have been more than 10 stocks?
Reach (LON:RCH) Synectics (LON:SNX) and McBride (LON:MCB) ?
It's Ed's list not mine if u care to read
Not sure what you are doing, Filtronic (LON:FTC) did not have an update on 6/8/24.
Works co uk (LON:WRKS) had a 13% gain on 29/04 and proceeded to breakout above resistance on the way to more than doubling currently. No news that day tho
An interesting article Ed.
Are there plans to add a filter for “ahead of expectations” to the News feed? Or is there another way for screening for this?
For US stocks, "EPS Surprise Latest" works well but I'm not convinced it works as well for UK stocks
Agreed a text search of "News feeds" or " My Markets - Ahead of Expectations" news page would be really helpful. There is logic in this and I must confess like others I always feel like I missed the boat...
Hey Ed,
I'd be interested to know if EPS Growth Streak, EPS Upgrade Streak and EPS Surprise Latest add any reslience to the selections chosen. I screen for these in my approach.
My hunch is if a company repeatedly grows EPS quarter on quarter, analysts are improving their EPS estimates month on month and the company surprised the market with EPS results last quarter then they are more likely to do it again ... and again ... and again. This works well in the US markets and more recently I am seeing more UK stocks in my screen.
The risk is that when/if they do miss the EPS targets OR the wider market catches a cold ... they get hammered more than your typical stock.
Keep up the good work.
Cheers
Phil
Phil - thanks for all the comments!
I haven't done too much data analysis on this. Obviously, we do rate EPS upgrades as a core factor in our Momentum Rank - and their power has a lot of academic backing.
We have seen some evidence of serial correlation in "ahead" announcements (i.e. one surprise follows another) - my "Drift" article goes into a Yu (LON:YU.) case study on this - which also shows how the EPS upgrade cycle goes hand in hand with it.
One thing that I've noticed is that "materially ahead" announcements can trigger the start of an EPS upgrade cycle in Value stocks. e.g. Works co uk (LON:WRKS) is flying right now out of a solid base and positive announcement, and if the management thesis holds true we may well see broker upgrades.
A question for Edd;
Filtronic (LON:FTC)'s stock rank currently 70 and FD Technologies (LON:FDP)' SR is 51.
The latter also popped higher on a takeover announced in early May, not on an "ahead".
On 3rd June they did announce an 'ahead' of sorts.... "KX continued to execute well in the second half of the year, delivering FY bookings growth at the top end of our guidance range and ahead of consensus expectations, with £18.0 million annual ACV (FY24: £13.5 million), +33 per cent YoY."
I'm unsure if "bookings growth" counts as an 'ahead'. Personally, I would prefer proper profits (not EBITDA) to be ahead, albeit I accept beauty is in the eye of the beholder there. Regardless, the SP barely seems to have moved on the above announcement.
The SR was also below 75 on both the Takeover and 'ahead' announcements, albeit it was +75 until the start of April.
Is there a time or date criteria for your third rule? 'SR above 75 at the start of the year' for example? If it is 'SR above 75 at the time of the statement' then FD Technologies (LON:FDP) should be excluded.
Given the above, the inclusion of FD Technologies (LON:FDP) does seem a bit strange to me.
Jeremy - re FD Technologies (LON:FDP) - the trigger came in this trading statement on 25th March.
Nonetheless - my "process" for compiling the table comes from a raw "text matching" algorithm I've created - which looks for variations of patterns like "ahead of expectations", "exceeds current market expectations" and so on...
Unfortunately there can be false positives. For example - I've seen a match for "our store redecoration program is ahead of expectations" - which is clearly not a solid signal. So it's not perfect and one has to review on a case by case basis.
Edd,
Thanks for getting back to me.
It looks like the FD Technologies (LON:FDP) dropped on the day of that announcement. Assuming the RNS was released at 7am and not post close.
I believe it was up 12.7% on the day versus the previous close.
Doh!
You're right. I was looking at the wrong two days. My mistake. Back to the remedial class for me.
Academic researchers have discovered that retail investors often exhibit a Contrarian bias by selling or top slicing shares after positive news, which hinders their immediate price adjustment and contributes to a steady upward drift in the stock price (PEAD). Conversely they report that institutional investors and more recently advanced AI models align their strategies with market momentum avoiding these biases.
Ed echoes an article published in the New York Times by Will Rogers almost 100 years ago saying; “Buy stocks that go up; if they don’t go up, don’t buy them”.
I think funds are obliged to reduce their holdings of a share if the weighting exceeds limits
Great article Ed and this is similar to the approach that I use but I will only select stocks near 52w highs, I don't need the big jump in share price you describe plus I add in some expectations around balance sheet strength and analysts earnings expectations.
In terms of the UK stocks I currently own Anpario, Filtronic, Concurrent Technology & Ramsdens.
I know that there were some questions about when to exit so here is my approach ...
Pre exit rules notes:
Just a little description about Ichimoku charts before I describe the rules. A really simple way of thinking about Ichimoku charts is that there are several indicator lines as shown in this chart of Ramsdens Holdings (LON:RFX)
You could call the bottom of the cloud (Kumo) a long term moving average, the Kijun Sen (the red line) - a medium term moving average and the TenkanSen (the orange line) - a short term moving average.
When a share like the ones described take off they can go on long runs, often without closing below the KijunSen (the medium term MA).
Exit Rules
1) Any bad news reported by the company I exit, including missing an earnings target.
2) Whilst a stock has a Quality Score over 80 and a Momentum Score over 80 I will hold unless the price falls below the Kumo cloud on the Ichimoku chart. This allows me to hold stocks that continue to perform until such a time as they enter consolidation or turn bearish. I can always get back in later if they take off again.
3) If a Quality Score and/or a Momentum Score drops below 80 I move my notional stop loss from the Kumo of the Ichimoku cloud to Kijun Sen on the Ichimoku Cloud. In effect I'm tightening my stop loss and looking to take profits as I'm expecting the price to start to falter. For example if a Momentum Score is falling but the shar price is climbing that implies that anlayst EPS expectations are falling indicating the stock is starting to lose consensus around EPS growth.
4) If a stock has gone a massive tear and I'm overweight, e.g. at one point I was sitting on a +1000% gain on Celestica (NYQ:CLS) and it was showing no signs of weakening running into early 2025. Recognising the risk I decided to use the TenkanSen on the Ichimoku Chart as a take profit level whilst letting the rest continue its run. I'm still invested in Celestica (NYQ:CLS) depsite Trump causing carnage on the markets and I'm currently sat on a 996% gain.
Exceptions to theses rules:
When the wider stock market has a bad day/week, such as Trump talking about tariffs. When this happens I tend to not sell based on price action but rather wait for a few weeks to see the reaction. Usually the wider market starts to recover and most of my stocks too. I then sell any that aren't recovering back above the Kumo cloud and resuming their uptrend.
Just another note about stop lossess. I don't use them at the broker but rather in the Google spreadsheet I use to track my portfolio I hold a stop loss value for each position. With Google sheets you can import prices for stocks and then you can use conditional formatting to highlight whatever rules you like in relation to the stop loss. I tend to check and update my spreadsheet every couple of days and adjust Quality and Metric scores, EPS estimates and update the stop loss price from the Ichimoku chart. I could probably do this weekly and it would still be good.
If you look at the Ichimoku Chart for Filtronic (LON:FTC) if you'd entered after the Dec '25 trading update (I didn't get in here) the price would have stayed above the cloud except for when Trump shocked the markets with tariffs in April. The stock reactly quickly to this shock moving back towards the Kumo and charging back through it in early May after the trading update. Notice (with the tariff shock aside) how the price can spend long periods above the KijunSen (the red line we called the medium term MA). When a stock like this goes on a run the price can stay above this line for a long time.
This approach has been really good for me. It's good to see some UK stocks performing well using this approach both in terms of diversity of markets and for Junior ISA's. I also use this approach of the US and European markets. Since a 2013 switch to Stockopedia I'm running close to an annualised return of 14%.
I hope that helps
Cheers
Phil
By the way I don't tend to read the RNS's every day, rather when I am ready to buy some stocks I rely on a screen that looks for increasing EPS estimates, quality and momentum ranks, EPS upgrade streaks, etc.
Isn’t it essential to read Company updates?. If we don’t we’ll be unaware when shares we hold issue profits warnings. A profits warning is usually followed by share price falls that often become deep and long term if that first profits warning is followed by another and further share price falls. As Ed’s article today shows clearly, the exact opposite often occurs when a Company issues a better than expected update.
Also (unless you can provide it to show this is wrong) there is no evidence to back up your suggestion that in a big market fall Companies who have a record of better than expected updates see their share prices get hit more than “your typical stock.”
e.g have a look at the long term charts for Next (LON:NXT) and Games Workshop (LON:GAW) with a long record of better than expected updates.
I rarely read company updates.
I pay no attention to the views or commentary on companies. My learning is that if I buy based on the opinion of others, then when the stock hits a crisis I'm waiting on the 'expert' to offer their view. In psychology it's called an external locus and the goal is to internalise the locus of evaluation! In general if we can't do that then pay someone else to do what you are trying to achieve. For example, I wouldn't try to remove my own appendix.
This approach means I don't need to know anything about or fool myself into thinking that I know anything about:
I buy based on my screen rules (Stockopedia metrics, EPS estimate trends, EPS historical performance, balance sheet strength) and exit based on bad news (which is typically reflected in price movement) or just generalt price action (share enters consolidation or starts to turn bearish). Also because I'm not wedded to a stock with upfront research and wisdom of others my ego finds it easier to let go of a stock that hasn't worked out.
I'm also prepared to buy what others might consider eye wateringly expensive stocks.
For example, here's a current Value view of my SIPP ...
Best of luck
Phil
Also I'm tracking changes in EPS estimates from Brokers for all of my investments (this is available in the portfolio views of Stockopedia) so I will see a drop in the share price OR a drop in consensus EPS estimates.
I prefer the quantitative data rather then spin of the CEO (the chief salesman) and I'm typically guided by the price action. The market often disagrees with what one some investors might consider to be too expensive .
Momentum crashes ...
"Despite their strong positive average returns across numerous asset classes, momentum strategies can experience infrequent and persistent strings of negative returns. These momentum crashes are partly forecastable. They occur in panic states, following market declines and when market volatility is high, and are contemporaneous with market rebounds. The low ex ante expected returns in panic states are consistent with a conditionally high premium attached to the option like payoffs of past losers"
https://www.sciencedirect.com/...
Isn’t it essential to read Company updates?
that is surely a given surely that they should be read !!- either way its specifically mentioned in rule number 1
1) Any bad news reported by the company I exit, including missing an earnings target.
If I happen to spot a bad news release from a company (I'm not scanning reports every day) I will exit, but the price action is more likely to take me out.
It's like my entry ... I dont enter a share because it's close to it's 52 week high. I enter because the company has high quality allied with very good growth qualities that it keeps hitting and analysts are recognising that which in turn drives the share price to new highs.
In the same way on exit I might miss the 'news' but it is reflected in the share price and when I circle back to evaluate a drop in price I might notice that I have missed some bad or neutral news.
In my experience you dont have to watch your investments like a hawk every day to get good results.
Hi PhilH.
Many momentum strategies skip one month after a share qualifies. What i mean is that they delay investing for one month after the signal is triggered.
The reason is that people are reluctant to buy at a high point and will wait for a little sideway action or even a small fall. Waiting one month coincides with renewed buying pressure.
What is your experience of this after a 52 week high?
Hi Epitychia,
So my style means that I'm not reading RNS's and looking for stocks every day.
I have my investments and when I have some capital to deploy I run my screen and hopefully it presents some options.
As my screen has these sort of parameters ...
I am relying on identifying stocks that have not generated a negative earnings surprise last period (I would prefer a positive value but I'm not sure the UK stock metrics work well for this field. Maybe US stocks are required to report EPS quarterly whereas the UK compnaies aren't).
I'm then looking for consistent EPS upgrades from brokers (I want the EPS forecast charts to be rising) and I want that over time.
So when a company releases an "ahead of expectations" I won't pick it up til later down the track when the figures come through AND the share price is close to 52w highs (which means that I'm validating that the "ahead of expectations" has has some meaningful impact on the share price over a period)
My screen looks for stocks where the price is within 10% of the 52w high and my final manual checks are to ensure that the stock is breaking out confimed by the Ichimoku chart.
Here for Filtronic (LON:FTC) the price action is above the cloud, the TenkanSen (red line) is above the KijunSen (brown line) and the Chikou (lagging grey line) is clear of the price action. If I see this after screening I'm buying.
So I guess what I'm saying is the good news from the company does inform my investing but it filters down in the data that I use to screen:
- EPS estimate upgrades
- EPS Suprises
- # of consecutive quaters of EPS upgrades
- price action (a validation that the market likes the news)
So you could say I'm late to the party but I feel that I have a stronger sense that it's a party that's gonna last.
Thank you.
Getting is one thing, getting out on time is another. As a natural holder I am worried that I will see these sort of stocks progressing downward after the 'bounce' period. Are you suggesting these are a medium term hold, or do the stats support longer term positions?
Going back to the end of last year I think that Synectics bounced about 9 to 10 % on the 9th December to 345 on the back of ahead of expectations. The Stock rank was circa 90 at the time.
Today, the share price is 317 at time of writing.
It would be interesting to know why the bounce does not hold in all cases and what conclusions can be drawn.
Another banger.
Well done Ed another great article and insight. It makes me wonder if your insight can change the investment environment. Given demand forces prices up the logical extension is investors who follow your wise words will buy strongly into "ahead of expectation" news. So we would expect sharper increases in share prices on the announcement day and maybe less follow through in the coming days? Assuming high stock ranks of course. Perhaps the Market Makers will have something to say about that!
"It makes me wonder if your insight can change the investment environment."
Well - it did cross my mind whether to share some of these insights. The thing is, I've been sharing these insights all year, but they often still go ignored or perhaps more likely forgotten a week or two after publishing.
More than this, the phenomenon of PEAD (post earnings announcement drift) has been known for 50 years - this is a great summary of all the research on the topic. It's one of the most lasting anomalies in finance - but still it persists. No matter how much everyone has written about it, and hedge funds have scalped it, the phenomenon continues.
An excellent article, and based on all this data I should of course be buying Morgan Sindall this morning. However, as a value investor I'd really struggle to buy something that's already risen a lot over the last year and trading well above its typical valuation range (I think PE has typically been between 8-12 which seems about right for a low margin, cyclical business, but currently trading on a 13 multiple). I guess sometimes you need to fight against this value instinct.
Thanks Ed for the reminder of some of your research. As others i have balked at buying a 15%+ rise but now action and check them regularly.
I had MGNS on my short list with a note to buy on the breakout , there have been a few similar situations with big jumps on a B/O but now i do action even if it has not previously announced a big beat. With such a depressed market i believe there will be many quality companies , one's wearing a decent swimming costume, ready to burst out on good news.
It will be interesting to see how this one behaves.
this cunning plan certainly passes the common sense test for sure - its amazing how many companies seem to have consistent trend of downgrading earnings and a few seem to also be in the zone ref upgrades consitently.
I quite like turnarounds where the trend is a turning - but good news on top of good news previously is still good news. Works seems perfect example of share that had been so trashed previously bounceback should firmly have been decent probability if the news was such that the business looks solidly viable again(as seems to be the case)
Re. Works co uk (LON:WRKS) - I think it looks like quite a classic Jesse Stine setup share. The book "Insider Buy Super Stocks" is a good read for value and momentum turnarounds like this... if you want a summary there's a good section at the end of this long article on the topic.
And right at the point of publishing,
Morgan Sindall (LON:MGNS) announces that it is significantly ahead, pops up 12% at the open, on a stock rank of 97.
I have to reiterate that the above article is education only, and not a buy recommendation, so do your own research!
Great article Ed and as a long term holder pf Morgan Sindall (LON:MGNS) it is very relevant. You refer to buying at the close on the day of the announcement. Is the timing important in generating the recorded returns.
I was about to make the same point. Roland argues that it may be over-priced. A sensible argument on most historic value measures. The counter-argument there is something new that could compound earnings further than history which there probably is with defence expenditure spikes. Maybe a case for setting a strict sell discipline. In saying that, the company has a nice dividend profile which would mitigate against modest capital appreciation. It's a top class company. The challenge of investing. I'd rather buy Ramsdens Holdings (LON:RFX) where the downside is more limited IMO.
Thank you, interesting research. It is reasonable to expect that rules 1 and 3 apply when there is a general market demise and the price does not jump 10% thus missing your rules. Therefore as a sense check, I wonder whether you came to any conclusions whete rule 2 did not apply or the price showed outperformance against the market?
Frontier Developments (LON:FDEV) recent statement did not quote above expectations but you could tell IF the new games sales it would be.