The top 20 clearest trending mid-caps - and some more themes for 2025

Last week’s article about the top 20 clearest trending small caps generated a great deal of discussion. Buying strong momentum stocks is just so hard to do. It goes against our fibre. But what is great about this community is that we all learn from each other. Reading a comment like this perhaps gives others courage.
From a behavioural point of view it’s just so hard to jump in after a strong run, yet every time I’ve summoned up the courage to do so it has seemed to work out.
More than this, I discovered several research papers from you all that have inspired me to push some of my research deeper. I am going to run a webinar in a few weeks, and it’s likely these momentum investigations will feature prominently. So thanks for all the feedback and do look out for the invitation.
Several of you asked if I could create a similar list of smooth trending mid-caps. While small-caps are so often the focus of private investors, as they are so under-researched, mid-caps have been the powerhouse of UK markets for decades. While Brexit put a stall on the FTSE 250 more recently, it’s still returned 5.6% annualised since 1996 with a yield (currently) of 3.4% on top. Mid-caps have lower volatility, and often more consistent returns.
The performance of smooth-trending mid-caps
To analyse the performance of mid-caps, I’m using the same approach as last week. We’ve a growing archive of financial data that goes back to 2013 in the UK, which is proving more and more useful for research. So I’ve interrogated it for the following criteria:
- Market Cap - between £350m and £2,500m - which is our “Mid-Cap” Size Group.
- StockRank at least 75.
- Stocks among the top 20% price risers over previous 12 months.
- Sorted by trend clarity. (using the r-squared as before)
I tested these rules on a range of portfolio sizes since April 2013. You can see the results below.
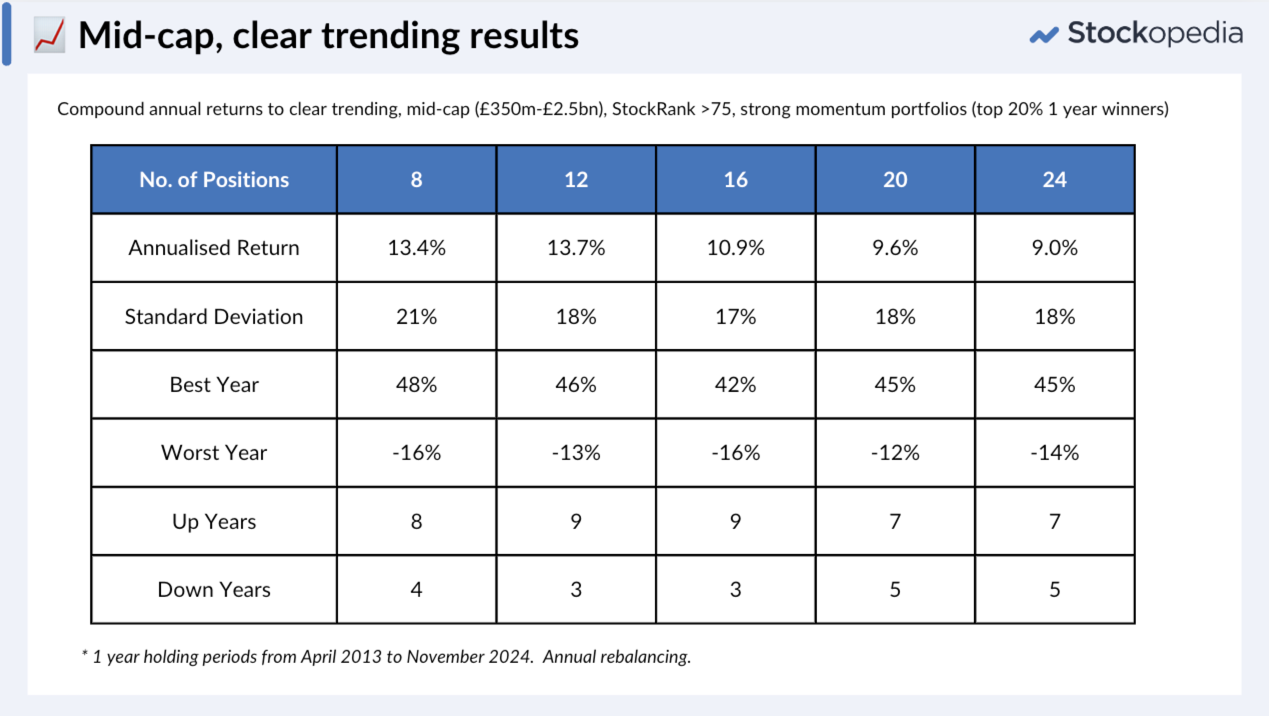
These results are quite startling from a few angles.
- Firstly, the best returns came from the more concentrated portfolios without much additional risk.
- If you compare the risk to the small cap backtests, one has to wonder if chasing small-cap trends is worth it. The standard deviation averages about 18% in this set, while the small-cap list was at least 10% higher. Meanwhile, the worst year was only 16%, versus 34% in small caps.
- The FTSE 250 has only managed a 3.5% annualised return over the same time period, so these approaches dominate the benchmark.
Please note that transaction costs and dividends were not included in this test. But also note that the transaction costs in mid-caps are very low (bid-ask spreads of 0.22%), and the dividends in these stocks are quite reasonable (2.8% average) - so even after all costs and taxes, in an ISA the total returns may be up to 2% higher.
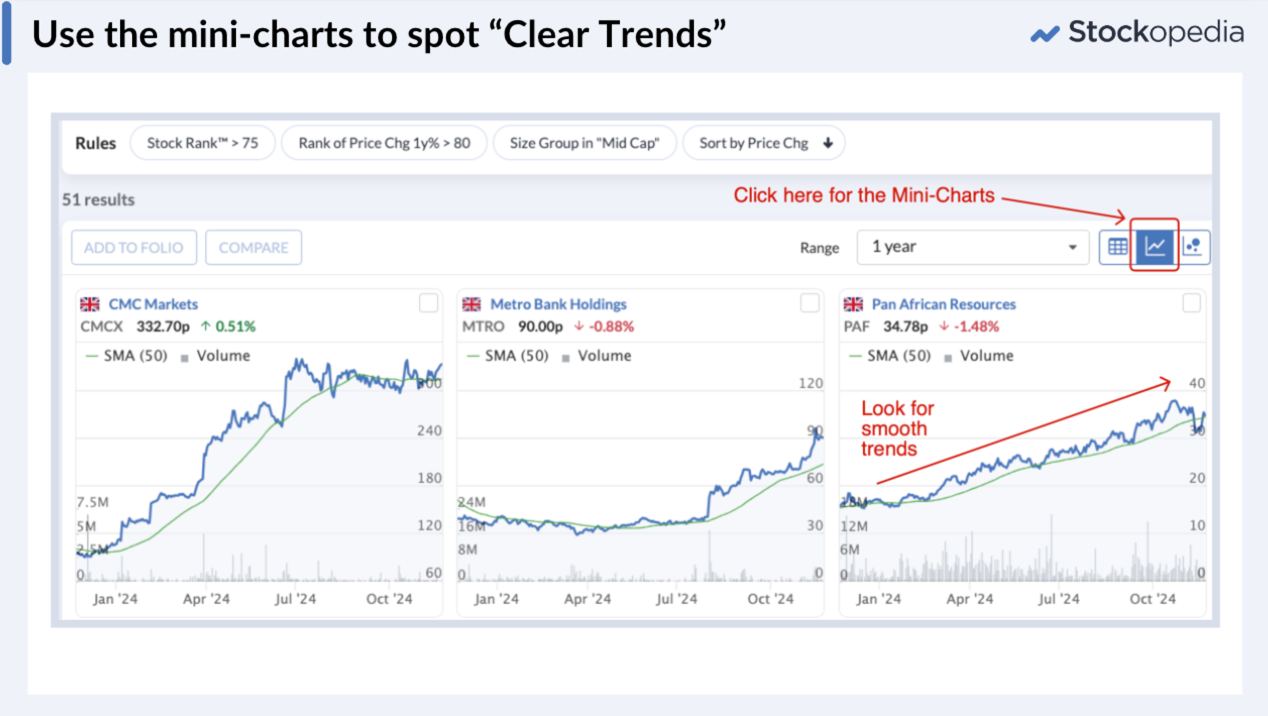
A couple of you asked how to do this in the screener, given we don’t have the trend clarity score available. I suggested a workaround that starts from these rules in the screener and “scans the charts”. The original piece I wrote about trend clarity (“Didn’t buy Warpaint?”) showed that the human eye is really good at spotting clear trends. We do instantly know whether there is a tight fit to a line on a chart. So just click the “mini-chart view” and scan the list for clear trends. Hopefully, we’ll add a trend clarity score in the future.
The current clearest trending mid-caps
Here is the portfolio of twenty stocks that currently qualifies for the above rules.
Name |
Mkt Cap (m GBP) |
Stock Rank™ |
Sector |
Hochschild Mining (LON:HOC) |
1160 |
86 |
Basic Materials |
Pan African Resources (LON:PAF) |
677 |
86 |
Basic Materials |
Bloomsbury Publishing (LON:BMY) |
544 |
91 |
Consumer Cyclicals |
Cairn Homes (LON:CRN) |
1098 |
85 |
Consumer Cyclicals |
Currys (LON:CURY) |
891 |
98 |
Consumer Cyclicals |
Playtech (LON:PTEC) |
2252 |
87 |
Consumer Cyclicals |
Greencore (LON:GNC) |
883 |
97 |
Consumer Defensives |
Warpaint London (LON:W7L) |
405 |
80 |
Consumer Defensives |
Seplat Energy (LON:SEPL) |
1277 |
98 |
Energy |
CMC Markets (LON:CMCX) |
926 |
90 |
Financials |
Just (LON:JUST) |
1442 |
84 |
Financials |
Plus500 (LON:PLUS) |
1863 |
98 |
Financials |
XPS Pensions (LON:XPS) |
748 |
82 |
Financials |
Keller (LON:KLR) |
1100 |
95 |
Industrials |
Galliford Try Holdings (LON:GFRD) |
390 |
97 |
Industrials |
ME International (LON:MEGP) |
827 |
90 |
Industrials |
Morgan Sindall (LON:MGNS) |
1848 |
98 |
Industrials |
PayPoint (LON:PAY) |
609 |
92 |
Industrials |
Cohort (LON:CHRT) |
390 |
77 |
Technology |
FD Technologies (LON:FDP) |
497 |
81 |
Technology |
This is a list of stocks that has risen on average by 85% over the last year. How hard is it to even contemplate buying these shares? Ironically, that's the reason why the momentum effect works. Shares that have risen are often under-bought initially due to price-anchoring, and then over-bought as bandwagon traders pile in.
Once again, there are some clear secular themes pouring out of this list. Here are just three.
- Precious metals on the move - Pan African Resources and Hochschild Mining. For some reason social media focuses on crypto but central banks are quietly hoarding gold like it's going out of fashion. These producers are actually generating cash, they have real assets, and real cash flow. A hedge for economic uncertainty?
- Construction and Infrastructure - as per small caps and once again… Cairn, Keller, Morgan Sindall, Galliford Try. Yes Keller had a wobble last week, and this list includes Cairn - an Irish housebuilder. So this theme isn’t just “Starmer’s Big Build” driven, there are broader forces at play that are backing up the sector trend.
- The rise of trading and investment platforms - there’s always the risk of regulation above the spread-betting and CFD trading platforms, but CMC and PLUS have had great runs this year - with CMC one of Graham’s biggest wins from his New Year Watchlist. Quilter is not a D2C player, but they own one of the biggest investment platforms in Britain and are sucking in assets from advisors. Being off-platform is a risky game these days. The lack of these sort of companies on the small cap list shows that perhaps there’s a scale benefit to these games.
If you dig around you can see several other themes across digital innovation, consumer and financial technology.
Rather than me go on too long, let’s hear your thoughts on the above list.
Which stocks would you avoid from the list above? Where is the market over-extending these trends? What themes will generate the next clear trends?
Disclaimer
This is not financial advice. Our content is intended to be used and must be used for information and education purposes only. Please read our disclaimer and terms and conditions to understand our obligations.

66 comments
One of my favourite factors for picking a stock has always been selecting those that continue to hit new highs. My reason is that there has to be top notch management skills within that coy. My latest over the last 12 months has been B.P. Marsh & Partners (LON:BPM) . It just doesn’t want to lie down. In my book you can’t beat a top management team. The coy.had an excellent write up in yesterday’s Mail on Sunday . Bm is 83 and still playing an active role.
Stocks l would avoid on the list are:
Currys (LON:CURY) low margin retail, will be hit by National insurance changes. Never liked the brand.
Morgan Sindall (LON:MGNS) low margin, shares gone up too much already.
Playtech (LON:PTEC) l don't invest in gambling companies.
CMC Markets (LON:CMCX) and Keller (LON:KLR) have they lost their momentum following recent updates?
A few others l already own, l won't buy at the moment such as Cohort (LON:CHRT) Pan African Resources (LON:PAF) and PayPoint (LON:PAY).
That sums up strict rule based systems. Do you blindly follow them or just use it as a basis for further research. To be clear, I'm only going to run a model portfolio for 6-12 months to see how it goes. Happy to give regular updates if there's any interest.
CMC is interesting. If we'd done this a week ago before this week's drop, it would look much better. One days bad performance can wreck the RSQ score if you run the process soon after the drop. But you have the same issue with most rule based systems, they're just a snapshot at a particular time and you're bound to get some duds over time.It also raises the question about if/when you sell individual holdings. Personally I'd use a stop/loss rather than ride out the loss for a fixed period of time.
I use them as a starting point for more research or l add my own rules about margins, debt and spreads. I also look at the charts, if the price has shot up recently l won't buy, l will wait for a pullback, does not always happen, although even Warpaint London (LON:W7L) did fall back 23% recently.
I have set up Ed's selections as a folio, l can track the progress. Both have suffered big falls in the first few days, one small cap was down 50%.
Currys (LON:CURY) if my memory serves me correctly it was the subject of an unsuccessful takeover offer and I think that played a big factor in its rerating. I have it on my watch list. One thing I have noticed is that it has been doing a lot of tv advertising (trying to increase sales volumes? We shall see)
Really interesting article
Quick Question - how did you select the 8,12, 16 etc positions - was this done in the sort order (i.e. the biggest gains over the past 12 months) or did you use some other criteria?
Ed said in the article above -
So I'm assuming that's how he's selected them and how I've ranked the top 20 in the other reply
Something I haven't seen discussed much on Stockopedia is how different asset classes and sectors perform in different phases of the economic cycle. The reason I mention this is that I wonder if a byproduct of this process is that it naturally selects companies that fit within the cycle. Which is great in my mind. Ed, can you share which years did badly and if possible what was the main drags in the bad years. Any thoughts/comments?
Can you share which years did badly and if possible what was the main drags in the bad years.
I don’t have information about the negative effects of specific sectors on trend clarity performance. I am though aware of a related “Frog in the Pan” Momentum paper which highlights the trend effect working better when investor confidence is high and which amplifies momentum effects.
From Empirical Determinants of Momentum: A Perspective From International Data (2022)….. We confirm out-of-sample that ( Frog in The Pan/Trend Clarity) momentum is stronger in up-markets and less-volatile markets; these market states represent high investor confidence….
https://papers.ssrn.com/sol3/papers.cfm?abstract_id=4012902
Using the FTSE All Share as an indicator of UK investor confidence, I have noticed that my trend clarity returns have been greater while the All Share was on the up (Nov 23 -Jun 24) and have been weaker since the market has been trending sideways. The same weaker outcome was true from Nov 22-Oct 23 when the UK market tracked sidewards.
FTSE All Share Index - 12M
Also worth noting that my Stock Pick/Trended Momentum returns during the stronger All Share "UP" period have been significantly greater than the index gain during that same period, supporting the amplification concept.
Surely 2022 was a bad year until mid October, then there was a bounce.
Yes. But the point is that trended momentum amplifies UP markets, but doesn’t do much in Down markets.
Well the top Stockopedia Momentum stocks, fell around 24% during that period.
Trend Clarity uses regression and R2 calculations and is not the same as the Momentum Rank. Dont expect to make a killing when the market drops!
I agree not quite the same there is quite an overlap.
Well Ed's worst year was -34%, so l don't quite agree that these stocks do nothing in down markets.
You are misunderstand my meaning of “does’nt do much in down markets”. I don’t mean that stocks don’t drop in a Down market but rather that trend clarity doesn’t give you much positive amplification.
OK, l understand what you mean, now.
Sorry ... an obvious point but i assume that you mean your return in excess of the benchmark is stronger when the benchmark is rising.
Yes exactly.
Thanks. That backs up what I'd expect.
I'm also very interested in this method of screening. I've been playing with ideas since the Warpaint article. The "eyeball charts ' method is simple but doesn't sit right with me as I prefer numbers/facts, so I've been working on a spreadsheet that provides an R squared score and then ranks the top 10. Still work in progress, but happy to share (or the results it produces) if anyone is interested. (when I've double checked it).
I do like looking at charts, the mini charts that you can see on your folios, l find very useful. I judge when ti buy and sell. For example l won't be buying TP Icap (LON:TCAP) now, in fact, l have just sold some. I would be buy if it dips down.
I prefer charts with a steady rising line.
But l welcome your R squared score. not something l fully understand.
I agree that charts are useful, I just think there are better ways of trying to score/compare 50 different companies. I've run the spreadsheet using companies selected by Eds criteria but get a different result. I'm not sure why, but the following don't make my top 20 list and my R squared (RSQ) results are fairly poor. RSQ score goes from 1 to -1, where 1 = perfect match to a linear growth line and -1 is no match.
CMCX CMC Markets RSQ = 0.157 Rank 42/50
HOC Hochschild Mining RSQ = 0.399 Rank 34/50
GNC Greencore RSQ = 0.691 Rank 21/50
SEPL Seplat Energy RSQ = 0.288 Rank 38/50
PLUS Plus500 RSQ = 0.401 Rank 33/50
W7L Warpaint London RSQ = 0.260 Rank 39/50
CURY Currys RSQ = 0.443 Rank 31/50
XPS XPS Pensions RSQ = 0.452 Rank 30/50
BMY Bloomsbury Publishing RSQ = 0.291 Rank 37/50
This could well be because I'm doing something wrong rather than Eds wrong! Note I'm calculating the R Squared number using the RSQ function in Google Sheets. I'd expect there to be minor differences in the actual scores using different formula, but there are some big differeneces.
Here's my top 20 UK Mid Caps ranked by RSQ score
I don't think some of those are selected by Ed because there are not among the top risers, Breedon (LON:BREE) is only up 36% in the last year. Cohort (LON:CHRT) is up 114%.
That could be the case. The way I read the rules and ran the filter was to select the top 20% of companies based on 1 year price performance (%) . When I looked at the list of companies in the mid cap category (£350m to £2500m) it was around 250, so the top 20% is the top 50 companies. BREE come in at 40/50. So made my list to then filter on R squared.
I then took that top 50 and ranked them on the R Squared score I calculated.
Not sure what you mean by Cohort (LON:CHRT) is up?
Up 114%, l had to check the figure.
Your rules seem to be correct, so maybe R squared figures are different?
What is R squared figure for Cohort (LON:CHRT) ?
Does CMC Markets (LON:CMCX) still qualify after the last 2days?
Cohort is 0.669 and just missed the top 20 at 22/50
Thanks, l'm surprised it is that low, the chart to me looks better than Just (LON:JUST) one.
To be honest I don't know how R Squared calculations work in a mathematical way. However I find it difficult to really measure the difference in chart form when it's not obvious. Which is why I've tried to put numbers on it rather than judge charts.
CMC isituation s interesting with regards this process (or at least what I'm doing) and something I'm thinking about. My initial thoughts are if might highlight a potential flaw as from what I understand R Squared is based on two points in time and if there's a recent blip it can ruin the score. Whereas if the blip happened earlier and recovered the impact on the score would be far less.
I've done some more thinking about the reasons for the variations between Ed and my selections. I'd assume the sample period was 6 months based on the info in the original Warpaint article, but reading the articles again, it's not really clear to me what Ed uses as the R Squared sample period. The original article said
So I assumed the 6 month price performance timeframe also applied to the Linear regression → R2. I'm now also wondering what Ed actually meant by "Linear regression → R2"!
The way I've calculated my R Squared score is simply comparing (R Squaring) the daily close price with a linear growth between two points. For example two companies ABC and XYZ both grow from 100p to 120 in 6 months. On a daily basis their share prices move in different ways but we end up with the same result. Company ABC is the type of company we're looking for as it grows in a very linear way and increases in price by the same amount each day. This would score an RSQ of 1. Company XYZ stays at 100p and i n one day (It doesn't matter when for the RSQ score)jumps 20% to 120p and then stays at 120p. This would have an RSQ of close to 0. Obviously not the type of company we're looking for as the price rise was probably caused by a one off event.
It could be I'm miles off what Ed's doing and have misread the whole thing.
Maybe he is selecting the top 20% over the last 6 months?
Breedon (LON:BREE) only up 15%.
The lowest share price rise, on Ed's list over a year, is Bloomsbury Publishing (LON:BMY) at 52%.
I don't know, one for Ed, to answer.
I took it as 12 months for both price rises and r squared. But I could be wrong. I think we need Ed to clarify.
Nexxen International (LON:NEXN) was on Ed's list but is delisting soon. Centamin (LON:CEY) was but is being takeover, l think. Replaced by Galliford Try Holdings (LON:GFRD) and Warpaint London (LON:W7L) respectively. Chrysalis Investments (LON:CHRY) probably not allowed as a fund?
Thanks for the offer DR2024. I'd be very interested in a spreadsheet that does that.
It's a Google Sheet. I can either email you a copy or let you have access if you let me know your google account user name.
Thanks. I've set up an account. stehuk97@gmail.com.
Email sent.
Thanks Dave. That all seems fine.
One minor point, that is not really material to the results:
On the summary tab, in the 6 month performance column e.g. cell H2
=(googlefinance(F2)-index(googlefinance(F2,"Price",G2),2,2))/googlefinance(F2)
should really read
=(googlefinance(F2)-index(googlefinance(F2,"Price",G2),2,2))/
index(googlefinance(F2,"Price",G2),2,2)
Thanks, good spot.
I've also found an error on sheet R34 Data which does impact results. Cell A1 should read =Summary!F34 not =Summary!F33. This is why CHRY had an equal score to FAN. Rectifying the error removes CHRY from the Top 20 as it's RSQ score drops to 0.544 (27/50 on todays values).
Thanks a lot Dave. I've replicated your correction on my copy of the spreadsheet.
Dave, I think I've found a small glitch on the spreadsheet.
For RSQ the independent variable should be the date and the dependent variable should be the price.
So the summary sheet should for the RSQ e.g. in cell k2 read =RSQ('R2 Data'!A3:A126,'R2 Data'!B3:B126).
[It makes a significant difference when B3 holds the same value as B126 on the data sheet, as you'll get a divide by zero error for the RSQ as the summary sheet stands.]
Very interesting, thank you. I do suffer from not wanting to buy something that has gone up a lot. Logically, one should want to buy shares that are going up, rather than down but the brain is an annoying organ sometimes.
The one that I most regret getting away is Cohort (LON:CHRT) . I remember looking at ~550-600p and thinking I’d put on the watch list for when it started to consolidate. But it never did!
Now I’m still in the same position, it’s gone up a lot – do I now buy (facepalm)
I’ve been actively trading and investing for nearly 30 years and have the same problem. Now, I know full well that to outperform the average you need to do something different. I learned early that a purely contrarian approach (aka catching falling knives) is a one way ticket to the poor house. I always trade AND invest with momentum, but I assume that most people who learned lesson number 1 are doing the same. Meanwhile, buying steady trends is hard because by definition the stock has already risen significantly relative to its long term volatility, which makes it ‘appear’ expensive. Mug punters are docussed on falling knives. Those in my category (who survived the falling knives phase!) are looking for breakouts, new momentum, recoveries from rounded bottoms etc….but still find that buying something in the top right corner is just SO hard, unless value criteria are screamingly cheap, which is rarely the case with such stocks because the smart money is buying in anticipation of sharply improved trading, or continually improving prospects, thus they never look cheap.
I’ll never forget when I visited a top bank’s FX trading floor in my capacity at work, and meeting with their most successful trader. I asked him how he was so consistently profitable and he told me as if he was imparting a great secret….. ‘well, I watch the market carefully, and wait until there is a very clear trend, then I BUY things that are going UP, and I sell things that are going DOWN’….I honestly thought he was taking the piss, but in the years since I’ve thought many times about that conversation and concluded that he was actually confiding his secret sauce. It’s a successful strategy because so few people can do it. I think it works because the truly ‘smart money’ is accumulating and exerting a steady and sustained buying pressure which limits setbacks and results in a steadily rising price aka ‘trend clarity’. They can foresee that the price is cheap even if it looks expensive to both ‘mug punters’ and ‘momentum wizards’ and that in a year or two it’s likely to be 2-3x the current price. If you really believed this, one would buy every little dip, reinforcing the trend clarity. So trading trend clarity is hard because the buying pressure, and lack of selling pressure, comes from the really smart investors with significant resources, and most investors are trying to either buy stuff that appears dirt cheap, or catch rockets.
I have an even simpler saying is stuck in my memory which is: “Only buy shares that go UP”! Attribution anyone?
To answer my own question. Google could'nt find the answer, but Copilot has.....
...Don't gamble! Take all your savings and buy some good stock and hold it till it goes up, then sell it. If it don't go up, don't buy it. - Attributed to Will Rogers pre 1935.
You could use moving averages, when the share price changes, ie goes about the 130 day MA, then buy, sell if it falls below the 130DMA. This was Stan Weinstein strategy. Rolls-Royce Holdings (LON:RR.) would be a good example.
Very interesting perspective, PastPerformance. Thank you.
Really good article Ed - I am a big fan of this objective systems-based stock-picking. I was still digesting the earlier article on trending small-caps, and was struck by the point around wide spreads and trading costs, so the focus on mid-caps addresses that.
I have followed your NAPS portfolio for the last three years - not a great first couple of years given the overall market, but a lot better this year although performance has become a bit becalmed recently.
Your latest articles on clear trending stocks have caused me to pause for thought. While I appreciate that there is already some overlap between this year's NAPS choices and the "clear trenders", plus momentum plays a big part in the selection of NAPS stocks anyway, I am wondering if I should switch to the mid-cap "clear trenders" in January when its time to rinse and repeat. Will you be able to re-run the clear-trending list at New Year when you do your NAPS report as well?
Derek
Derek - I haven't decided what to do with the NAPS for 2025. It's the 10 year anniversary, and I'd quite like to do something more active, as it will provide more ongoing publishing moments. Ideally still systematic, but with monthly activity.
I use the NAPS style approach for some family portfolios, but am looking to squeeze out a few percent extra per year. So this is one of my motivations for exploring a range of different potential filters to add on, trend clarity being one of the possibilities.
No decision yet.
Re. the NAPS in general - yes it's still recovering from the 2021 high... almost at a new high again. Normally when it breaks out to the upside it goes on a good run. 30% in the last 12 months or so though - which has been rather good!
Ed
How about asking your analysts to run model portfolios as Paul used to many years ago.
Ed, firstly loving this kind of work and find it really useful. I've been building and using the screens and "eye the trend" techniques since the first article.
Specifically, I have just sold all my PayPoint (LON:PAY) ahead of tomorrow's results. It had become my largest position and was up 76%, and personally I think the recent run-up has been in part fuelled by a volume shortage / shift into FTSE250. I have been caught out on McBride (LON:MCB) and Card Factory (LON:CARD) with strong trends up to results, but these were smaller weight and less impact. I still hold Warpaint London (LON:W7L) but again wish I'd cashed it at/around the peak and bought back in at recent lows.
For me, I love the rules-based ideas and trend spotting, but can't help thinking that there's room for some trading mentality here as in truth nothing rises in a straight line. On an equal-weight, theoretical or experimental portfolio I'd let them all run, but these two have become a bit too big for me to stomach simply sitting back - but I will seek to buy back in if & when the opportunity arises.
Lumpedon - there's a phenomenon known as momentum reversals - where high momentum stocks tend to reverse their last 1 month's direction. Many academics tend not to use the last 1 month's data as a result when forming their momentum portfolios. So for the last 12 months, the momentum analysed would be 20th November 2023 -> 20th October 2024 (excluding the last 30 days).
I'm quite keen to explore the stats on how positive buying reversals in clear trending stocks can be. i.e. buy the dips on clear trends. Ultimately that's bread and butter to most swing traders... but I'm angling into this from a fully invested 1-year holding period perspective.
More to come on this.
Excellent - I'm also looking at this on a longer term basis so will be keen to see how your views & data develop. I've successfully managed to stop short-term trading my portfolios (and keep my spreadbet account to do that for "fun") and now tend to open and add over time, following a trendline up. Been exactly that for me on PayPoint (LON:PAY) starting in June 2023, and adding periodically up to August 2024. Tomorrow will determine whether I get back into it, or redeploy capital into some of the others that screen well. Thanks.
Looking at the screen and charts, surprised Metro Bank Holdings (LON:MTRO) does not get selected.
Re. Metro Bank - it's not far away from the list, but the r-squared of the line of best fit isn't high enough to make the list.
Ed, Thanks for this. Would we get better charts if we added a couple more lines to the search - asking for top 20% ranks for 3 months and 6 months price change as well as 1 year. This would smooth out the curve a bit more, and ask for recent strength as well. I also wonder if you could look at Momentum Rank rather than Stock Rank over 75- this maybe more risky but the graphs for Funding Circle (FCH) and Trustpilot (TRST) definitely move from bottom left to top right.
iwright shared a great paper last week about "Overlapping Momentum" which combines the qualifiers of 1 year and 6 month momentum.
I've actually tested the results this week, and found that OMOM outperforms 1y or 6m on their own (in general).
I need to do some more work on this... but yes - it's worth adding both the 1y and 6m rule to a screen rule - it does add value.
I may write about this next week, or talk about it in the webinar.
Nonetheless, our Momentum Rank does incorporate both 1y and 6m lookbacks, so seems well designed from that POV.
Another great article. My impression is that this strategy would work best with a shorter holding period, even as short as 6 months. Certainly the performance of the original clear trend portfolio has tailed off recently.
As you note mid caps can have bid/ ask spreads as low as 0.2%, so transaction costs are not really a major problem.
I can test 6 monthly holding periods. I ought to. Some research suggests 8 months is optimal.
Thank you Ed.
Ed,
Thanks for the hat tip. That was quick work and its encouraging that you have found additional backtest return from using overlapping look back periods.
I have recently starated selecting stocks that pass and overlapp 0-3M and 6-12M adjusted slopes because the 0-3M metric removes stocks with recent weakness. Eyeballing the graph though is my final arbitor!
For interest I hold 9/20 of the above Trend Clarity mid-cap selection and a simalar ratio in the small cap screen and I am very happy with their joint preformance to date. Ian
I own a few of these. I try to avoid/sell when I see large director sales, as I think this is an indication the clear trend may be nearly over.
Hi Ed, interesting article. Until yesterday I held 5 of those in my portfolio but sold 3 of them having had a great run with them. The 3 I sold had not had great momentum(generally flat at best) over the last 3 months and the value score had dropped significantly to low/ mid 20s. Not sure if I’ve actually reinforced the behaviour you are disproving or there are some additional nuances lol. As general feedback I love the quant articles on stocko some keep this gendre going.
Ed, thanks for the mid cap list. Believe Nexxen International (LON:NEXN) is delisting soon.
Rusty - thank you for spotting that. I should have spotted that. I have removed Nexxen and replaced with the next highest qualifier - Galliford Try Holdings (LON:GFRD)