The top 20 clearest trending small caps - with implied themes for 2025

Back in May, a piece titled “Didn’t buy Warpaint? Why clear uptrends are the best uptrends” hit a nerve. If you missed it, here’s the gist: You often don’t buy the stocks you want to because they seem to be in a perpetual uptrend — only to regret it as they keep climbing higher.
This is the power behind “clear trends”. Clear trends are powered by consistent but not excessive buying, with holders who aren’t rushing to sell. They show few significant corrections and on average continue to outperform. The 20 stocks mentioned in the original piece have powered on by an average 8% in less than 6 months, while the 90+ StockRank set is only up 1.6% and the FTSE All Share down 2.8% over the same period (AIM down -9%).
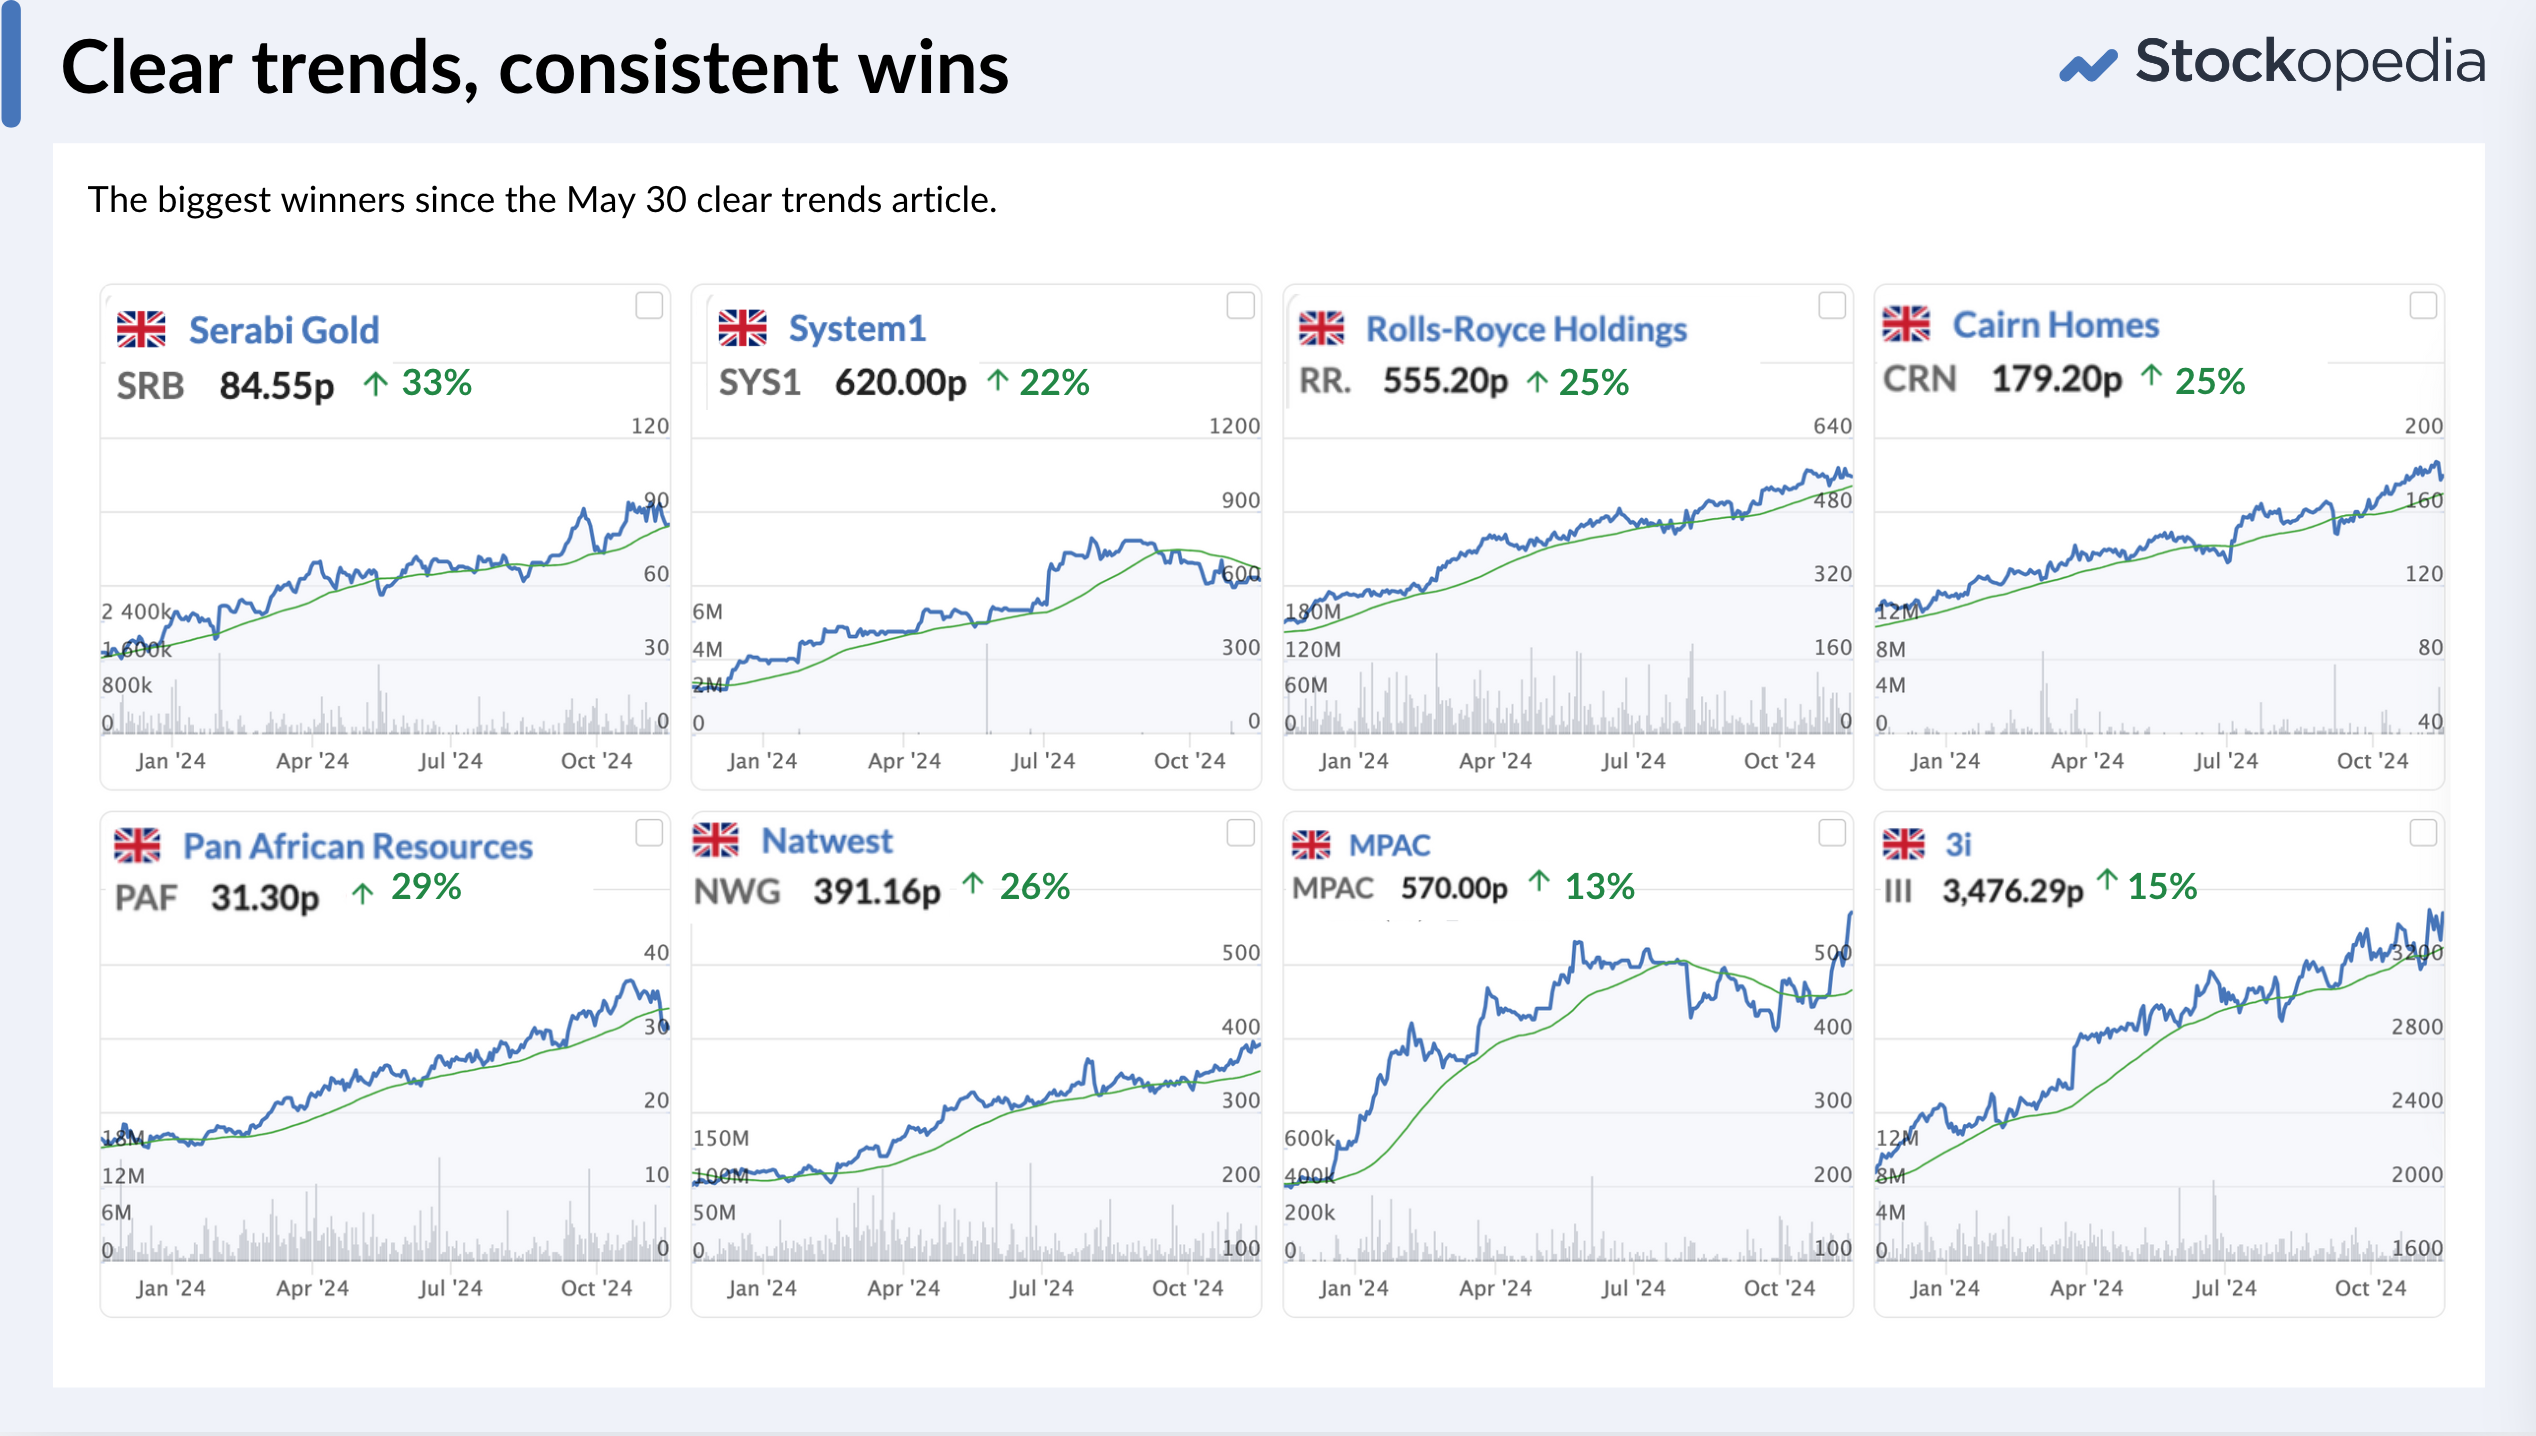
Strength begets strength. Not in all market environments, but much of the time. Here are a few of the top performers from that May list.
Even more powerful in small caps
Since then, I’ve become even more convinced of the power of clear trends. Clear trends not only improve the performance of momentum portfolios, but they especially enhance the returns of small caps.
I recently back tested some simple trend clarity rules on small caps, covering 11.5 years of market data:
- Market Cap between £20m and £350m (i.e. small caps)
- StockRank at least 75.
- Stocks among the top 20% price risers over previous 12 months.
- Sorted by trend clarity. (For maths wonks - this uses the R-squared of a linear regression on the share price over time)
Here are the results for portfolios of different sizes, rebalanced annually since March 2013:
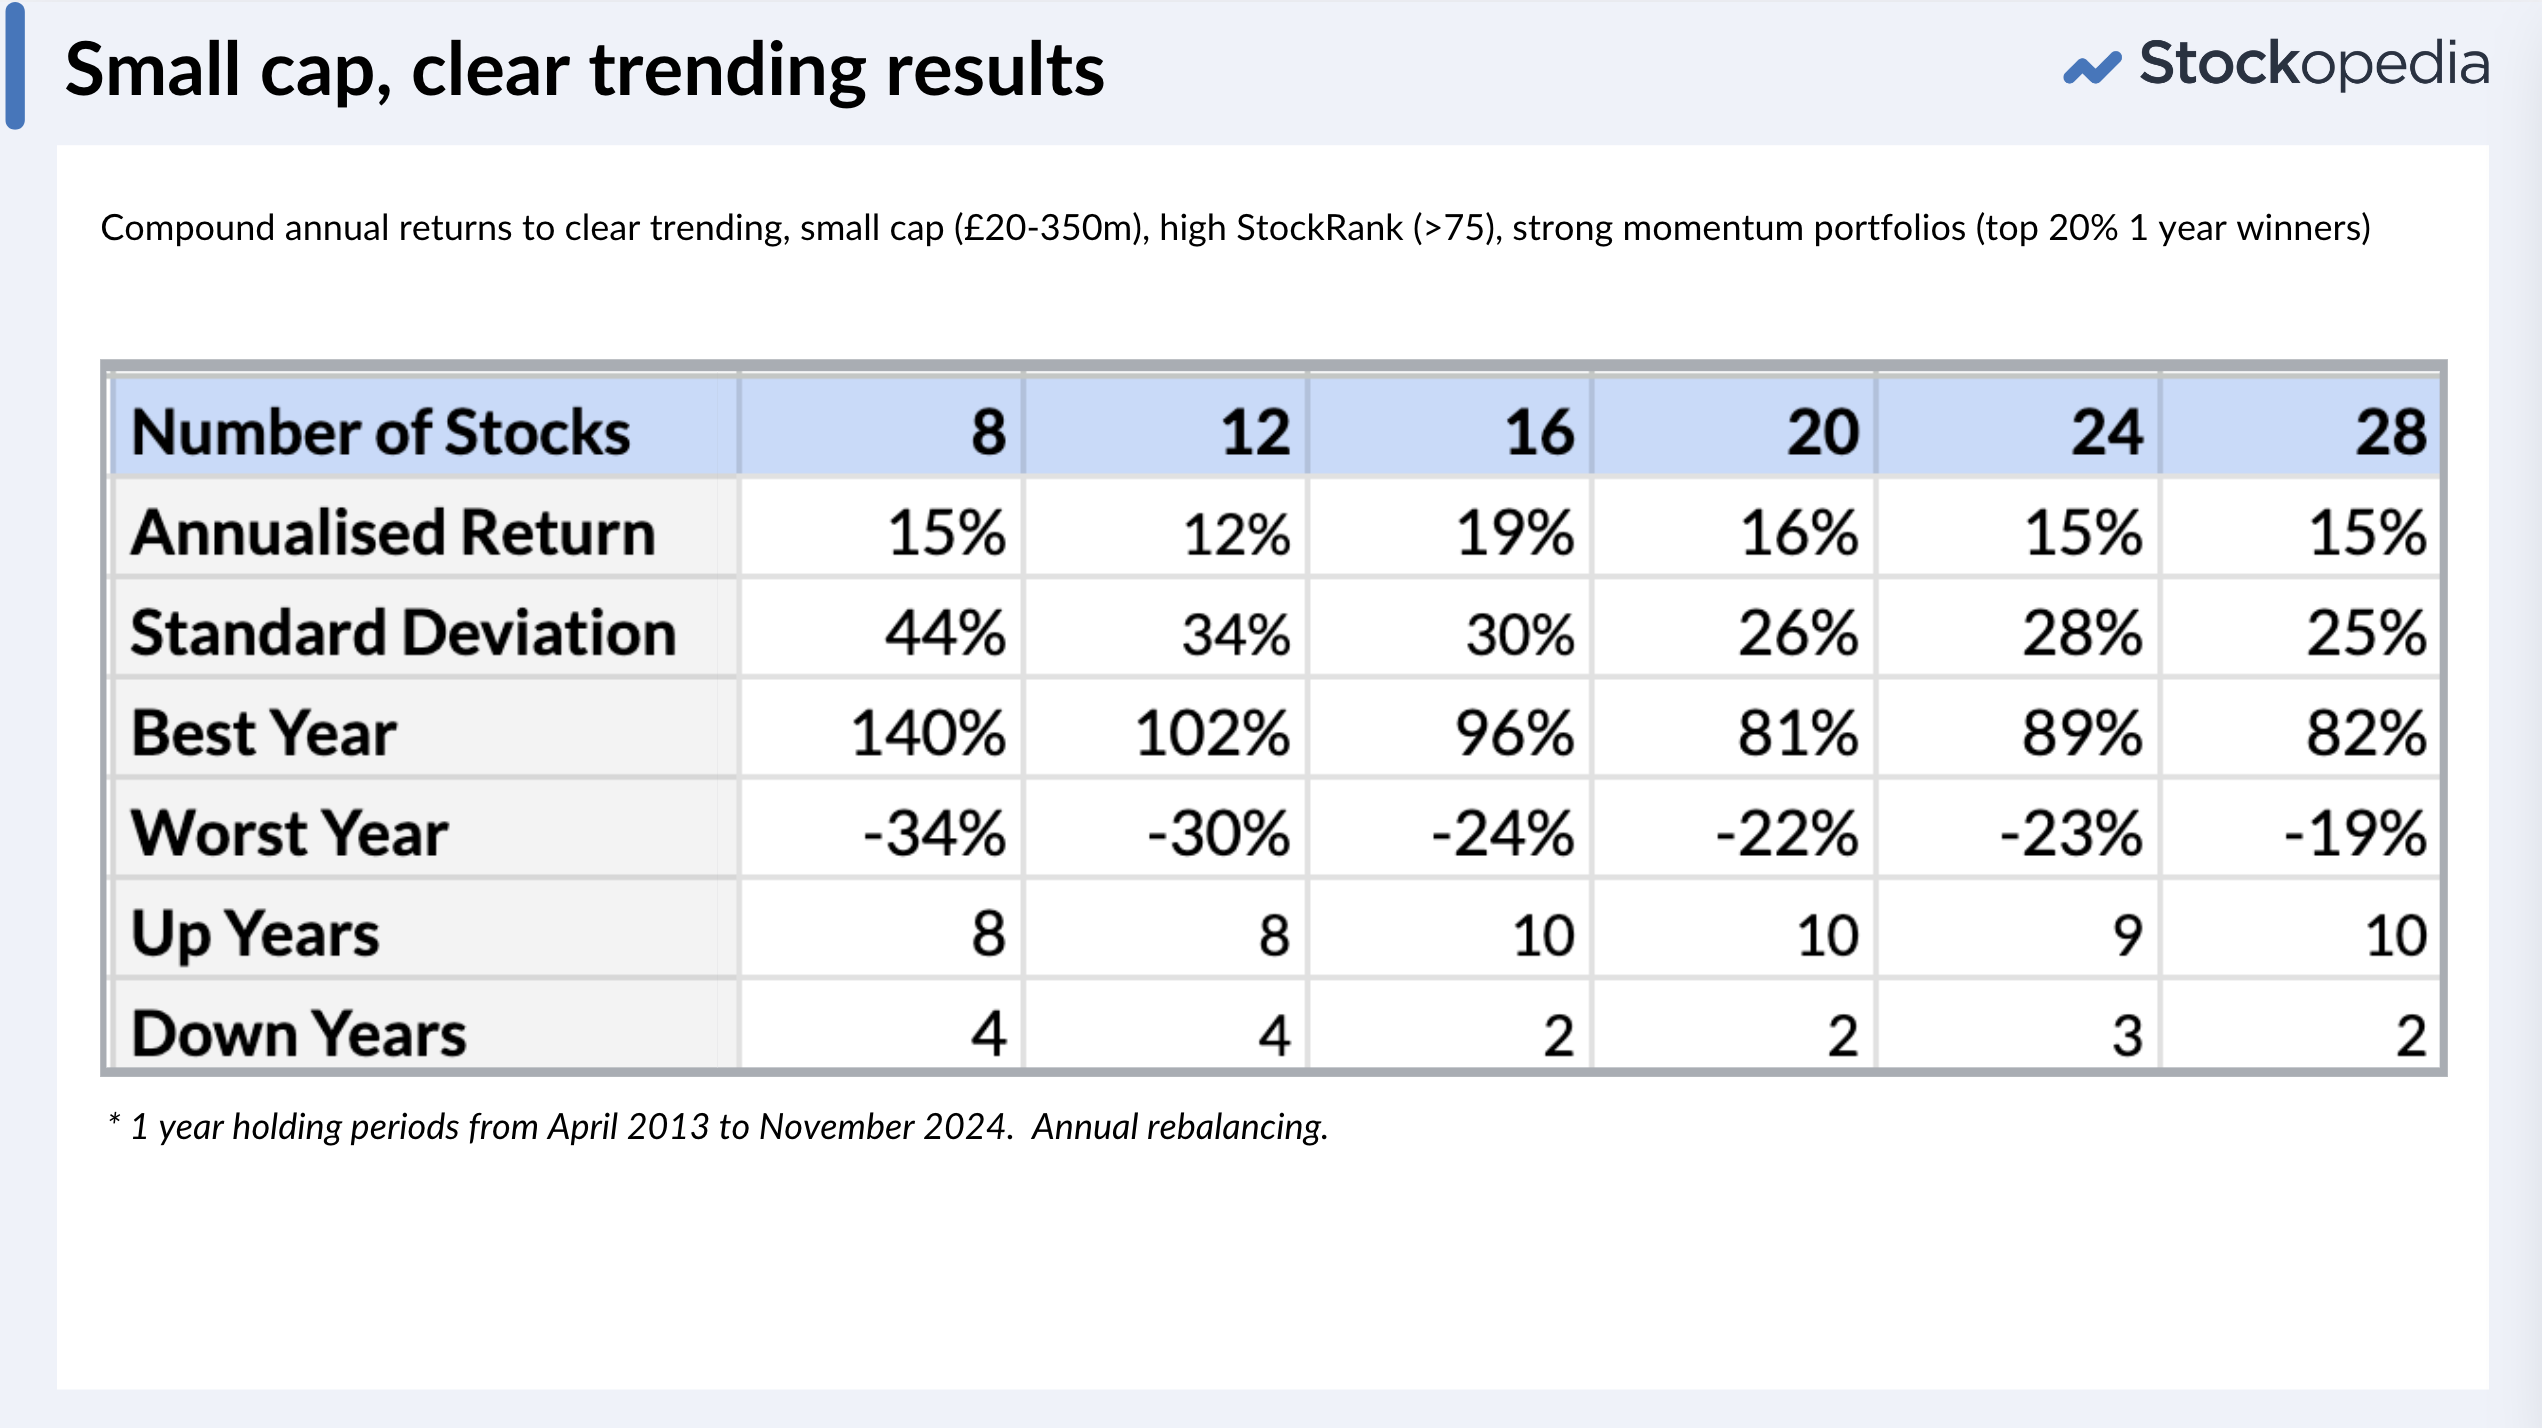
The returns are strong, typically 15%+ annualised over the period, and reaching over 19% for the 16-stock portfolio. Risk and return seem optimal with portfolios of around 16-20 positions, showing 10 up years and just 2 down years. Concentration was not a benefit with this approach.
Admittedly, the bid-ask spreads can bite in small caps and liquidity can be an issue - dealing costs can be high. The current portfolio has an average bid-ask spread of 2.6%, which is only partly offset by a 1.1% dividend yield. After all costs (including 0.5% stamp duty), there would be at least a net 2% drag on performance. Nonetheless, factoring that in a 13-17% compound annual return in an ISA is not to be sniffed at - it could more than quadruple your money over a decade and keep the ravages of inflation well at bay.
And another consideration, from a risk-sanity perspective is that when momentum turns it can turn sharply. The above "worst years" were after 12 month holding periods. The interim drawdowns may have been worse in between. So hard hats are needed.
Trend clarity works even on low ranked shares
What’s most gratifying about trend clarity in momentum shares, is it appears to work even among low StockRank shares. A 20 stock portfolio with the same test parameters as above:
- returned 15.4% annualised for StockRank < 75 stocks
- returned 9.5% annualised for StockRank < 50 stocks.
These are significantly above the average returns of lower StockRank stocks. This may be an indication that smooth uptrends really do tell us something about the future. Smooth trends may be telling us that fundamentals are likely to improve, or perhaps simply that bandwagon traders are about to hop on board. Either way, share price appreciation is often on the way.
What the top 20 clearest trending small caps are telling us now
Given the above rules, the clearest-trending, high ranked small caps are published below. This is a list of stocks that’s risen an average of 125% over the last 12 months. That fact itself is most likely to scare the living daylights out of people. Who would be mad enough to buy shares that have risen so far? Is it mad, or is it rational? With only 2 down years out of 10, this strategy has proven pretty resilient. The strategy always owns the big historic winners…. but holds them for the next stretch.
| Ticker | Mkt Cap (£m) | StockRank™ | Sector |
|---|---|---|---|
| Altyngold (LON:ALTN) | 57 | 98 | Basic Materials |
| Griffin Mining (LON:GFM) | 265 | 92 | Basic Materials |
| Metals Exploration (LON:MTL) | 99 | 99 | Basic Materials |
| Serabi Gold (LON:SRB) | 70 | 99 | Basic Materials |
| Carclo (LON:CAR) | 25 | 85 | Basic Materials |
| Norcros (LON:NXR) | 240 | 98 | Consumer Cyclicals |
| Epwin (LON:EPWN) | 147 | 98 | Consumer Cyclicals |
| System1 (LON:SYS1) | 80 | 85 | Consumer Cyclicals |
| Enwell Energy (LON:ENW) | 101 | 100 | Energy |
| Time Finance (LON:TIME) | 53 | 96 | Financials |
| B.P. Marsh & Partners (LON:BPM) | 264 | 99 | Financials |
Alumasc (LON:ALU) |
110 | 93 | Industrials |
| Marlowe (LON:MRL) | 296 | 86 | Industrials |
| Costain (LON:COST) | 292 | 98 | Industrials |
| Synectics (LON:SNX) | 54 | 93 | Industrials |
| Hercules Site Services (LON:HERC) | 37 | 80 | Industrials |
| Intercede (LON:IGP) | 113 | 88 | Technology |
| Filtronic (LON:FTC) | 160 | 76 | Technology |
| Celebrus Technologies (LON:CLBS) | 113 | 76 | Technology |
| Concurrent Technologies (LON:CNC) | 106 | 79 | Technology |
The themes across the stocks do tell us a lot about the UK market right now and the future… so let’s have a dig around.
- The Big Build is coming: In a gold rush, sell picks and shovels. Yes the housebuilders are an obvious play on Starmer’s coming “Big Build” (which a little bird tells me will be legislated on December 18th), but it’s all the related government and private spending on construction, engineering and fit-outs that may lead to pocket rocket stocks. Carclo (LON:CAR) , Epwin (LON:EPWN) , Norcros (LON:NXR) , Alumasc (LON:ALU) , Costain (LON:COST) - these stocks on the move are telling us something about the future.
- Gold is back: Yes the barbarous relic has seen a 32% rise over the last year, and the small cap precious metal miners are rallying. Gold miners still appear cheap, and are now making lots of free cashflow. More than this, the trend towards ESG investing means resources stocks are underowned. Fiat currencies have debased and gold sees central bank demand. Altyngold (LON:ALTN) , Metals Exploration (LON:MTL) , Serabi Gold (LON:SRB) , Griffin Mining (LON:GFM) all make the list.
- Defence spending is on the up: Trump is back in power, and he’ll likely force the UK and other NATO nations to further increase defence spending. Rolls-Royce Holdings (LON:RR.) , with its £9bn defence business order book has been a big winner up 25% since the May clear trends list. Meanwhile stocks like Filtronic (LON:FTC) and Concurrent Technologies (LON:CNC) on today’s list are providing specialist technology to defence, aerospace and more.
- The Data-Swamped, Cyber-Insecure World: These are megatrends that may run for decades. Businesses need help in data management, security and technology on an ongoing basis. The UK market is lean on tech stocks, but today’s list includes Intercede on digital identity and cybersecurity, Celebrus Technologies (LON:CLBS) on the customer data and fraud prevention side and Synectics (LON:SNX) on critical surveillance and security systems.
Now I’m not a theme first investor, as I’m too easily swayed by narrative. It’s statistics over stories for me. Nonetheless, it’s quite gratifying to see intuitive investment themes pour out of these “clear trending stocks”. In the short term, the market is a voting machine… as Ben Graham would say.
What clear trending stocks have been on your watchlist or in your portfolio lately? Have you invested and seen them pay off, or watched from the sidelines and come to regret it? Are there any stocks on the above list you'd recommend avoiding? Share your thoughts in the comments.
Disclaimer
This is not financial advice. Our content is intended to be used and must be used for information and education purposes only. Please read our disclaimer and terms and conditions to understand our obligations.

66 comments
Not a good start for this folio, down nearly 3%, when All share index is up nearly 4%. The Mid caps are doing better. Early days.
Small caps obviously more risky.
Thanks for the Article Ed. As a newbie to Stockopedia I have previously relied on investing through a range of large equity funds with an emphasis on North America and until quite recently, India after China fell from favour. I made several mistakes upon joining, the worst because I failed to appreciate the need to buy into companies that were rising in value and quality, immediately jumping in and only considering those that fit neatly into the top right-hand green portion of your bubble chart. No doubt others have been there and done that. I have corrected this lately by an appreciation of the need to find companies offering room for growth and clearly on the rise, so have been pleased to find several of my choices listed in your top twenty list of small and mid-cap stocks. The main difference between small and mid-cap which I have noticed from my own slowly growing valuation is the larger number of high flyer and super stock listings in the mid-cap stocks against speculative in the small-cap leading to a greater sense of security in the former listings which do not seem to lag in growth and earnings sufficiently to bother me. The listing you have provided has been a great help for me in adjusting my own portfolio having brought several completely unknown companies to my attention.
A very thought provoking article, Ed.
A question which occurs to me is, "How long can these upward trends be expected to last for?" As we know, no tree grows to heaven.
A further thought is that these trends rely on historical data. There was a lot of research in the last century (and maybe more recently) which shows that share prices follow random walks. In other words, past price movements provide no guide to the future. How do we reconcile the two approaches?
In spite of my queries I still like shares which have good, sustained, upwards movements unless they look too expensive. And especially upward trends in dividend growth.
Richard
Quite interesting information, thank you for it
Thanks Ed. Another great piece. Like the widget a lot. What's the nearest we can get to creating a Screen for your 20 stocks? (Was reasonably pleased to see that I hold five of them....) DD
Ed,
Another excellent article.
I am using Trend Clarity as part of my stock selection process for mainly small and mid caps, so its perhaps not surprising that I hold 11/20 of the above Trending Small Cap portfolio. I have been using the graph eye balling technique for several years and can confirm that it works particularly well in an “up” market, but for me Trend Clarity is largely ineffective in a down market, (e.g. with negative market momentum during COVID).
Trend Clarity is believed to caused by a number of human biases, including an underreaction to good news, and it is these stocks that continue to make new 52 Wk Highs. A newly published (2024) New Zealand momentum study shed light on this phenomena and suggests that it is anchoring bias that deters retail investors from buying stocks that are reaching new 52Wk Highs. In particular it is stocks with a high retail following (often smaller caps) are prone to extended momentum. Furthermore the authors suggest that the steady price drift higher is actually caused by retail investors (us) who either take little notice of good news, or worse sell out to crystalize an early profit. This upward drift can be exploited by more professional institutional investors, (and by us if we can avoid anchoring etc bias).
2024 Report Summary…..The stock price’s nearness to the 52-week high is a stronger return predictor for stocks with a higher retail trading proportion. Our trading flow analysis reveals that retail investors are subject to anchoring bias. Their trading behaviour causes price underreaction to good (bad) information for stocks traded near (far from) their 52-week high.
And Concludes …As retail investors’ trading is subject to anchoring bias, their advisors (and/or for example Stockopedia) could help them become aware of this bias and adjust their trading accordingly.
The full paper is here....
https://www.sciencedirect.com/...
I did a Momentum folio on 13/6/23. Rules top 20 momentum ranked stocks, max 4 in each sector, exclude stocks in takeover situations and ones with wide spreads, over 5%. .It is up 30% but the last 6 months, it has flatlined.
I did another one, same rules, 1/4/24, up 16% after 6.5 months, now down to 11%.
Maybe slightly outperforming Ed trending strategy but needs more testing.
Will do another one soon.
Ed, l was wondering if you had any data, if you used 6 months instead of a year? I prefer to get in earlier, as you say these have gone up a lot already. Yes they will probably go up even more.
Actually - I'm reading a great piece by Robert Novy Marx - "Is Momentum Really Momentum" which suggests that much of the value of price momentum is captured in the first 6 months of a 1 year lookback period. With the more recent 6 months not as strong.
From my first scan, he suggests that of the strong 12->7 month momentum set, the ones that go on to fall in price over the next 6 months outperform those that rise over the coming year. It might suggest that the initial rise is reflective of earnings momentum, and then those stocks pause after their intial rally to base for the next phase.
I've long known that 1 year works better (over the upcoming year) than 6 months... but oddly nobody seemed to have tested it till Novy Marx.
Something in my list to test.
Yes l have noticed a number of momentum stocks, have run out of steam after 6 months. But not all. A number of recent picks have flatlined in the last 5 months or even fallen back.
Not familiar with Novy Marx, l assume he used the US markets?
Ed
Stocks on the Move has some regression period data…. 90 (working) days narrowly beats the rest in their simulation tests.
This is interesting. Can you give more information on where this picture came from?
Yes it’s from Stocks on the Move (2015) by Andreas Clenow. Andreas was ahead of the game in calculating and investing using volatility adjusted slopes.
great book first half if a bit heavy going but second part year by year review of how the system performed is excellent including the years where he was pretty much out of the market in cash for the full year.
Thank you.
Ed,
Look back periods are an interesting topic and have been explored further in a 2022 paper that used 6M and/or 12M momentum look backs.
The paper “Overlapping Momentum Portfolios” studied US companies from 1928 to 2018 and formed top decile momentum portfolios from companies that passed 6M, 12M or both time periods. They concluded that the Overlapping 6M and 12M portfolio significantly outperformed the other 2.
Almost as an aside the authors split the momentum look back periods by the type of investor. They termed 6M look back momentum traders as informed “news watchers”, whilst 12m look back traders were more “finite term” Momentum traders. They postulated that the 2 trader types utilise different information diffusion rates and that combining the 2 momentum investor types created the excess return.
Whilst these findings don’t relate specifically to Trend Clarity type stocks I can’t see why this approach shouldn’t be valid. Something else to add to the list maybe!
The paper is here https://papers.ssrn.com/sol3/p...
Thanks Ian - I've not actually read that paper, so I will add to my library. It certainly backs up our use of 6m and 12m lookbacks in the Momentum Rank.
Thank you Ed for another thought provoking article. Like others, I often feel I am too late to the party, only to see the SP soar further, so this theme is of real interest to me.
Back in May, in response to a question, you provided a list of trending momentum US stocks and I was wondering if you have followed up this aspect of your research and if so , if you have looked at different market cap bandings in the US? The performance of your basket of 20 from May has been impressive!
Yes - re. CMC - the article was focused on small caps, so there was a hard cut off at £350m. I may do another on mid/large caps.
Be great if you did Ed as a lot of Stocko subscribers prefer to fish in the mid/large cap pond
These are the UK stocks with the best fit to the regression line in my database with no filters on quality. I wouldnt buy some on the list so some manual research would be required. I find it a good starting point as the stock will already be in a nice upward trend
Paul,
I am using regression data too in my stock selection, and wonder if you will be going to Mello on Wednesday and would like to meet over a coffee to compare notes? Ian
Hi Ian
In Derby? Bit of a trek for me as I live on the South Coast. If you take a look at the fund/etf side its interesting to see how travel companies are faring (The Travel UCITS ETF Acc (LON:TRIP) reflected in companies like International Consolidated Airlines SA (LON:IAG) and Carnival (LON:CCL) trending strongly (original screenshot). Happy to compare notes
Paul - Interesting ETF results and a lovely graph for £TRIP. I hold International Consolidated Airlines SA (LON:IAG) and have looked at Carnival (LON:CCL), but have been put off be the high level of gearing. Happy to compare notes by email, so if you email me I will reply. Mine is idwright@btinternet.com
Is it possible to screen for this?
First two are straight forward enough but the last...? Just with some tinkering I've come up with sorting by Absolute Price Change 1y on a descending basis but not sure this achieves the desired result.
If you read the original warpaint article, you will see that the human eye is a very good judge of trend clarity. Ultimately we humans are quite good at spotting a line of best fit that hugs a scatter plot well.
So if you use your screening rules, and then use the mini-chart view, rather than the table view, you will quite easily spot the more clearly trending shares.
There is a little judgement in doing so-but it works. I am sure we'll get round at some point putting some of these ideas into practice in the product offering.
I like looking at the mini charts, a great feature.
Enwell Energy (LON:ENW) not looking too good at the moment? A few others are below the 50MA.
A few on my screen, that did not make your selection, look quite good, such as Eurocell (LON:ECEL) and Elixirr International (LON:ELIX).
Yes - I did draft the list a couple of days ago... and Enwell has pulled back a bit in the last couple of days. It was only a "Clear" trend, rather than a "Very Clear" trend (i.e. 60-80 quintile, rather than 80-100). Probably a natural reversal from such a swift run up - although I admit I don't know the stock well.
Just seen Enwell Energy (LON:ENW) is down 48%, it did not look good on the chart.
Dreadful! having just bought into Enwell Energy days before the plunge of nearly 50% in a single afternoon, I was fortunate enough to hold my nerve long enough for the management of the company to have the order preventing operations suspended, while legal activities proceed, attempting to overturn the Court decision and managed to sell my holding after the share price had recovered to 21p. However from viewing the institutional shareholder details it seems that Smart Energy the main shareholding company is simply a non-operational shelf business, set up by a person or persons previously banned from receiving profits from this type of business by Ukranian authorities, in order to hide their involvement and divert funds offshore.
That was bad luck. Having looked into Enwell Energy (LON:ENW) a bit more l would not have invested, as it is based in Ukraine, also the forecasts don't look that good. I'm very wary of shares that spike up, l often sell them, sometimes they go up even more but more often, people take profits and they fall back. These screens work well overall but you will always have a few bad apples, especially in the small caps.
I should have looked further into the institutional shareholding companies of Enwell Energy and their directors together with news for sure, but was relieved to have only lost about 23% rather than 50% of my investment, which I have already recovered by Ed's tip for Costain to be honest. Apart from that one name on the list of trending shares, I am delighted by the progress of most of the remainder many of which would have escaped my notice, together with the importance of momentum and value ratings as growth drivers.
On the third point I think you want Relative strength (1 year), then advanced, rank in market, greater than 80..
Run your winners - sell your losers.
Listening to Tom Hougaard Best Loser Wins.
Day trader but focuses on his emotions of fear and hope. Focus on the losers and leave the winners alone or add to. Never average down.
Its only money lol.
I’ve read alot about his strategy and the mental aspect of trading. I would disagree with adding to losers though, as it’s served me well so far, although nothing is clear cut and I only do it on certain stocks. One I'm currently considering averaging down on is Hunting (LON:HTG) . I know Paul was a big fan of this one, I’d be interested in hearing anyone else’s thoughts on this one?
I used to hold Hunting (LON:HTG) not sure about it, the sector is struggling due to our new Government. I have averaged down successfully on some stocks, such as Warpaint London (LON:W7L) but it is tricky in the UK market. In the US market, l would do it on the large caps, did it on Alphabet (NSQ:GOOG) bought more everytime it fell $10, it soon went back up.
Thanks Edward for covering these. It’s great to see Metals Exploration (LON:MTL) get a mention once again. It’s suffered a bit this last week or so, but is on a clear up trend, with good news just round the corner about the drill results I’m sure. I first got wind of this here due to its incredibly high stock rank and low valuation. I expect this to be 10p by 2025.
I bought into SRB after watching your multi-bagger content, where I copied your screen and it was the only one that turned up. It's obviously on a clear trend, and that is in no small part due to the gold price but the fundamental are pretty good and there is consistent good news so hopefully it will keep climbing.
Hi Ed, this is a fascinating piece of analysis. From a behavioural point of view it’s just so hard to jump in after a strong run, yet every time I’ve summoned up the courage to do so it has seemed to work out. Re your question about other shares, does Morgan Sindall (LON:MGNS) make the grade (albeit not a small cap any more)?
Yeah I know - it's so hard to buy strong trending stocks. At some point trends do pause or stop... so hard to know when.
Most trend followers aim to invest at the start of a trend - on a breakout, like Stan Weinstein. The "trend clarity" approach is more of a cross-sectional approach, building a portfolio of shares irrespective of where in the trend each stock is. It's extremely challenging, behaviourally, to take on this sort of approach... caveat emptor and all !
re. Morgan Sindall (LON:MGNS) - yes it still a very clear, upward, very strong trend.
I may follow up with a study on mid and large caps only... as it throws up such interesting themes.
Thank you . That would be very useful indeed.
Hi spmarriott,
I was going to add Morgan Sindall (LON:MGNS) which I hold but you beat me to it!!!
Other shares which I hold and I would add to the list are XPS Pensions (LON:XPS) and Renew Holdings (LON:RNWH) .
Ed, would CMC Markets (LON:CMCX) also qualify or is a 12 month rising period not long enough or is CMCX too cyclical??
David
.
CMC Markets (LON:CMCX) is too large this list which only up to £350m mcap.
Hello Ed, thanks very much for this great article. what kind of plug-in are you using there to do the Trend Analysis in the top right corner? also, Andreas Clenow speaks about not linear regression but exponential regression? Can you elaborate more on 6m vs. 12m Momentum? And when is the best time to sell?
I actually built it myself... am keen to get it into the site
BLASH or BTT, that is the question. But why not buy both in 2025?
Hi Ed
This is a very interesting article, thank you! As for a Trend Analysis widget, I’m sure I would find it very helpful.
Cheers
Simon
Many thanks for a great article.
With momentum the holding period is important. I have been tracking the earlier cohort which managed +8% in the last 6 months. It will be interesting to see when their performance drops off. I suspect at around 12 months, which is usual holding period for momentum.
It will be useful to compare the trajectory of the old and new portfolios to see if momentum is stronger in the first as compared to second 6 months after formation.
The housebuiders may be an obvious play on Starmer's 'big build', but they responded poorly to the recent budget.
You back-tested 11.5 years of market data. That's not enough to include a proper crash (COVID was more of a jolt than a crash). I'd suggest the conclusions would be more robust if the run-up to the dotcom boom and bust and the GFC were included. 25 years of back testing should suffice!
I agree - unfortunately our database starts in 2013 so we work with what we have.
Standard Chartered (LON:STAN) currently has a billion plus buy back underway, decent dividend yield and low loan impairments plus always comes up in large cap possible take over candidates list in the xmas and new year tips.
A few of these are well off their peaks such as System1 (LON:SYS1) down 23%, l don't hold, has been on my watchlists before but never bought it. I do hold a number of those already.
I did sell Rolls-Royce Holdings (LON:RR.) recently which is looking like a mistake now but as Megan said it is pretty spicy.
Perception seems to be all, as I did the opposite, selling System 1 before it suddenly got lift-off and buying Rolls Royce when it was well up the escalator. It is hard to be right an so easy to be wrong and to top that we have a Chancellor who is even more determined to screw PI success.
Yes it is tricky, some you win, some you lose. Top sliced quite a few stocks that were looking peaky, which is the opposite from what this is strategy is about. But some do fall back such as Marks and Spencer (LON:MKS) and Mortgage Advice Bureau (Holdings) (LON:MAB1), even Warpaint London (LON:W7L) is down considerably.
Just bought back into Rolls-Royce Holdings (LON:RR.) at slightly less than l sold for.
Thanks for a great article!
Thinking about it I have a cognitive bias against buying shares which have already risen a lot. It's probably a bias that is harming my wealth! So a useful nudge in the right direction.
Is there a data field in the Stockpedia screener to sort by trend clarity? The only thing I found was 'Autocorrelation'. Maybe this serves as a reasonable proxy for trend clarity?
Mark - thanks and appreciated! At the moment, we don't have a screening field for this, but we've had some discussions about it.
On this note and out of curiosity, I built a small chrome extension last weekend, which classifies the market by trend clarity (from very clear to very weak), direction (upwards, sideways, downwards), and 1 year price strength (from very strong to very weak). I wanted to see these labels in action across stocks in the market. It’s just a toy for now with a fixed snapshot of data that doesn’t update, so please don’t ask me for a copy.
Nonetheless, I'd be keen to know your thoughts on the usefulness of this kind of data... screenshots below.
(For disclosure - I do own JNEO - "unclear" trend there)
Ed. This looks very useful. Coincidentally, I own 2 of the 3 shares mentioned and the trend analysis agrees with my analysis.
Looks wonderful and very useful.Full stack coding the bane of my life right now........!!I've definitely been outperforming since i read your article on cognitive biases to buying higher and clear trends.The thesis is elegantly simple that if a business is doing well and the chart looking smoother, it should continue to do well for a while, people will notice this and buy higher.Not sure why i found it is so hard to do in practice.Perhaps i always wanted to go for that lottery ticket 10/100 bagger, which might still be profitable but either is too small a business or something is 'wrong with the business' that isn't in my circle of competence, and be in on the ground floor.When in reality i probably would have sold way too early anyway.
Ed, the trend analysis fields look fantastic and I hope you'll be able to code them into the Stockpedia database before long. What especially helps for me is (by the look of it) is simplifying the data into an easily understood traffic light system.
I’d use a screen like that.
Hi Ed,
Just reading through the comments, but I saw this little widget in your previous post and even went to look for it in another Chrome tab! Suffice to say, yes please! I'd love to have that!
Good articles, thank you!
Regards,
Jon
Brilliant article - i would love some real world future testing of actual picks to avoid and chance of backtesing being biased. Would love to see a portfolio update along sif rules to see how that performs - with some mechanical test being used to spit one out and replace.
Volunteers needed
i have three of the above B.P. Marsh & Partners (LON:BPM) and Norcros (LON:NXR) and Epwin (LON:EPWN) also hold MPAC (LON:MPAC)
note with the exeption of mpac which is a new add these are stocks i have had to play the real long game here for them to be in sweet spot ref trend. I would presume though that the fisrt three very mcu bieng plodding companies i wouldnt expect an uptrend to continue - thast the interesting part though will the uptrend take them above fair value so i can part cash in then await return to normality. I did part sell my B.P. Marsh & Partners (LON:BPM) down as its probabably as close to NTAV as its ever been and its pretty much awlasy traded at discount - they have done soem recent deals though so perhaps even there there may be room. I would be slightly surprised though if the above shares kept trending stongly - perhaps MPAC (LON:MPAC) being more of an unkown as they haev had recent large acquisition. Note both epwin and nxr are still oin cheap pe's of under 10 as we speak - its just that normally how its been - would be nice for these to command p/e of 15 and allow me to top slice knowing full value has outed - but knowing these shares well i doubt that will happen - heyho perhaps the ecomomy will pickup - with my investments at present i am trying to stay awy from companies that think better is "juist around the corner" but definately not now.
Great insights rmillaree.
Interestingly, I met a fund manager yesterday - he reads every RNS every day, and has a DCF model for every stock in the market (does it all himself). How on earth does he do that? “Well, I just update them on each RNS”.
His insight was that the outlook statements have suddenly turned from being 10/10 cautious/negative… to 7/10 more positive.
“Every time that’s happened in the past, UK stocks have risen by 20% in the ensuing 12 months”
Perhaps we'll see the market average P/Es add a couple of points and get the reratings a lot of these stocks deserve?
Many, many thanks Ed.
As a result of your Warpaint article, I bought CRN (now up 24%) and PFD (now up 14%). I've been amazed by the results. Previously, I would have thought that I'd missed the boat!
I'm off now to buy some COST following which I'll rummage through the rest of your list.
Tanks again.
Glad to hear that John.
As they say, "The trend is your friend until the end when it bends.".
As with all momentum approaches, it's important to be mindful of this.
The Trended Momentum paper from which these ideas originated show that the "alpha" of the clear trended stocks tends to tail off after about 15-month holding periods, with a peak at 8 months. These are averages, of course, but it's worth bearing in mind!