
Prices are never too high to begin buying, nor too low to begin selling. Jesse Livermore
It seems counter to every bargain hunter's first instinct, but when a stock's price rises, the probability of it continuing to rise increases. This is a very strange phenomenon, though can make more sense when you consider the human desire for fashionable or luxury goods. The more popular or expensive an item becomes, the more buyers seem to crave it. In financial markets, this is known as the ‘momentum effect’. Buying into 'strength' has been found time and again to be a persistently profitable strategy.
Background on Momentum Investing
While Benjamin Graham was preaching the virtues of deep value investing to his students at Columbia Business School the 1920s and 30s, there was a group of ‘tape readers’ who took a markedly different approach to gaining profit in the market. Unschooled in company accounting, they watched market prices like hawks and profited from trading into price breakouts and trends. Jesse Livermore, Gerald Loeb & Richard Wyckoff were just some of the market professionals who used this observational skill to amass fortunes in this way in the early 20th century period.
Livermore was particularly adept at trading breakouts on both the upside and the downside. While Ben Graham was losing his shirt in the Great Crash of 1929, Livermore had sold stocks 'short' and netted over $100m on the day. Unfortunately for Livermore, he wasn't as adept at hanging onto his profits. The volatility inherent in momentum investing caught him out time and again and he went bankrupt three times in the process... and he eventually committed suicide in a sad end to a remarkable life.
But the "momentum effect" continued, and market participants caught on. In a hundred years riddled with incredible stories here are just a few more:
A globe-trotting dancer & small scale private investor, Nicholas Darvas, inspired by Gerald Loeb's story, developed a simple "box method" of buying stocks breaking out to new highs outlining his success in the 1960 book How I made $2m in the Stock Market[1].
Richard Driehaus, whose firm Driehaus Capital Partners delivered compound annual returns of 30% during the 12 years from inception in 1980 by buying breakout small & midcap stocks beating their forecasts - and staying with the trend as long as possible.
Richard Dennis, a commodity trader who had turned $5k into $100m, made a bet with a friend that he could teach anyone to replicate his rules-based, trend-following success in the 1980s. The two classes of "Turtle Traders” he taught went on to earn more than $175m in five years.[2]
When Jegadeesh & Titman published their seminal academic paper Returns to Buying Winners and Selling Losers[3] in 1993 the cat was finally out of the bag in academia. Their replicable research, using widely available data, showed without any doubt that buying portfolios of stocks that had performed best over the last six months continued to outperform the worst performers by 1% monthly over the next six months.
Dozens of academic papers since, have shown that a momentum effect exists not only in stocks, but in almost every other asset class - including bonds, currencies, funds, property and more.[4] In fact it is so persistently and pervasively profitable that it has been christened the ‘premier anomaly’ by Fama & French - the kings of finance geeks.
How to measure Momentum?
Like all factors, there are a myriad of ways to measure momentum. We'll look at just a few.
The simplest approach is to simply measure the price performance over a period (often six to 12 months) and sort the market by this measure. While the biggest recent winners by this measure often have a short term price reversal in the first month, they tend to significantly outperform the market over the next 3-12 month period. Some evidence shows that over longer term 3-5 year periods these 'momentum' stocks can reverse again.
So the key to harvesting momentum profits is to stick to this rule of thumb "own momentum stocks for up to 12 months but not longer".
For those who want to delve deeper, there are all kinds of effective momentum measures, although they all are targeting the same kind of phenomenon - winners beat losers.
Work by George and Hwang in 2004 showed that the closer a stock's current price is to its 52-week high price, the stronger that stock's performance in the subsequent period.[5] They show that this is a superior measure than the relative strength measures previously discussed - which is astonishing as lists of new 52 week highs are published in almost every newspaper & financial website! They propose that price levels are more important predictors of future momentum than recent price changes.
Work by US finance professor Seung-Chan Park in 2005 [6]found that stocks where the 50-day moving average price (MA) is much higher than the 200-day MA tend to perform better over the subsequent six months than stocks whose 50-day MA is much lower than the 200-day MA. He finds that buying the top 10% of stocks by this measure generates 1.8% monthly. He suggests that investors are anchored on these moving averages as reference points.
Momentum is evident not only in share prices but also in company earnings. When companies surprise to the upside in their earnings announcements, the share price tends to react too slowly react to the new information and create a new upward trend. This has become known as "Post Earnings Announcement Drift" and been catalogued in many research papers. More than this, City Research Analysts - who are paid to predict the future of stocks - appear slow to update their profit forecasts to new information and are reluctant to increase their recommendations - these biases reinforce the upward price trend.
Why does the Momentum Effect work?
The Momentum effect has inspired a great number of theories as to why it exists.[7] Most of the evidence is that it's our own biased human nature that drives momentum, although there is some evidence that higher momentum shares also offer a higher payoff due to risks.
Behavioural Reasons: The obvious point here is that buying stocks at new highs goes against human instincts. We're hard-wired to buy when prices drop and sell when prices rise which creates a collective reluctance to “pay up” for stocks on the move. This leads to price under-reaction in the short term. Markets tend to digest new information slowly and investors stay anchored on previously low prices. Over time, prices start to wake up, and investors join the bandwagon, which leads to an extended price trend and a trend over-reaction in the medium to longer term.
Risk Reasons: There is some evidence that stock that have recently had strong price runs are exposed to greater economic risks. For momentum stocks, prices can advance ahead of the fundamentals (sales and earnings may lag). This leaves the company exposed in the case of bad news - so investors in the stock need rewarded with a 'momentum premium' to compensate for the risk.
While the academics can argue it all out, individual investors can continue to profit from momentum by the basic rule of thumb - buy recent winners and sell recent losers!
Stockopedia's Momentum Rank
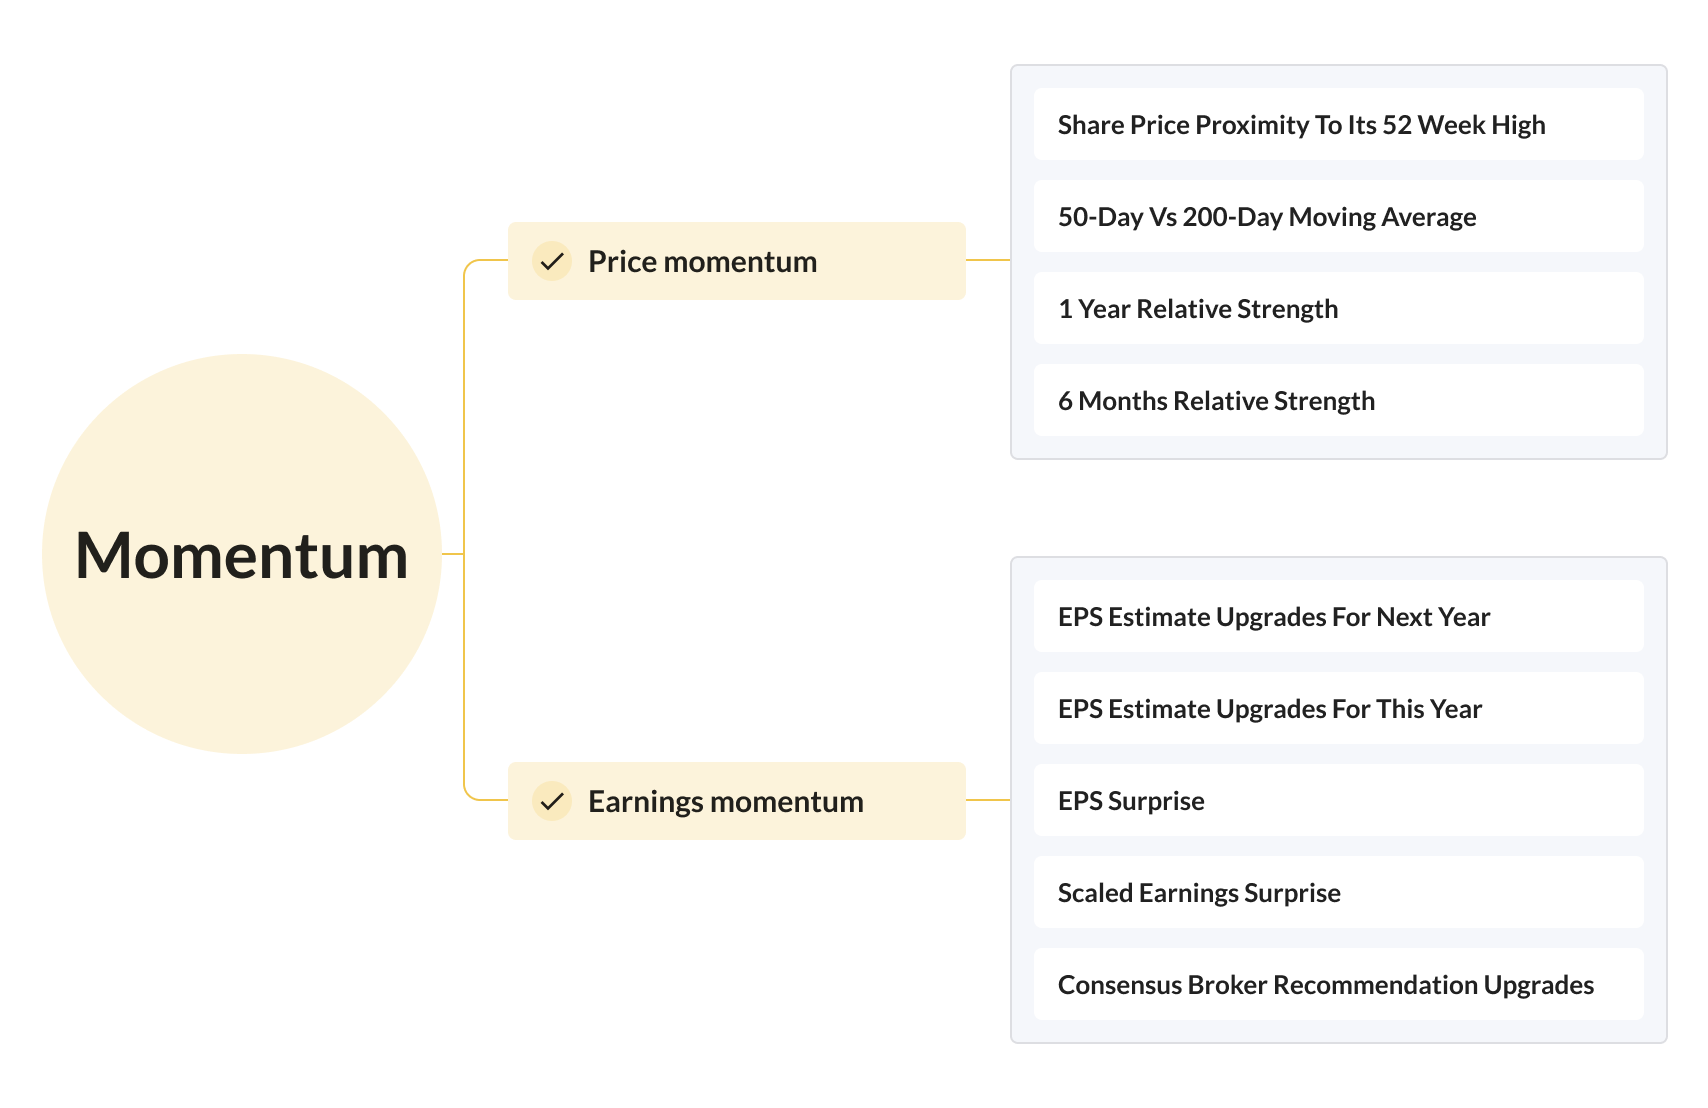
Similarly to our approach to Value & Quality we take a composite approach to measure momentum. We assess both price momentum over the six to 12 month period, and recent momentum in analyst earnings forecasts. Each company in the market is ranked from one to 100 for each of the measures and a combined score is calculated as a weighted average of all valid ranked values. The Momentum Rank is then calculated between zero and 100 for this composite score, where 100 is best (strong stocks) and zero is worst (weak stocks).
Price momentum factors
The factors we use are inspired by various academic research papers into the Momentum Effect, including Jegadeesh and Titman on 6–12m relative strength, George and Hwang on 52 week highs and Seung-Chan Park on moving averages.
Share price proximity to its 52 week high
Difference between the 50 day and 200 day moving average
1 year Relative Strength of the share price vs the market
6 Month Relative Strength of the share price vs the market
Earnings momentum factors
Stocks have a tendency to under-react to upwards earnings estimate revisions, to recommendation change revisions, and to earnings surprises.
EPS estimate upgrades within the last one month for next financial year
EPS estimate upgrades within the last three months for this financial year
EPS surprise percentage based on the latest reported financials
Scaled earnings surprise based on the standard deviation of the original Consensus forecast
Consensus broker recommendation upgrade over the last month
Please note, that when a company has no analyst coverage we cannot calculate earnings momentum. As a result in these situations, the Momentum Rank is calculated using price momentum factors alone.
- Nicolas Darvas. How I Made $2,000,000 in the Stock Market.
- Curtis Faith. Way of the Turtle - The Secret Methods That Turned Ordinary People into Legendary Traders. 2007
- Narasimhan Jegadeesh and Sheridan Titman. Returns to Buying Winners and Selling Losers: Implications for Stock Market Efficiency. 1993
- Clifford Asness, et al. Value and Momentum Everywhere. p.54
- Thomas George and Chuan-Yang Hwang. The 52-Week High and Momentum Investing. 2004
- Seung-Chan Park. Two Essays on Momentum. 2005
- Tobias Moskowitz. Explanations for the Momentum Premium. . 2010