Charles' Story

How did go about finding investments before Stockopedia?
I have used different stock market data suppliers for a while now. I use a filter that selects only equities that exhibit a consistent, upward momentum or trend. There is very little point, in my view, in selecting equities that merely maintain their value or, even worse, trend downwards.
I look for a minimum of 4 months to establish consistent upward momentum I also include a ROCE figure of 15% or greater. I monitor their progress, and once they turn level or even down I look to replace them. I accept some volatility but I prefer shares whose prices move within narrow trend lines.
Stockopedia’s StockReports are some of the best I have seen.
In what way has Stockopedia changed your approach to investing?
Stockopedia’s StockReports are some of the best I have seen. Once I have identified equities that display the momentum I want, I look very carefully at the StockReports to try and understand why that particular share is doing well, and to note any inconsistencies. I particularly like to look at the Graham Formula in Margin of Safety as well as the historic performance of each metric through Stockopedia’s graphs.
I also consider the StockRank for each investment, particularly the Quality and Momentum ranks. Stockopedia’s bubble charts help me quickly analyse each share’s exposure to these factors. I try to ensure that all investments are ranked highly for their Quality and Momentum, anything that falls outside of this is subject to careful analysis.
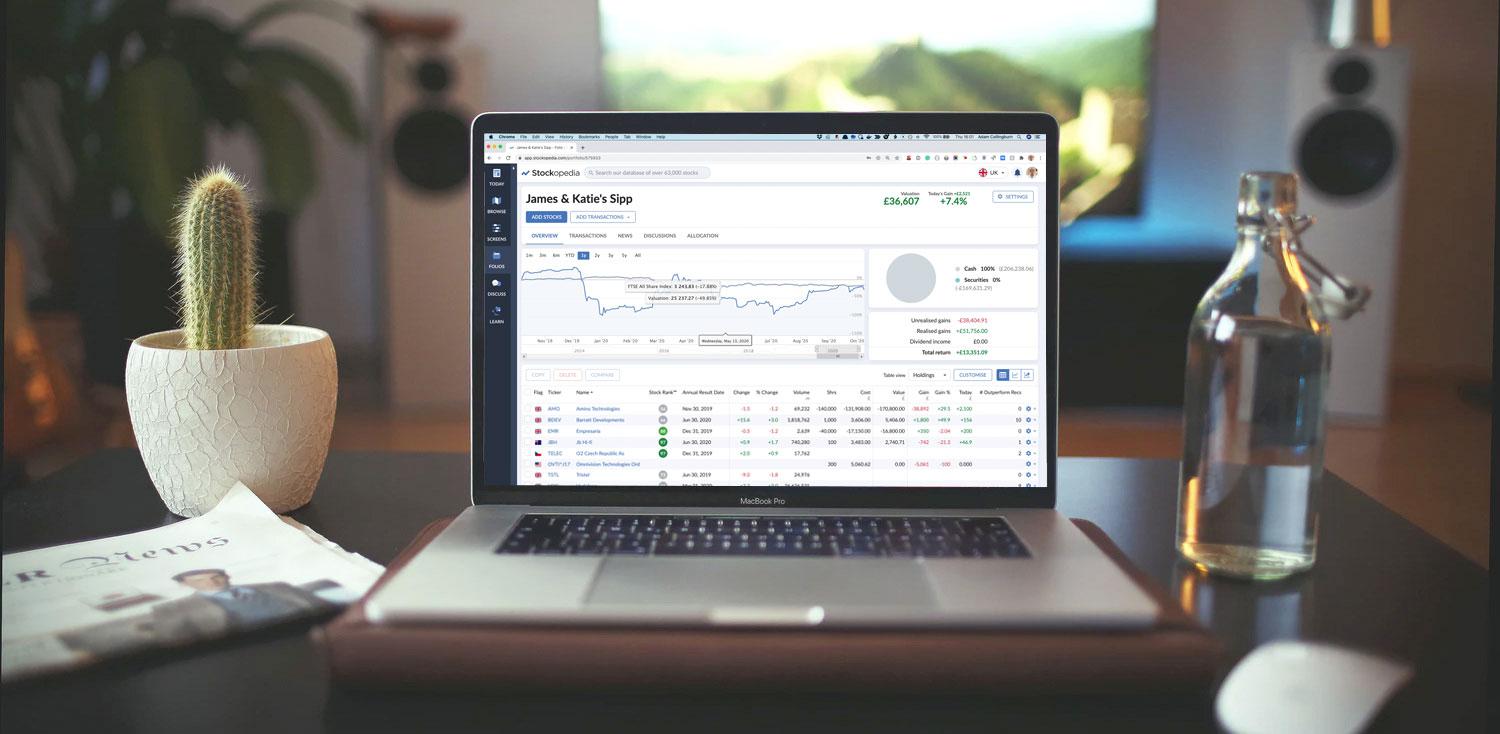
Charles uses Stockopedia on his laptop and iPad to manage his investments.
Has this impacted your investment results and/or quality of life?
Since I started using Stockopedia I have achieved an investment return of about 25% for my wife’s SIPP, 20% on my SIPP, and about 18% with our investment club portfolio. I do a fair amount of analysis each week, but Stockopedia helps give me peace of mind.
What's your advice for investors that are just starting out?
I have a few rules that have worked really well for me: Aim for at least 20, preferably 30, equities in an initial portfolio to gain diversification of sector. Balance the portfolio between about 15% large cap (elephants), 45% mid-cap (FTSE 250 + UKAIM 50) and 40% Small cap + AIM UK 100 > £50m (cheetahs).
Use Stockopedia’s High Flyers, Super Stocks, Turnaround and Contrarian screens to help you build a good watch list.
Use Stockopedia’s High Flyers, Super Stocks, Turnaround and Contrarian screens to help you build a good watch list. Use Stockopedia’s Quality v. Momentum (QM) score, ideally >85, to check that upward momentum is being maintained. Use Stockopedia’s ‘bubble’ diagram facility to regularly check their exposure to these factors.
Disclaimer - Testimonials are provided by third parties for informational purposes only and are not intended and should not be taken to be financial product advice.
A subscription to Stockopedia will be one of the best investments you'll ever make...
Here's what you'll get:
- Find stocks likely to perform with proven Quality, Value and Momentum ranks
- Analyse shares in minutes, not hours with an all-in-one research platform
- Develop a consistent strategy with daily guidance and educational webinars
- Track and improve your results with portfolio analysis tools
- Become a self-reliant investor, saving thousands in advisory fees
Stockopedia is the perfect solution for active investors looking for more discipline and better results