A checklist for finding high quality shares

In the first of this new mini series, I’m going to present a checklist showing the process I work through when I’m looking for quality shares that I might be interested in buying.
In subsequent articles, I’ll also follow the same process for income and growth stocks, so stay tuned.
What’s a quality stock?
A true quality business is one that generates above-average returns and is able to continue growing sustainably without sacrificing profitability.
Such businesses are often – perhaps inevitably – expensive. But their ability to compound returns at attractive rates means that they may still be able to outperform the market.
One good example of this is FTSE 100 publishing and data group Relx (LON:REL). This business has often looked expensive to me, but has comprehensively outperformed the FTSE 100 over the last 10 years:
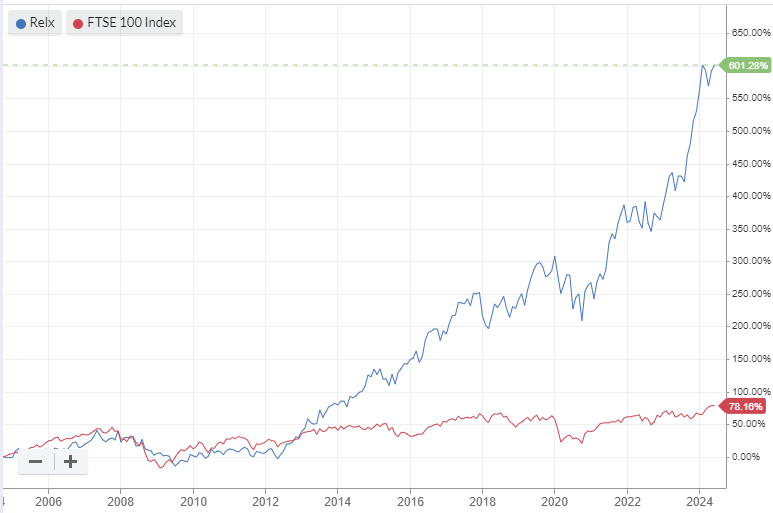
Not all quality stocks will deliver such marked outperformance. But this kind of chart is the ideal I’m hoping for when I look for quality stocks.
Here’s a summary of the checklist process I use to try and find quality compounders.
What do the numbers say?
As a systematic investor, my stock picking process always starts with a screen or checklist. I want to find companies that have the financial characteristics I’m looking for. If they do, I’ll then take a more in-depth look at the broader qualities of the business and its valuation.
There are three non-negotiable financial attributes I look for in a true quality stock:
Profitability
Return on capital employed, or ROCE, is generally seen as the single most important profitability metric for quality investors (for non-financial stocks).
If you’re not familiar with ROCE, Ed has written a detailed explanation here explaining what return on capital means – and how a high ROCE can contribute to multibagger gains like those delivered by Relx.
As a rule of thumb, I’d expect a true quality stock to have a five-year average ROCE of at least 15%. I can check this quickly and easily using profitability metrics on the StockReport:

The other main profitability metric I use is operating margin. This expresses the difference between a company’s revenue and its operating costs, including cost of goods sold.
Operating margins are easily visible on the StockReport, just above ROCE – see above.
Businesses with a high operating margin generally benefit from pricing power and some competitive advantages. I’ll discuss what form these can take shortly.
I allow more flexibility with margins than ROCE, to allow for different business models. But as a rule of thumb, I expect a quality stock to have an operating margin of at least 10%, preferably much higher.
Cash generation
In itself, a profit is only an accounting entry. It does not necessarily mean that the corresponding amount of cash has flowed into the business.
A quality compounder (or almost any good business) also needs to be converting its profits into free cash flow. We’ve explained this topic in depth here – well worth a read if you haven’t seen it before.
When I’m screening for quality stocks, I use free cash flow both as a measure of cash conversion and for valuation.
Cash conversion: free cash flow can be lumpier than profits from year to year. This is because cash generation is factors such as one-off capex commitments that may not affect profits. For this reason I find it useful to look at free cash generation over the last five years, rather than just the last 12 months.
The StockReport allows us to make this comparison visually by comparing the EPS figures with free cash flow per share – I’ve highlighted these in this edited image:

As a rule of thumb I look for at least 75% free cash conversion from earnings, on average, in a quality stock. Higher is better – good quality defensive businesses can sometimes achieve consistently above 90%.
Valuation: it would be nice to buy quality compounders when they’re cheap. But this rarely happens, except perhaps during major market crashes. Warren Buffett’s late partner Charlie Munger gave us a clue as to how we might think about quality and valuation:
Over the long term, it's hard for a stock to earn a much better return than the business which underlies it earns. If the business earns 6% on capital over 40 years and you hold it for that 40 years, you're not going to make much different than a 6% return—even if you originally buy it at a huge discount.
What Munger meant is that over long periods, valuation changes tend to average out and the returns investors receive reflect the underlying growth of the business. On that basis, it makes sense to pay a higher valuation multiple for a business that generates a 20% return on capital than one which only returns 10% on capital.
Even so, I think there has to be a bottom line somewhere in terms of valuation. I look for a free cash flow yield of at least 2%-3%, or alternatively, a free cash flow yield that’s greater than any dividend yield.
We can check a stock’s free cash flow yield quickly by inverting the price to free cash flow ratio shown in the StockReport valuation snapshot. Here we see a P/FCF ratio of 32, which is equivalent to a free cash flow yield of 3.1%:

Is it a true quality compounder?
High returns on capital and good free cash flow generation are essential ingredients for compounding. This refers to a company’s ability to reinvest a portion of its retained profit to fuel further growth.
Being able to reinvest surplus profits at consistently high returns on capital is what defines the best quality stocks. It’s this characteristic that allows some companies to outperform the market for many years and deliver multibagging gains.
How can we measure whether a company is compounding its retained profit?
Ultimately, returns on capital represent the earnings generated from a company’s assets, or capital employed.
To look for evidence of compounding I compare a company’s net asset value, or book value, with its historical ROCE.
What I want to see is a rising book value per share and stable ROCE. This will tell me that a company is retaining profit (rising book value) and reinvesting it successfully (stable ROCE).
If this requirement is met, then I can usually be confident that the company is also generating sustainable profit growth from its growing asset base.
As always, the StockReport provides us with an opportunity to check this visually, before digging deeper if needed.
First of all, I can eyeball the ROCE line of the profitability table. Alternatively, hovering over the row name gives a visual snapshot:

Next, I can scroll down to book value see if the company has added to its capital employed during the last five years:

These charts relate to Relx. While growth rarely comes in a straight line, I think it illustrates the combination of stable ROCE (note the impact of the pandemic) and rising book value.
To get a fuller picture, I’ve used the 10-year data on the accounts tab of the StockReport to create this graph:

Working through this in stages, we can see:
Operating profit has risen by 87% since 2014
Book value per share has risen by an almost identical 86%
ROCE has remained in a stable range, averaging 22%
Note how profit and book value have grown in direct proportion. This tells me the company has been able to deploy additional capital at stable rates of return -- exactly what I'm looking for.
Signs of quality
When I’ve found a company whose accounts suggest it could be a quality compounder, my next task is to find out how the business works. More specifically, I want to try and understand whether it has the durable competitive advantages needed to support many more years of quality compounding.
It’s worth pointing out that competitive advantage generally comes from within a business. It isn’t about sector growth or macro trends, Warren Buffett emphasises:
The key to investing is not assessing how much an industry is going to affect society, or how much it will grow, but rather determining the competitive advantage of any given company and, above all, the durability of that advantage.
One approach I often use when assessing the competitive advantages of a business is to work through the five-stage checklist we use when preparing Stock Pitches.
Intangible assets: things you can’t see but which have value and are hard to replicate. Think about brands, patents and regulatory approvals, for example. These can provide pricing power and stable long-term demand.
However not all intangible assets are equally durable – some brands lose their appeal after a while. Similarly, patents expire and regulatory approval may also carry responsibilities and restrictions.
Switching costs: I look for businesses with sticky customers. Software companies can be good for this, especially if they serve business customers. Accountancy software such as Sage (LON:SGE) is a classic example – changing to a new system is a massive headache.
Many Microsoft (NSQ:MSFT) products and services also fall into this category.
Network effects: Rightmove (LON:RMV) and Auto Trader (LON:AUTO) have the vast majority of web traffic in their niches. They also have the most listings. More traffic brings more listings. And so on. This is a network effect. Buyers and sellers both benefit from using the same service as everyone else.
Microsoft – again – is also a good example. Businesses benefit from using its systems simply because everyone else uses them too.
Cost advantages: does the company have any cost advantages over existing rivals or would-be competitors?
These often fall into one of three categories:
Cheaper/better process
Location advantages – especially in natural resources and heavy industry
Unique assets – perhaps natural resources, but also data. Consider the way in which London Stock Exchange (LON:LSEG) has grown, in part because of its access to and control over valuable data.
Greater scale: businesses with high fixed cost bases can often gain a competitive advantage simply from being larger. By spreading fixed costs across a larger number of customers/transactions, operating profit margin can be increased.
Scalability applies to businesses such as large retailers and manufacturers. But it can also apply to technology firms where the initial cost of developing a product is high, but the incremental cost of an extra user is minimal.
History: one final factor I like to consider is the age and track record of the business. A company that has been generating reliable returns for its shareholders for decades already probably has some advantages of some kind.
I also like to see some consistency in a company’s business model. Evolution is good and necessary, but I prefer to avoid companies that regularly attempt to reinvent themselves.
What can go wrong?
The Warren Buffett quote above emphasises that “above all”, we must try to understand the durability of a company’s competitive advantage.
The reason for this is that if a company loses its competitive advantage, it may suffer a loss of pricing power, falling profits and a brutal share price de-rating.
Similar, but perhaps less severe, is if a business retains its competitive advantage but reaches maturity and can no longer reinvest retained profits at attractive rates of return. Tobacco might be an example of this. Such stocks can provide an attractive income, but may also suffer a multi-year de-rating as markets reprice the business to reflect its ex-growth status.
Next steps
Many of the criteria I’ve discussed in this article can be added to a screen to look for potential quality plays. I use screens extensively for finding new shares to research.
Another approach might be to list the FTSE 100 or FTSE 250 and sort by QualityRank to find the shares that score highest in Stockopedia’s quality algorithm.
If you do consider using a screen to find quality stocks, one tip I would share is to avoid making the screening criteria too tight. Ideally, screen for a little less than you want. Financial metrics fluctuate from year to year and you will rarely find a share with a perfect profile. It’s easy to eliminate stocks that you might really want to consider.
My approach is to use relatively relaxed screening results as a starting point for more demanding in-depth research.
As a source of possible ideas, here are some links to quality-themed screens I have produced previously:
Disclosure: Roland owned shares in Sage at the time of publication.
Disclaimer
This is not financial advice. Our content is intended to be used and must be used for information and education purposes only. Please read our disclaimer and terms and conditions to understand our obligations.

18 comments
Thanks for a great article Roland. As a 'newbie' I find articles like this very helpful
This is a Buffett style approach which is obviously great long term. But it is important to get a style that matches your personality. Personally i can't sit on a stock for years on end through thick and thin. I like to hold for a year and then reassess, which would not suit this approach.
Hi Roland. Very good article. Please tell me if I have got this right. You are looking for FCFPS to be at least 75% of normalised EPS? I tend to find with quality companies that FCFPS is normally well over 100% of NEPS. Are you setting a very low bar with a minimum of 75% to just rule out drastically under performing companies?
Hi WarrantStar,
Yes, it's probably fair to suggest I'm setting a low bar. Like you, I prefer to see free cash conversion closer to 100%.
The reason for my caution is that anomalies in the data and/or annual results are inevitable when screening. This can lead to me disqualifying stocks that might be of interest. I prefer to take a less restrictive approach when screening and then research more deeply from a short list.
Another point is that some types of business may periodically go through investment phases where FCF dips, but they remain highly cash generative when you look through this.
Hope this helps,
Roland
Brilliant article thank you Roland
Very useful read, thanks Roland.
Many thanks Roland - terrific article
BTW, when an investor finds a high quality company, what typical valuation metrics & associated benchmark levels (eg PEG, EV/sales, EV/gross margin, EV/EBIT, PE, risk adjusted returns, private market worth, FCF yield, etc) do you use - ie in order to assess whether it will also be a high performing stock?
BTW, when an investor finds a high quality company, what typical valuation metrics & associated benchmark levels (eg PEG, EV/sales, EV/gross margin, EV/EBIT, PE, risk adjusted returns, private market worth, FCF yield, etc) do you use - ie in order to assess whether it will also be a high performing stock?
I’m tempted to say that the more expensive the better across all metrics. But the glib, and fundamentally reliable, answer is none. It’s the moat that confers the long term performance. And that shows up in the operating numbers, not the valuation. None of my best performers have ever looked good value in absolute terms. In my experience, what works is to find the company you really want to own and buy on any weakness.
Hi Paul,
This is always tough. I don't think I have a single metric I rely on - it does depend on the company and the situation.
As a base line when I'm buying a stock I tend to target at least a 10% annual return, as below this I don't think there's much point in active investing -- why not just own a tracker?
For dividend-paying stocks I often look at the current yield plus dividend growth rate as an approximation of expected return/valuation.
I also use EBIT/EV (called earnings yield in Stockopedia screens) a lot, often in preference to the P/E. As a rule of thumb I think an earnings yield of 8% is cheap, 6% is attractive and anything over 2% might be acceptable, depending on the pace of growth.
Similarly with FCF yield, as I discuss in the article.
Really, though, I think that assessing whether a valuation will support further high performance is when understanding the business itself adds value, versus only looking at financial ratios.
Can the company continue doing what's worked in the past? Can it do something new that will support new periods of high performance?
Past performance is not a guide to future returns, of course. But I am a fan of the idea that history doesn't repeat, but it often rhymes.
Roland
Thank you Roland. An excellent article.
An excellent article. The comparison of operating profits, ROCE and book value as a measure of retained profits something new and helpful.
My only issue is using ROCE rather than ROE given the difficulties with leased assets. Retail businesses lease assets so these should really be part of the capital denominator and dilute numbers. There isn’t a lease adjusted figure in STOCKOPEDIA. It’s also important with ROCE to check what is driving returns, power over pricing (earnings margin) or asset turnover. I recollect a comment you made about comparing ROE to ROCE to check potential debt. These issues aside about leased data, a wonderful article. I have saved the screens. Your methodical approach also helpful on assessing RUNWAYs for companies.
It’s also important to note that the FCF figure used by Stockopedia does not have lease payments subtracted from it, and so FCF will be overstated in many cases, which will artificially inflate the FCF yield and other metrics based on it.
My only issue is using ROCE rather than ROE given the difficulties with leased assets. Retail businesses lease assets so these should really be part of the capital denominator and dilute numbers. There isn’t a lease adjusted figure in STOCKOPEDIA.
Thinking about this a bit more, is "lease adjusting" appropriate now we have IFRS 16? I read the book "Quality Shares" by Phil Oakley once where he made a case for it under the old accounting rules, but surely nowadays IFRS 16 makes much of the adjustment required to reduce the nominal ROCE for leases i.e. the increase in operating profit will not generally be proportionate to the increase in CE under IFRS 16.
What I don't like is the fact Stockopedia does not deduct lease payments from FCF. For a retailer with physical stores that's a cost of doing business that is not discretionary in the same way as paying dividends. It is effectively Capex. As such the FCF for any company using leases is overstated, hugely so in the case of Burberry (LON:BRBY) as I pointed out elsewhere this week - For FY24 Stockopedia assumes FCF of ~£300m because it does not deduct £231m of lease payments.
I realise the eyes of most people reading this thread have glazed over at this point but if you're serious about investing this stuff matters
Totally agree. It is hugely important. It is one reason I prefer ROE as a metric. I don’t have the technical knowledge to comment on the IRS issue but I did wonder if this had made the ROCE calculations more sensible. Oakley’s book is brilliant.
Totally agree. It is hugely important. It is one reason I prefer ROE as a metric. I don’t have the technical knowledge to comment on the IRS issue but I did wonder if this had made the ROCE calculations more sensible. Oakley’s book is brilliant.
I'm no accountant either, but have found the IFRS16 "Effects Analysis" brochure produced by the IFRS very helpful in understanding the changes to various financial metrics, most notably ROCE and Net Debt/EBITDA.
https://www.ifrs.org/content/d...
Very interesting and helpful article, although will need to read it several times to properly take in. I wonder if there is a way to bookmark this article so I can come back to it to re-read it....
As far as I know, you can't bookmark articles within Stockopedia. However, you can bookmark the web page in your browser, whether that's on your PC, Laptop, Phone or Tablet. That's what I tend to do and I've set up different bookmark folders for individual writers/contributors to refer back to at any time. Hope that helps.
A great article which I found very useful and am looking forward to the series. All the little bits of excellent information here from yourself and the community are helping me to become a better investor.