Didn’t buy Rolls-Royce? Why clear uptrends are the best uptrends and 20 stocks to consider now

It’s been just over a year since I published “Didn't buy Warpaint? Why clear uptrends are the best uptrends” which turned out to be one of the most popular pieces of 2025. In the article, I summarised some exciting research that private investors are well-placed to capitalise on, and offered a list of twenty stocks to consider based on the research findings.
Given the interest, I thought I’d recap the research, update you on how the 20 stock portfolio has performed, and share another twenty stocks using the same process.
Let’s go.
Quick recap on clear trends
In March 2024, a group of UK academics published a paper called Trended Momentum. It discovered something surprisingly powerful: the clearest uptrends tend to deliver the most consistent returns.
They found that when a price chart shows a smooth, steady rise - what they called high “trend clarity” - those stocks often continue to outperform. You don’t need complex models to spot them either as most people can eyeball a good trend.
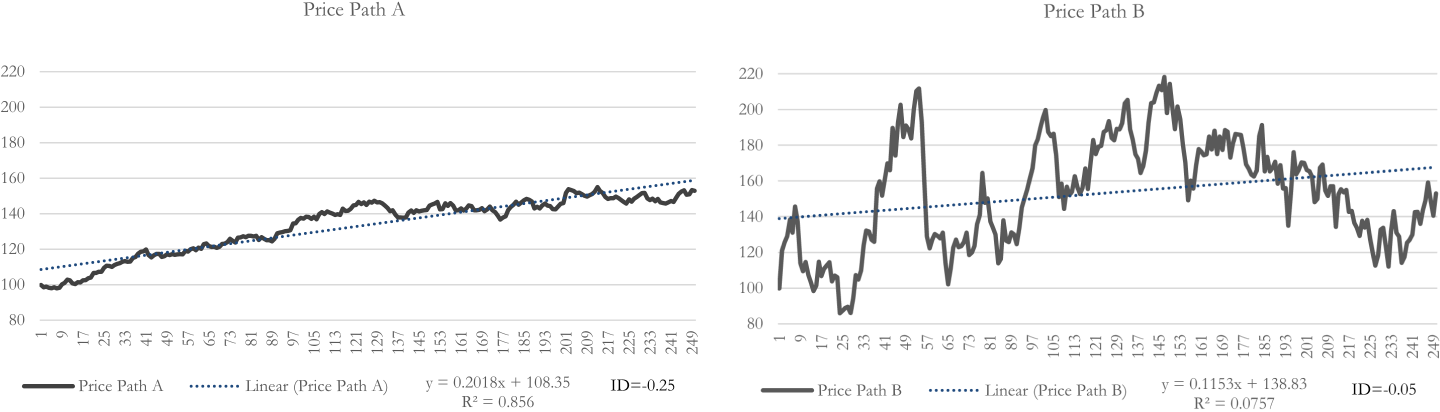
Nonetheless, the clarity of the trend can be measured using a simple statistic from a scatter plot called the R-squared, which tells you how well a straight line fits the share price path. Higher scores indicate smoother trends - and obviously Price Path A on the left is a clearer trend than Price Path B.
What’s exciting is just how effective this is: stocks with clear trends doubled the returns of normal momentum strategies in their tests. The outperformance lasted well over a year, and these stocks were also more likely to beat analyst expectations.
So last May we put together a 20 stock portfolio based on these results - let’s see how they did.
How did 2024’s “Warpaint” portfolio perform?
The May 2024 “Warpaint” portfolio delivered a strong 23.3% return over the almost 13-month period from 30th May 2024 to 23rd June 2025, significantly outperforming the FTSE All Share’s 6%. The standout performer, Serabi Gold (LON:SRB) , gained 174%, while Dewhurst (LON:DWHT) was the worst performer with a -32.5% loss.
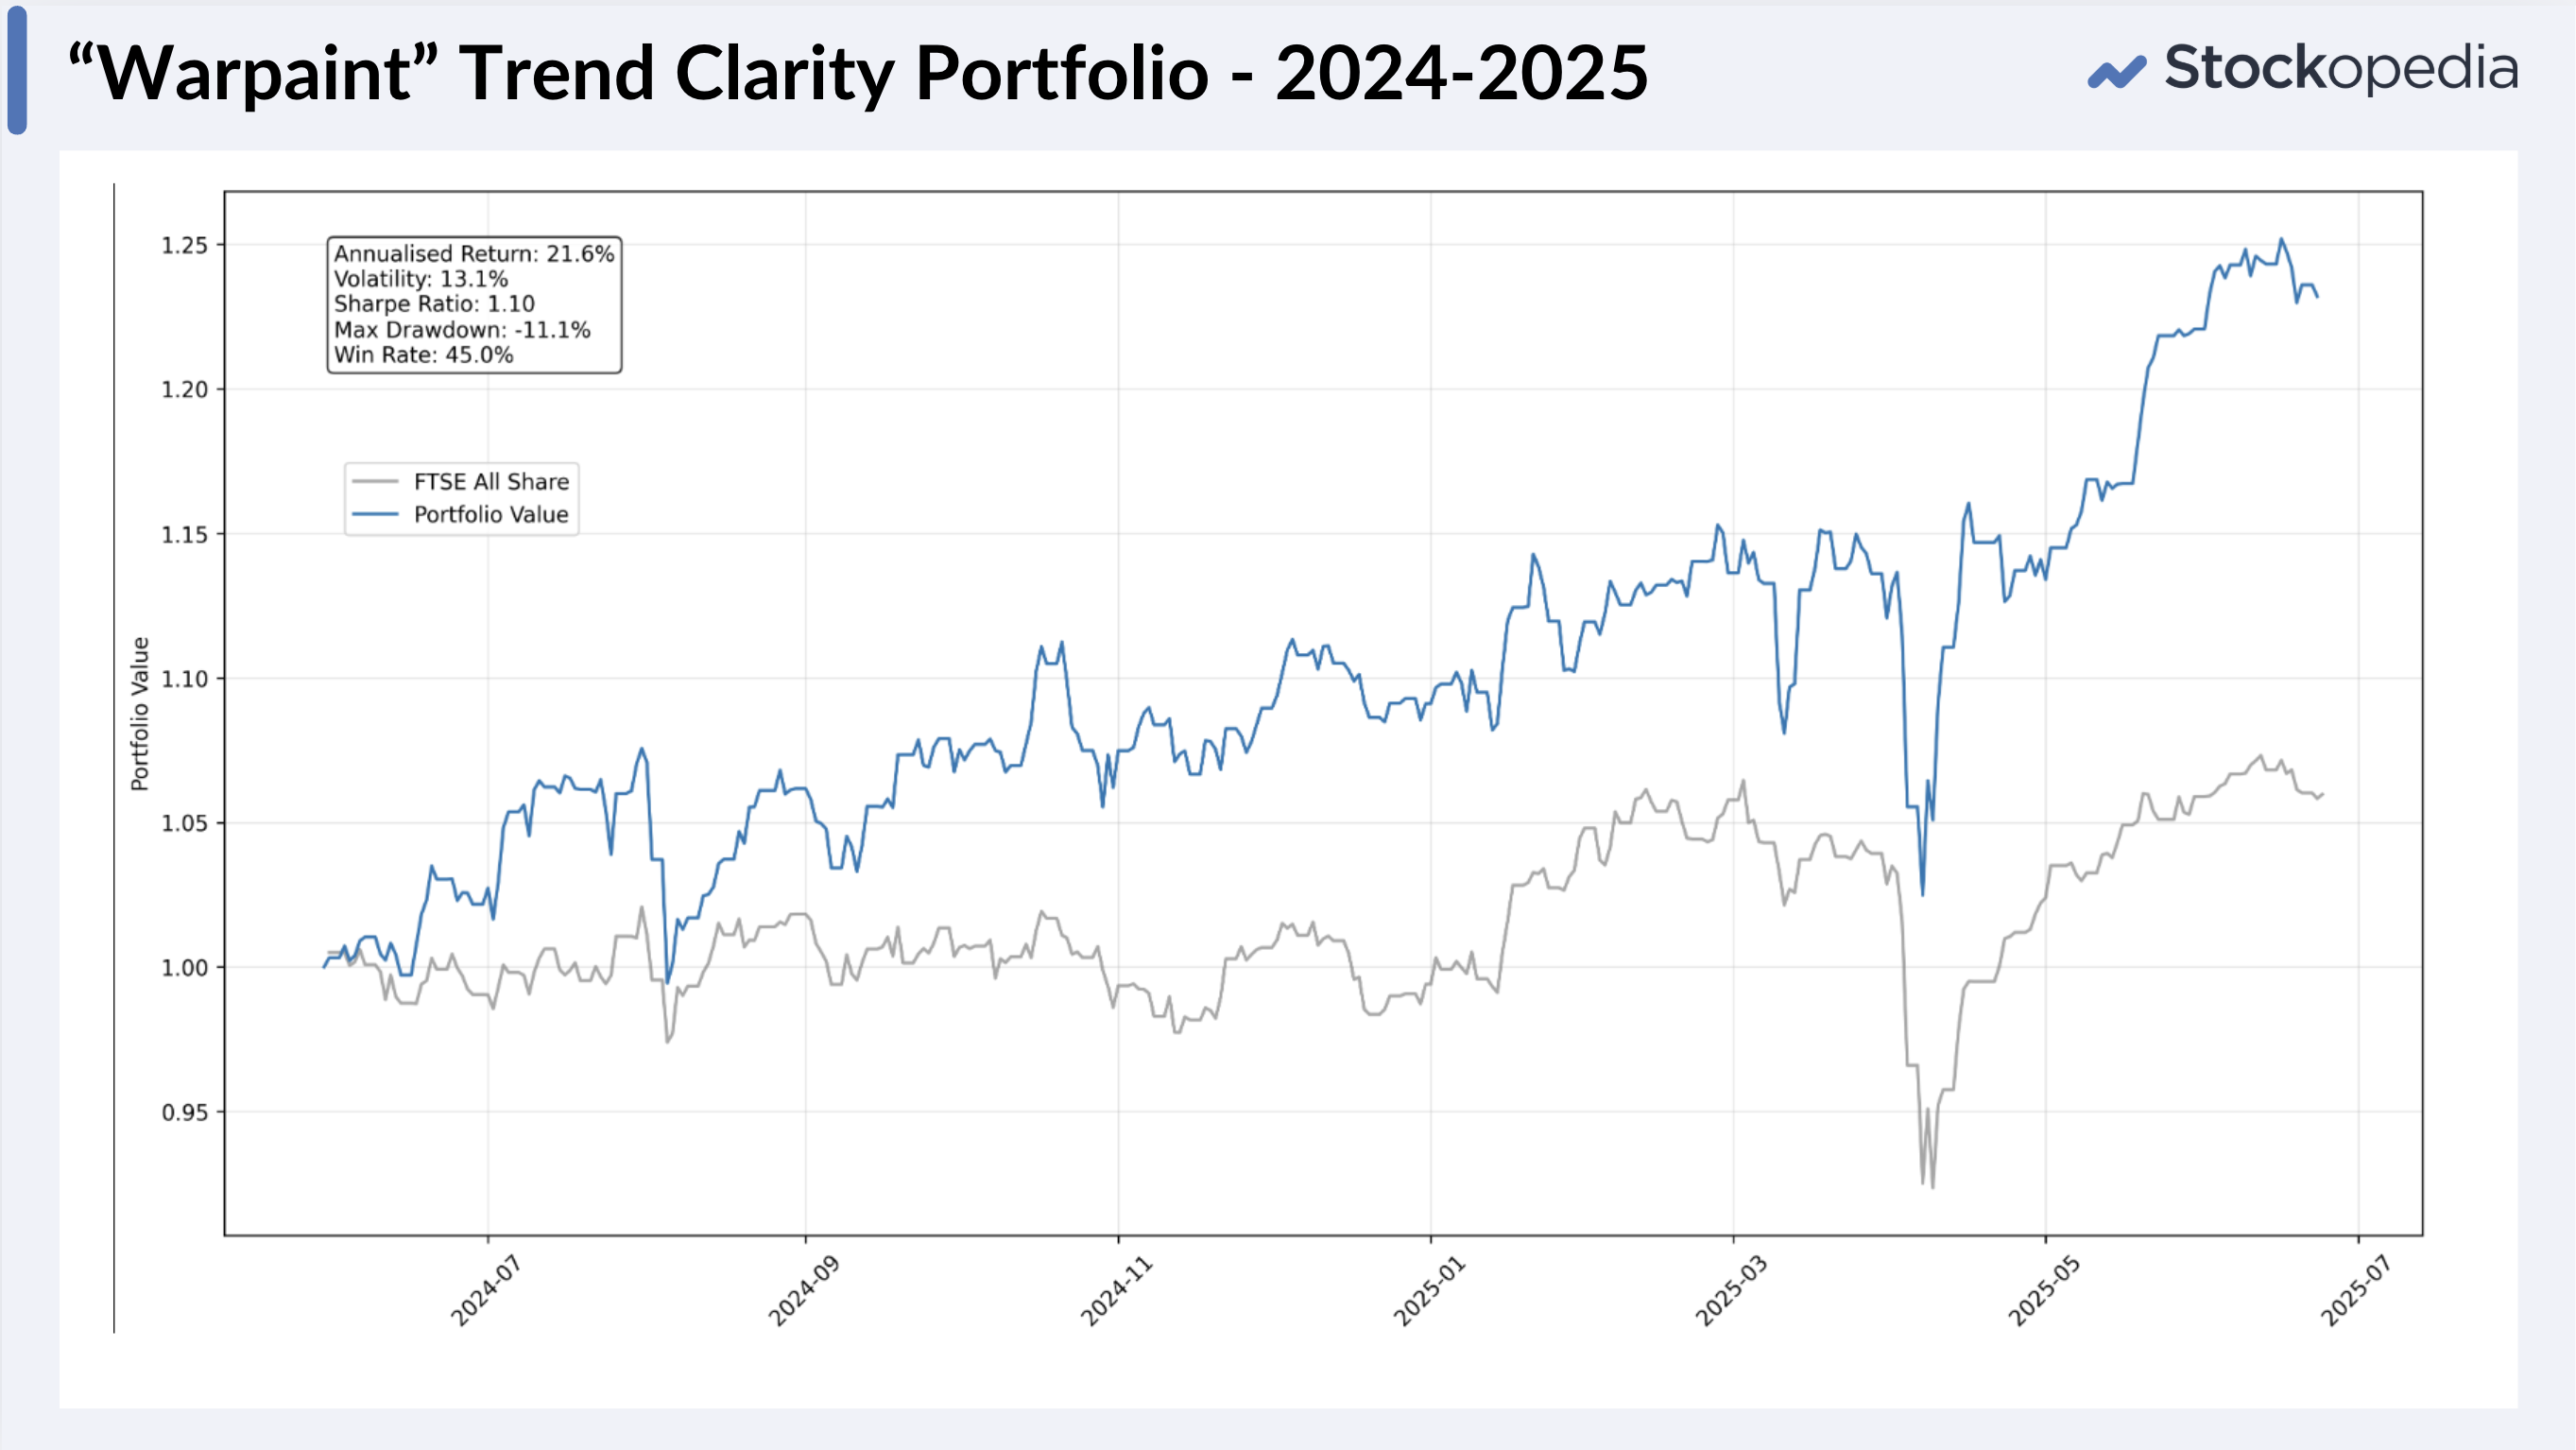
As is typical in equity portfolios, a small number of strong winners drove a large portion of the gains. Out of 20 holdings, 9 were winners, 1 sideways and 10 losers, which was a win rate of only 45%. Nonetheless, the very strong returns from Serabi, Rolls-Royce, Pan African and more drove outstanding gains.
Name |
Ticker |
Start Price |
End Price |
Price Change % |
Serabi Gold |
SRB |
66.0 |
181.0 |
174.24% |
Rolls-Royce Holdings |
RR. |
451.0 |
886.6 |
96.59% |
Pan African Resources |
PAF |
25.55 |
49.9 |
95.30% |
Plus500 |
PLUS |
2108.70 |
3396.0 |
61.05% |
Bakkavor |
BAKK |
138.5 |
217.0 |
56.68% |
Natwest |
NWG |
316.2 |
494.3 |
56.33% |
3i |
III |
2885.0 |
4022.0 |
39.41% |
Cairn Homes |
CRN |
145.6 |
181.8 |
24.86% |
Griffin Mining |
GFM |
159.5 |
173.5 |
8.78% |
RTC |
RTC |
97.5 |
97.5 |
0.00% |
Mears |
MER |
393.0 |
387.5 |
-1.40% |
Taseko Mines |
TKO |
220.0 |
205.0 |
-6.82% |
Kitwave |
KITW |
358.0 |
326.0 |
-8.94% |
CMC Markets |
CMCX |
284.0 |
249.0 |
-12.32% |
Warpaint London |
W7L |
487.0 |
425.0 |
-12.73% |
System1 |
SYS1 |
502.5 |
425.0 |
-15.42% |
MPAC |
MPAC |
503.0 |
422.5 |
-16.00% |
Clarkson |
CKN |
4085.0 |
3300.0 |
-19.22% |
Renew Holdings |
RNWH |
1064.0 |
809.0 |
-23.97% |
Dewhurst |
DWHT |
1185.0 |
800.0 |
-32.49% |
* 30th May 2024 to 23rd June 2025
When I published last year’s piece with the title “Didn't buy Warpaint?”, I knew many must have been feeling sore at missing out on Warpaint’s returns (myself included). At the time, Warpaint looked like the poster child for the “trend clarity” setup - a clear trend, strong relative strength, and a compelling growth narrative. But markets have a way of humbling even the most convincing setups. Warpaint shares have since struggled, dropping 12%.
The top Trended Momentum stocks in the UK market now
Let’s “Rolls-Royce and Repeat” as it makes the list for both last year’s portfolio and this. As a reminder we are using the following rules to generate the portfolio:
- 80-100 StockRank - always selecting from the “Green”.
- Screen for those within the top 20% of 6 month price performance.
- Calculate the trend clarity for each (Linear regression → r-squared)
- Select the top 20 by trend clarity from the set.
I’ve raised the minimum market cap to £25m for liquidity purposes.
Ticker |
Mkt Cap £m |
P/E |
Yield % |
6m Price Chg % |
StockRank |
Sector |
Rolls-Royce Holdings (LON:RR.) |
76898 |
31 |
0.66 |
58 |
80 |
Industrials |
BAE Systems (LON:BA.) |
54292 |
28 |
1.83 |
55 |
81 |
Industrials |
Aviva (LON:AV.) |
16577 |
31 |
5.77 |
34 |
81 |
Financials |
Coca Cola HBC AG (LON:CCH) |
13995 |
20 |
2.28 |
41 |
85 |
Consumer Defensives |
Fresnillo (LON:FRES) |
10390 |
108 |
1.61 |
128 |
83 |
Basic Materials |
Airtel Africa (LON:AAF) |
6411 |
36 |
2.72 |
55 |
87 |
Telecoms |
Lion Finance (LON:BGEO) |
2973 |
6 |
3.62 |
44 |
88 |
Financials |
TBC Bank (LON:TBCG) |
2496 |
7 |
5.66 |
41 |
86 |
Financials |
Bakkavor (LON:BAKK) |
1272 |
20 |
3.64 |
47 |
91 |
Consumer Defensives |
Wickes (LON:WIX) |
540 |
12 |
4.81 |
46 |
92 |
Consumer Cyclicals |
Metals Exploration (LON:MTL) |
292 |
10 |
0.00 |
87 |
93 |
Basic Materials |
Vanquis Banking (LON:VANQ) |
236 |
0.00 |
98 |
86 |
Financials |
|
Knights group (LON:KGH) |
152 |
10 |
2.57 |
61 |
89 |
Industrials |
Secure Trust Bank (LON:STB) |
145 |
6 |
4.46 |
115 |
97 |
Financials |
Altyngold (LON:ALTN) |
130 |
7 |
0.00 |
156 |
95 |
Basic Materials |
Quartix Technologies (LON:QTX) |
114 |
24 |
1.91 |
54 |
84 |
Technology |
Personal group (LON:PGH) |
89 |
16 |
5.81 |
52 |
92 |
Financials |
Naked Wines (LON:WINE) |
61 |
0.00 |
68 |
96 |
Consumer Defensives |
|
Volvere (LON:VLE) |
51 |
13 |
0.00 |
44 |
98 |
Consumer Defensives |
Virgin Wines UK (LON:VINO) |
30 |
23 |
0.00 |
76 |
99 |
Consumer Defensives |
I’m sure if you run your own numbers you may generate a different list. Sometimes the devil can be in the detail of how the rules are stacked. Some of the shares on a 1 year lookback have not such clear trends (e.g. Secure Trust Bank) - but on a 6 month lookback (which is what is used in the rules), they all trend clearly. I’ve also excluded a few dual listed stocks that would have made the cut - Thor Explorations, Endeavour Mining, and Banco Santander. So if you are dual list inclined, then act as you wish.
Here’s a screenshot of their 6 month trends using the rather fabulous mini-chart grid display feature in portfolios:
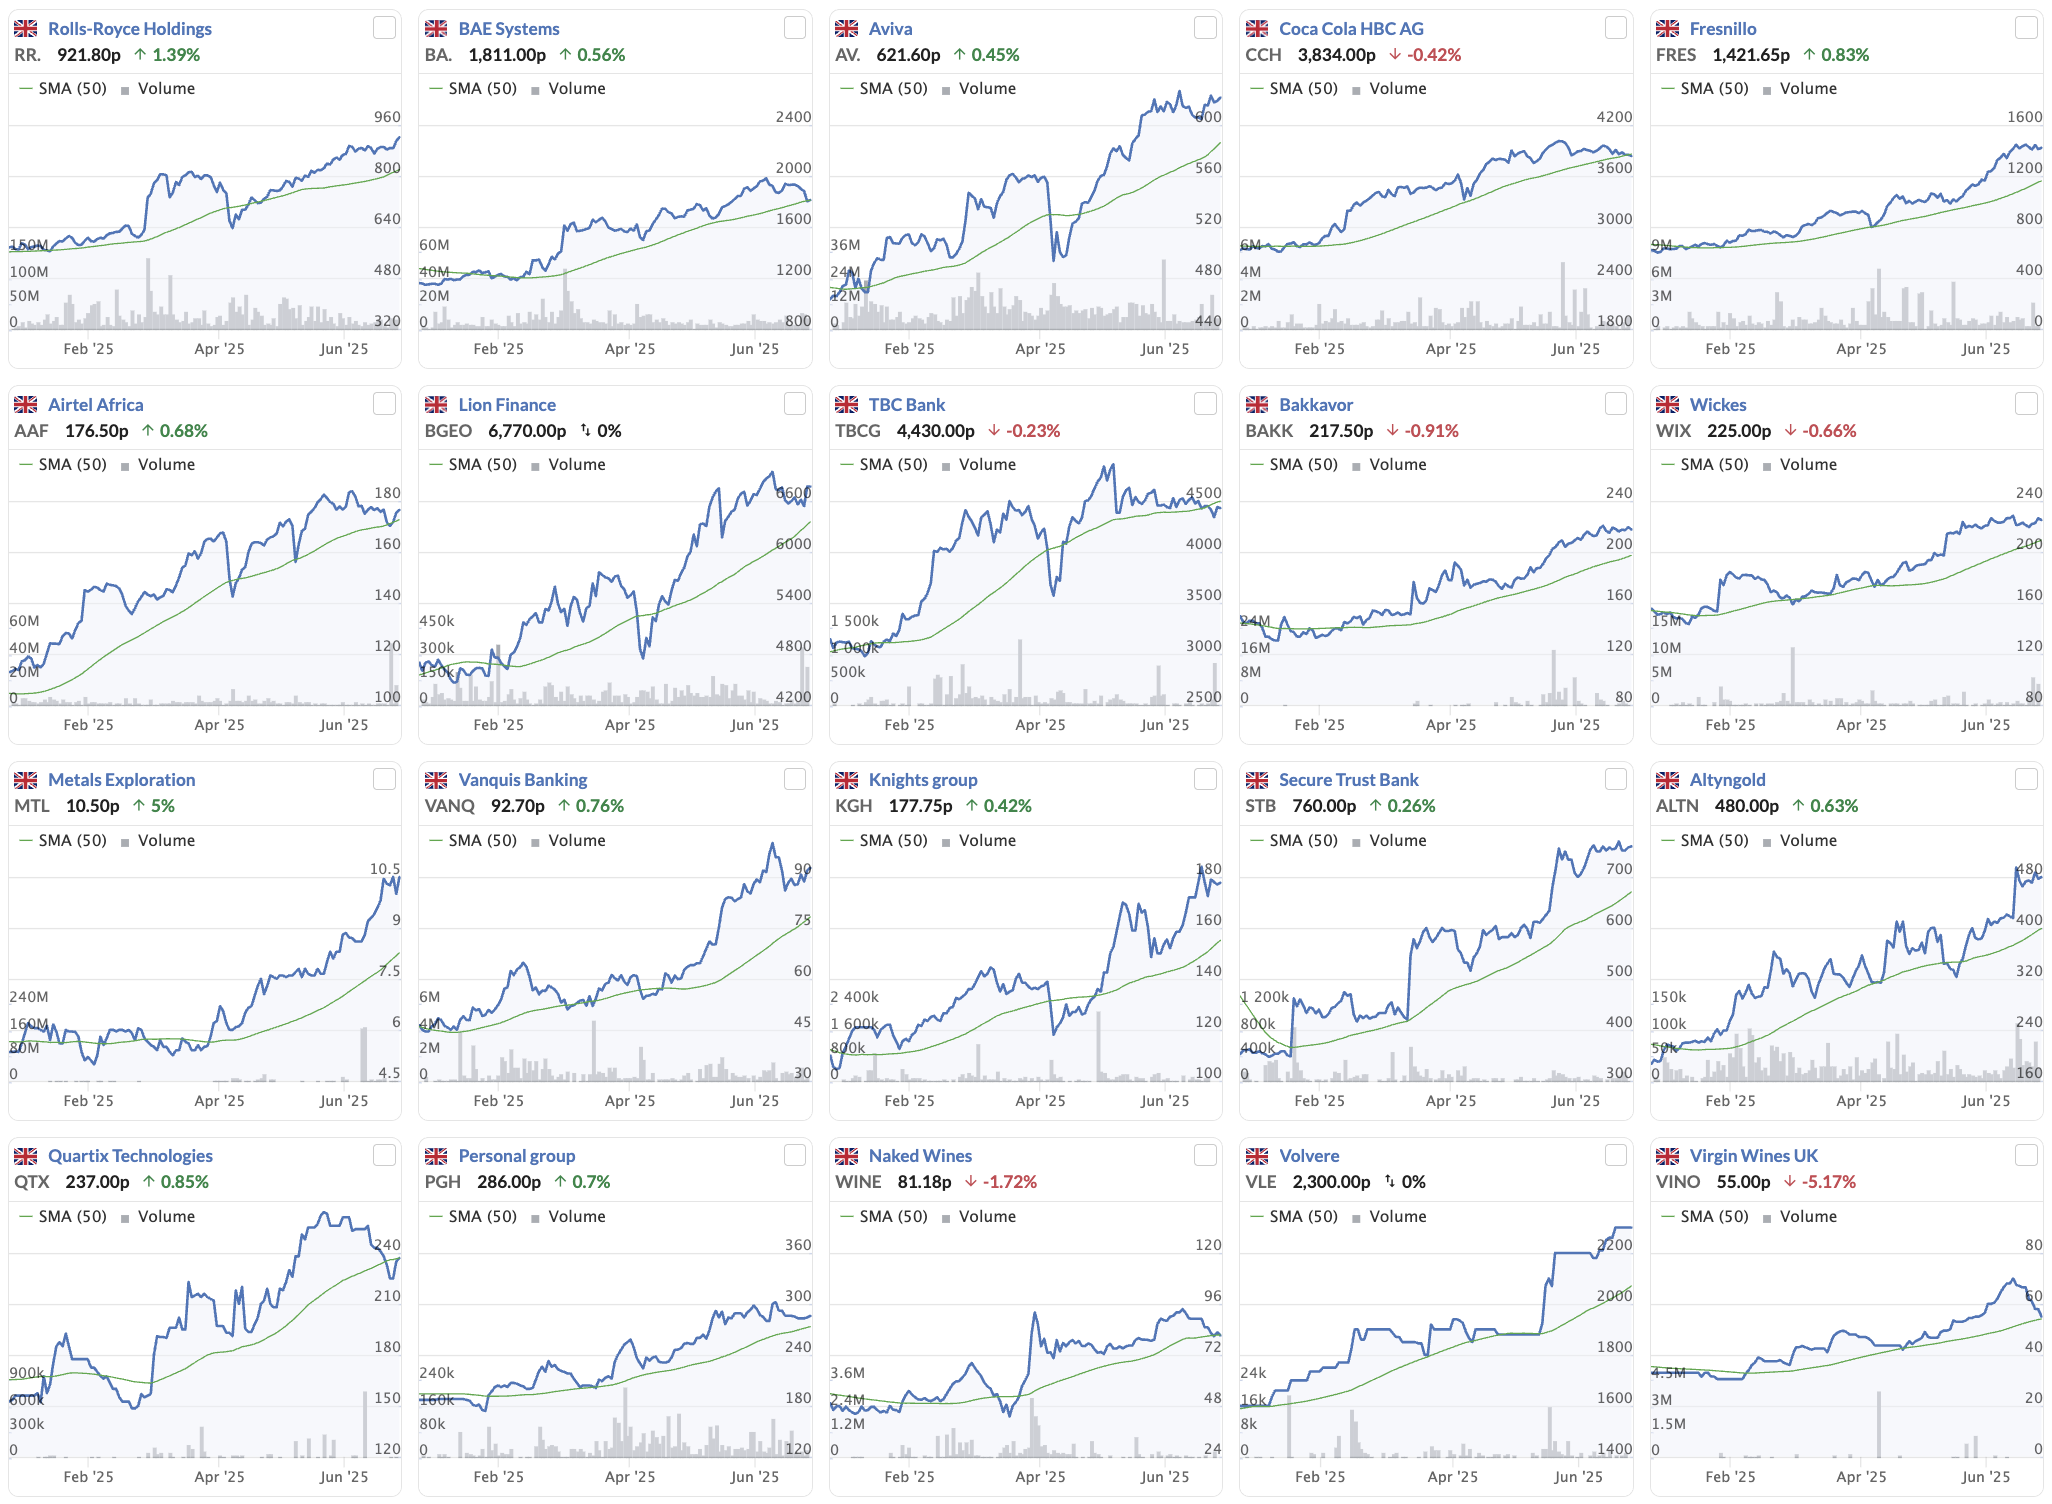
I know how you are feeling. Nobody likes buying shares at new highs. That’s the point. Everyone held back from buying Rolls-Royce last year, and now it’s another 90% higher. The psychology of only buying beaten down bargain stocks feels so much more natural than buying shares at new highs… but it’s one that’s very profitable to conquer.
Simple rules, well executed, can lead to good things in markets - but always be careful when loading towards momentum like this - as some individual names can correct sharply at times, especially in market corrections. Let's hope that titling this piece "Rolls-Royce" is not the kiss of death for its next 12-month returns - let me know your thoughts!
Disclaimer
This is not financial advice. Our content is intended to be used and must be used for information and education purposes only. Please read our disclaimer and terms and conditions to understand our obligations.
70 comments
We are now at the 1 year mark for this portfolio.
Portfolio up 28% over the year , FTSE All-Share up 18%.
A credible performance, but a bit dissapointing considering the rapid gains earlier in the year. At its high point around 26 Feb the portfolio was up 48% compared to 23% for the All-Share, so it has significantly underperformed since then.
The early outperformance and recent underperformance are fairly easy to explain. The portfolio contains a disproportionate number of oil and gold producers. Commodity prices rose strongly on war fears earlier in the year, but have since fallen back on fears that peace might break out in the Middle East. What this means for us in terms of evaluating the usefulness of this strategy for our portfolios is less clear, at least to me.
Edit. Actually looking back perhaps this portfolio doesn't contain a disproportionate number of oil and gold producers. My mistake, only 3 from the basic materials sector. So perhaps the system simply exaggerates market volatility, outperforming in a bull phase and underperforming in a bear phase.
It is because of the war in Iran. Hardly, anything in the folio, is up in the last 6 months. BAE Systems (LON:BA.) is the best but under 7%. Some of the big early winners are down. Largest risers will have more effect as they are a larger proportion of the folio.
Maybe you are thinking of this years trending folio, that is stuffed full of oil stocks, especially if you include palm oil.
It's now the 9 month mark for this portfolio so time for an update.
Over nine months the portfolio is up 32.8% while the FTSE All-Share is up 13.2%.
Over the last 3 months the portfolio is down 4.2% and the All-Share is back where it started with just a 0.04% rise.
For the last month (an interesting timeframe) the portfolio is down 14% while the All-Share is down 7.14%.
Perhaps this shows that the extra returns generated by this type of screen are in part driven by higher volatility? To be fair though the All-Share is possibly not the best benchmark as the outperformance of large caps has been notable for a while now and this has been the case in the last month's falls.
For comparison over the last month the 80-100 stockrank quintile is showing a decline of 9.81%
Tomorrow will be the six month mark for this portfolio, so with the markets now closed its time for an update.
The portfolio is showing a gain of about 38% over the six months, compared to 12% for the FTSE All Share and 6% for the top stockranks.
That's actually amazing. Thanks for the update. I need to turn these into a model portfolio!
Yes please
Blissgull, Thanks for posting your impressive 6 month results.
I have been though Ed’s >80SR/Trended Momentum June list above and noted:
1. The majority of the impressive gains are from 20% of winner stocks; namely FRES, MTL, ATLN and AAF.
2. The 20% of losers BGFO, TBC, WINE and VINO are only minimal losers.
So big winners and few losers - The ideal portfolio!
Thanks for highlighting.
It is now 3 months since Ed posted this so a little update for those who may be interested.
I set up a Stocko portfolio of the 20 shares mentioned on 25th June and it is showing a rise of about 20% compared to 5% for the All-Share. So a substantial outperformance.
One thing to bear in mind, of the 20 shares only 2 have a risk rating of Conservative, most of them are either speculative or adventurous. The higher short term rewards then might be partly for higher risk and partly an effect of higher volatility in a strong market. We have not yet seen how this strategy would hold up in a bear market.
I put Ed shares in a folio, it is up 16% by close today. Personal group (LON:PGH) getting hit recently, not sure if that just profit taking or not.
PGH are xd today (8.2p), but yes they've fallen away a little since the interims were announced.
Not sure why my portfolio is showing 20% on a 3 month basis and yours 16%. I set up the portfolio on the day Ed made this post. Either way though, a strong performance beating both the all-share and the top stock tanks, which have slightly underperformed over the last 3 months.
Not sure, l set it up on 25/06/25. I used buying prices. It up 16.5%. Down 0.88% today. I missed the top 2 Altyngold (LON:ALTN) and Fresnillo (LON:FRES) I already have Serabi Gold (LON:SRB) and Pan African Resources (LON:PAF).
Only just caught up with this set of articles. Personally I've been buying stocks in an uptrend at their recent highs as part of my strategy (high QM) using the principle that Winners Keep Winning. The way I use Stockopedia's screener to identify stocks in an uptrend is with these two rules ...
It's not as definitive as R-squared but could filter out a lot of stocks before having to download price data to build R-squared.
I hope that helps
Can I ask what resolution people are using on stock prices. real time. Daily, Weekly?
Can i ask what is hopefully not a dumb question - why continue to hold a stock that ends up 30% down? is it really a set-and-forget strategy with no sell rules other than time?
FWIW I've setup a model portfolio based on Stockrank>80, mcap>25, spread < 400bps, free float >40% excluding Reits, collective investments, real estate ops, holding companies. Allocation based on volatility (following Clenows model but sorted on R^2 like Ed's model) with a notional £100,000 in funds. Max risk works out as 10% on one stock (Phoenix group (LON:PHNX) ). See what happens over next 12 months.
Out of interest I notice a few of the companies mentioned have very low free floats, 20%-25%, do you have a cut-off point when it comes to free float? Many thanks.
I really enjoyed the article which I only spotted this morning. Yesterday I spent several hours working through 220 charts on a screen where I look for UK companies where the price is above 50DMA, 130 DMA and 200DMA. I then eyeballed the charts to try and spot the charts with a strong and smooth uptrend. In this screen I didn't have a quality screen although I do have other screens with this as a factor.
The screen did throw up a lot of interesting opportunities and some looked too high to buy. In these instances I looked to see if historically during its positive phase, had it pulled back to touch or breach its 50 DMA, which most had done. In these cases I have set up an alert for when the price does dip to 50 DMA and I can decide if the pullback is buyable or a change of direction based on adverse RNS.
I did find lots of UK banks, Natwest, Barc, etc and was wary I may get too concentrated in one sector as I also hold HSBC and Std Chartered.
This morning I ran the same screen but with quality rank and US stocks included. Some of the smoothest lines were in stocks such as Netflix, Spotify, Doordash, Ebay, Philip Morris, Hownet Aero, TKO group and in UK Fresnillo. I will do further work but I expect some of the US stocks are on lofty multiples which I find a little off-putting as a results miss can give rise to a sharp correction.
Historically I am guilty of taking profits too early and I need to find a way of assessing whether the uptrend is still intact. As always it is a work in progress, but there is clearly mileage in backing current winners.
Greyster
The Williams R indicator can help to determine the end of an uptrend i.e. when a stock drops out of over bought. Can give wrong signals though, but nevertheless worth looking at.
You can hitch a ride with momentum but without some positive changes in the underlying business to underpin and drive that momentum value will fall and the price will eventually become unsustainable.
Excellent piece of work Ed. I have started looking for similar trends, but also with NAPS method in mind. Trending NAPS you might call it. Early days, but up 16% since start of April.
Wow Lefty - that's terrific.
Ed,
Another excellent article clearly written and logically explained.
One comment I have is that of the new 20 Trend Clarity stocks few excluding Rolls-Royce Holdings (LON:RR.) are showing recent momentum. Rolls-Royce Holdings (LON:RR.) is continuing upwards with a 1M Relative Strength of 15%. Most of the others have levelled off, perhaps catching their breath before a further upward march.
By shortening the Trend Clarity calculation from 6 months to 3 months, some different stocks (and sectors) emerge which aren’t taking a breather. When using 3 Month Trend Clarity, 3 stocks in the UK Construction sector stand out:
Name
StockRank
RS 1M%
Morgan Sindall
97
15%
Costain
97
17%
Kier
80
17%
Construction industry operating margins are wafer thin, but their low valuation reflect this. Their shorter term Trend Clarity begs the question as to whether these construction companies are gently re-rating and have a high probability of future earnings surprise to the upside? My vote is Yes!
That's a good observation, and I agree re. the stocks you mention. Government spending patterns are shifting and MGNS etc are beneficiaries - similarly in the defence sector with the "5%" headline. There's a good research paper on this theme on Research Tree if you search for MGNS.
I was last night looking at the German defence stocks - which are all up on forecast PE ratios of 41-48x now (vs RR on 34)... Rheinmetall AG (ETR:RHM) , RENK AG (ETR:R3NK) and Hensoldt AG (ETR:HAG) ... so perhaps there's still some steam left in Rolls-Royce.
I noted Babcock International (LON:BAB) - another defence play (though not as pure play) - yesterday which just failed on the StockRank check for the "3 rule setup". But a 10% jump and "ahead" statement shows how much the defence earnings upgrade (and multiple expansion) cycle is ongoing.
I wish all I had done 3 years ago is put all money into BAE Systems (LON:BA.) and Saab AB (STO:SAAB B.
Europe needs to regularise on its weapon systems. Can't have its constituents doing their own thing.
See the F35 as a mistake for the UK - too reliant on software upgrades and development from the US.
What was wrong with the Typhoon.
Talk of retooling car factories to drone, weapons etc - makes sense.
Leonardo SpA (BIT:LDO) Leonardo DRS (NSQ:DRS) is my pick but just hold in an ETF.
Anyway an aircraft carrier or. two with F35 is irrelevant for obvious reasons when you have the the Trojans already ensconced.
Ed,
Can you kindly layout exactly how this screen is created in Stockopedia please?
I would like to run it myself but is difficult to follow your instructions
Thank you
It's not a screen actually - it's a metric I am calculating myself. We'll get it in the screener eventually - lots of data infrastructure work going on right now !
The way I did it last year (and again earlier this month) is to use stocko to generate a. Candidate list based on your requirements. Copy those into a spreadsheet (I use Google sheets), then use LOGEST function for calculating RSQ value.
Agree, I find this a quite frustrating article as I very much appreciate the research behind it, but it doesn't actually explain/provide links as to how to export historical/chronological share price data for multiple stocks out of a Stockopedia screen into excel in order to calculate R-squared values initially.
Create a screen then use 'copy data to clipboard" (botom right of the screen youve made) then paste into a spreadsheet
Thanks for the reply. It also seems that the excel command STOCKHISTORY can be used to pull up daily/weekly/monthly closing prices for any stock over a period of time if the stock name, period start date and period end date are entered in 3 different cells. Then the command RSQ can be used to calculate the R squared value. Apologies if I'm trying to teach granny to suck eggs.
I use google sheets and google finance to get historical and live(ish) data. Very useful
Likewise. I use LOGEST function for the regression calculations but don't have any else to check the results against. Do you use it?
No. I did a 'tutorial' on how to calc R^2 on a post last year if you can find it
I used Google sheets and Gemini (Ai) to write code - i wouldn't call myself a techie but managed it in a couple of hours and got a similar result to above.
Thanks Ed. Looking for smooth uptrends was a top tip for me. I hold or have banked many of the stocks mentioned for multiple gains but can't help fearing that some have run out of steam. This in no small part due to my perhaps crude interpretation of the SO data. Lion Finance has a price target of only 0.21% above current for instance yet rates 84 for Value which for a novice is hard to reconcile? Should I therefore add the most weight to the Value rank and assume that the quoted target price is just an average of broker ratings?
I can only comment generally. I personally put no value on analyst price targets, because high StockRank shares generally have the smallest price target difference, and low rank stocks the highest.
The below charts are from more than 10 year averages of point in time data.
We've been banging the drum on this stuff for more than a decade... and it all still works. No matter how much one points out how markets behave, they don't seem to change. In the UK it's still terribly dominated by active managers, and active managers are advised by brokers, who tend to promote high-beta stocks - as they are more likely to double. So the same anomalies and behaviours repeat themselves again and again.
Many thanks and your mini chart grid display is indeed the most fabulous way to quickly monitor a large number of stocks :)
I'm surprised a film hasn't been made of his life. Made and lost a fortune several times over. Guess the pressure got to him in the end
It's worth noting that Bakkavor is the subject of an agreed cash and shares bid from Greencore. GNC has a high Stockrank and good momentum, but anyone investing in Bakkavor is at least partially investing in GNC.
For the duration of the Warpaint portfolio and before I've been holding Serabi, Rolls-Royce, Pan African, Plus500, and CMC Markets and none of the rest, was glad of your confidence booster Ed! But I did sell most of the Pan African in order to buy more Serabi, then when I had some more cash I added back some more shares to the Pan African. Making an adjustment along the way may do no harm! Obviously I'm staying with the first four mentioned above while Aviva is my pick of your latest bunch.
"I know how you are feeling. Nobody likes buying shares at new highs. That’s the point. Everyone held back from buying Rolls-Royce last year, and now it’s another 90% higher "
What I don't understand about this is that if no one likes buying shares at new highs, and everyone holds back, how come the shares keep rising?
DoctorDave – it’s essentially a case of anchoring and adjustment. Investors are anchored to lower historical prices, so when a share hits new highs, there’s a reluctance to buy – a kind of demand suppression.
But that demand isn’t lost – it just lags. Over time, investors recalibrate, new information spreads, and the market becomes more comfortable paying up for quality.
In theory, shares should reprice much faster than they do – but behavioural inertia delays the adjustment and trends begin (or continue!).
Ah! Received and absorbed. Thanks Ed.
That's interesting Ed. I ran a screen and set up a dummy portfolio last December and checked the results last month. Most prices had just gone sideways, which I assumed was because the momentum/trend had gone and the system failed. So then started looking into 3 month RSQ and shorter holding periods, so I can capture a shorter trend. Performance improved but not to the same standard as you, Paul and Rusty (only about 14%). But I may just have been too quick to assess and should hold longer. Time will tell.
Does Stocko have a field we can use to search for trend clarity giving the R squared from the best fit trend line? If not, what is the closest available searchable field?
Stockopedia does not calculate R-squared at present, as far as I know. But Stockopedia does calculate volatility and auto-correlation. I suspect that a low volatility value or a high auto-correlation value could be used instead of R-squared to select stocks displaying high trend clarity. Perhaps Ed could comment on this.
Ed could you post to a link to the actual screen please?
The portfolio I ran after the original article returned 40% but I had sell rules (go below 100MA), ending up with 4 stocks today. I think it's a great system!
Very interesting - did you just keep the sale proceeds in cash, but still return 40%?
No. I kept buying stocks but havent done anything since end of March (it's only a dummy account) but I did do it religiously once a week. I'd be happy with 20% to be honest. Apologies I started it 03/04 before the article,but same principles, that's why I ended in March, wanted to try it for a year or so
I did a top trending folio, last year, but excluded the stocks with volatile charts, it is up 45% over the last year. Warpaint London (LON:W7L) is the worst performer -25%. Best is Serabi Gold (LON:SRB) +159%. Only 3 losers out of 20.
Do share the list Rusty
https://www.stockopedia.com/po...
Rusty - the link gives a 404 error - probably due to permissions.
Was not sure it would work, maybe Ed can see it?
I'm getting a number of Error 404's on Stocko pages, I wonder if it's a conflict between Chrome and Outlook.
Can't open Rusty. Sad face.
Not sure what you mean by excluding volatile charts. The clear trend filter excludes volatile charts. Also did you use the last 6 months, or the last 12 months or another formation period.
I picked the smoothest looking charts, over the previous 6 months, so excluded Dewhurst (LON:DWHA)
Here is the my folio with gain/losses:
Serabi Gold (LON:SRB) +159%
Alumasc (LON:ALU) +100%
Rolls-Royce Holdings (LON:RR.) +93%
FD Technologies (LON:FDP) +73%
Pan African Resources (LON:PAF) +71%
Synectics (LON:SNX) +69%
Morgan Sindall (LON:MGNS) +68%
Time Finance (LON:TIME) +67%
Natwest (LON:NWG) +61%
Greencore (LON:GNC) +35%
Cairn Homes (LON:CRN) +34%
ME International (LON:MEGP) +29%
3i (LON:III) +29%
Norcros (LON:NXR) +22%
Marks and Spencer (LON:MKS) +20%
Premier Foods (LON:PFD) +19%
Tatton Asset Management (LON:TAM) +3%
Bloomsbury Publishing (LON:BMY) -17%
System1 (LON:SYS1) -19%
Warpaint London (LON:W7L) -25%
Hi Rusty - firstly very well done - a cracking result.
Did you allocate investments equally across the companies?
This is a watchlist, I don't own all these stocks, unfortunately, but l do or did own a fair number. Yes it is equal investment on each stock.
Sorry, misread. Thanks
Well done Rusty, you certainly were on the right track. The thing is, setting up a virtual portfolio is from scratch so there is no problem as with a real portfolio. For instance, I did a Contrarian thing on the 14th of December when I could see there wasn't going to be a Santa Rally so made up Santa's Slumpers, 21 companies of the most pessimistic of all. As it stands now it has turned 21 grand into 27 grand, with VAST leading with a 428% gain. No way would I have slung all our holdings into the melting pot and invested all in those 21 picks!
Yes it was just a new strategy, surprised it worked so well. I did hold most of them.
What would be the sell rules? Or is it simply buy and hold for a year?
Most "momentum" strategies tend to use 6m to 18m holding periods - but I've read in several papers that 8 months is often the sweet spot. I haven't done any optimisation on the holding period for this strategy. - but you can see that the returns for the Warpaint set were skewed towards the last few months. Obviously there's a holding period and transaction cost trade off too - shorter timeframes have higher transaction costs.
The assumption in the article was that all the shares were bought and held for 13 months from publishing date to now. I was a little slow in doing the review.
Hi Ed,
Would you care to comment on the trigger point for the holding period?
Are you thinking of the start of the re-rating or something else?
Thx in advance
Barney - I'm not sure I fully understand the question - can you rephrase?
Hi Ed, thanks again for another great article. I was lucky enough to hold Warpaint from mid 2023 and exited earlier this year when the StockRank dropped below 70—trying to surf the StockRanks as you’ve previously discussed.
On the topic of holding periods: I assume your reference is based on a lump-sum purchase at the start. But I’m curious—do you think momentum strategies still hold up if you’re investing regularly (e.g monthly), rather than all in one go? Do you think that affects the ‘optimal’ holding period, or whether the momentum effect gets diluted with staged entry?