Don’t Panic! Opportunities emerge in the 2022 market crash

It’s rough out there. The long anticipated bear market is at last upon us. In the UK, the FTSE All Share has fallen 10% in the year to date, while AIM - where stock pickers like to congregate - has fared even worse. In the US, the S&P 500 - a long-time haven for passive investors - is down more than a fifth.
We shouldn’t be surprised. Global markets have been propped up by excess liquidity for years and now that froth is draining away, there are few places to hide. Not even the bond market can provide a safe haven . At the end of September yields on 10-year government bonds rose to match those of many high-yielding funds. That means loans to the government are currently considered to be as risky as equity investments. Interest rate hikes - an emergency measure to help the economy deal with spiralling inflation - hasn’t helped the problem, contributing to massive stock market outflows as investors have sought the perceived safety (and rising returns) of cash in the bank.

And so investors are fearfully recalling the last time a liquidity crisis of this scale threatened to tumble global markets. It was the turn of the millennium and money that had pumped up tech stocks was being withdrawn fast. Then, the FTSE 100 fell from a peak of 6930 points to a trough of 3492 points over a span of three years.
This too shall pass
How long the sell-off will last and how deep it will go is a topic that Ed has been exploring. His first analysis into private investors’ favourite market, the AIM All Share, is slightly depressing. If previous drawdowns are anything to go by, the current crash has someway further to go before we hit the true market bottom.
Examining the FTSE 100 since its foundation in 1984 presents similarly worrying statistics. Market drawdowns (from peak to trough) have varied from 9 weeks (the Covid-19 sell-off of 2020) to 166 weeks (during the dotcom bust).
So, for argument's sake, let’s say we’re roughly half-way through this drawdown. Examining the performance of the FTSE 100 at similar points during each of the previous major drawdowns should provide some comfort. At not one point has the market failed to recover its peak within five years. The following chart shows the performance of the FTSE 100 halfway through each of the previous major drawdowns.
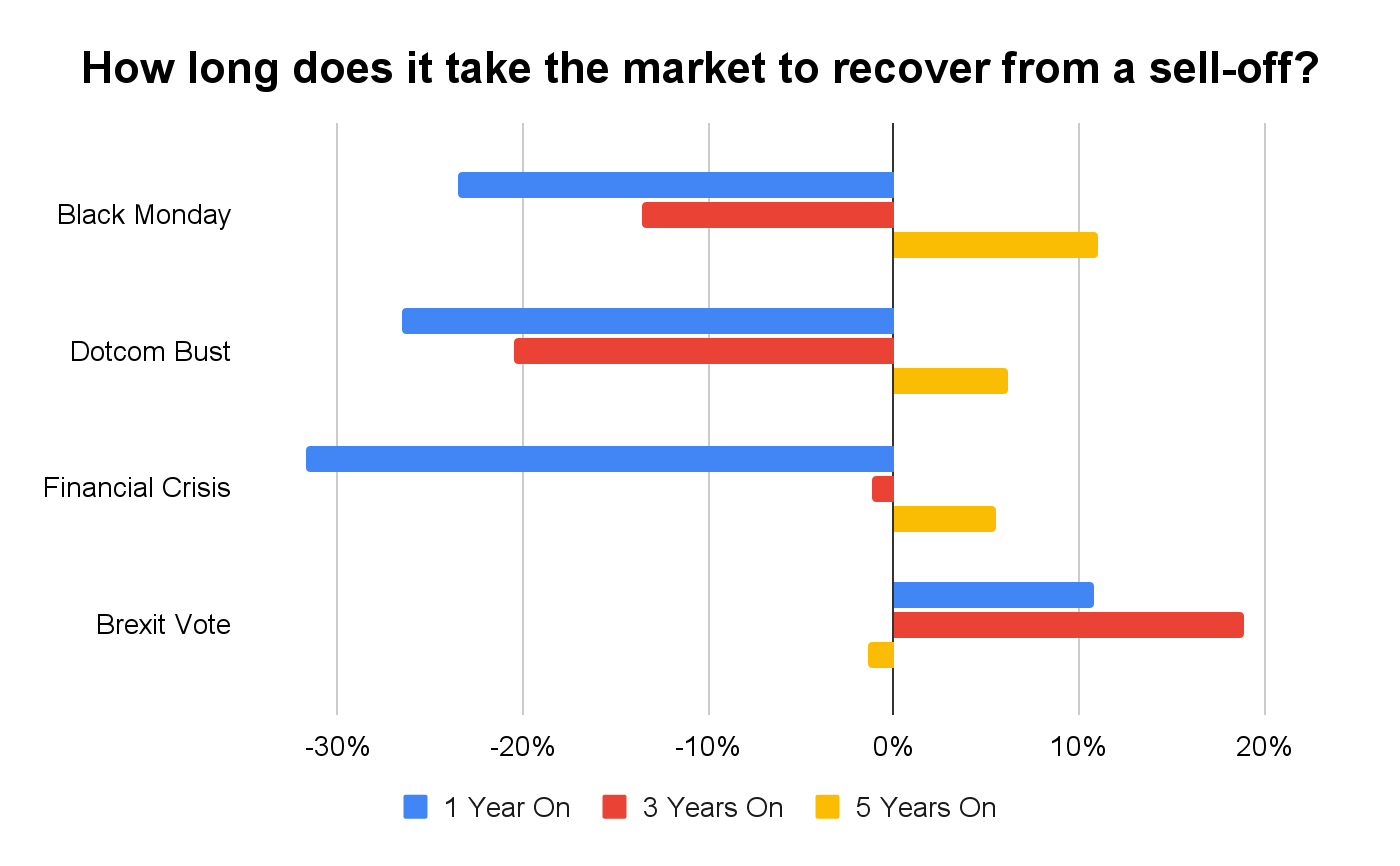
Of course, we can’t guarantee that this crash will be the same. Low interest rates and deflation provided the economic backdrop during all previous busts - this time is different. But if we are to assume that history will repeat itself, we should be reassured that things will get better.
Still, believing that the market will recover doesn’t make the current turbulence any less challenging. Decisions made in the coming weeks and months could make a material difference to your long term wealth.
The following sections aim to help you understand market behaviour and how you can prepare your portfolio.
Process can help you manage your emotions in a downturn
When your portfolio is spiralling down and your emotions run wild, it’s easy to make the wrong decisions. But the good news is that markets tend to follow a similar pattern, even during turbulence. Thus, setting yourself rules before you hit the panic phase of a market downturn can help.

These rules include portfolio management. Not checking the sea of red is a discipline which is far easier said than done, but it can help you from making rash decisions when things are going wrong. Most platforms allow you to set stop losses and sell triggers if your technical analysis suggests that there may come a point that your shares are only going down. But, by definition selling during a downturn is a sure way of crystallising losses. Watching a share price fall is painful, but remember, you have only lost money once you have sold your shares.
Beyond portfolio structure management. Rules based investing (using quants or factors) has a long history of success in both bull and bear markets. Applying the right factors at the right times can help shelter your portfolio from the worst of a downturn.
For example, trend-following or momentum investing has “a defensive bias” meaning it tends to outperform during periods of general market weakness. When volatility is particularly high (as it is right now), the strongest performing shares are those with low beta, low risk and large market capitalisations. By contrast, value stocks are major underperformers. With large amounts of fixed capital, quick decision making is difficult for many of these companies, making them slow to respond to economic changes.
These trends are found regularly throughout the financial literature and are currently reflected in our own StockRanks. The chart below shows the top 20 stocks in the UK for each of the Quality, Value, Momentum and Growth Ranks. The high ranked Momentum and Quality stocks have outperformed an equally weighted FTSE All Share in the year to date, while Value and high risk Growth have underperformed.

We expect these trends to continue amid current market turbulence, especially among value stocks where the high volumes of debt are adding to the concerns. Interest rates are likely to keep heading higher in the UK, perhaps adding to value stocks’ finance costs in the months to come. Meanwhile, exposure to high ranked Momentum stocks could shelter your portfolio from the worst of the sell off.
Prepare for the recovery
The one silver lining during the pain of a market crash is that the point of maximum financial gain is soon to come. Warren Buffett sums this up well:
“If you expect to be a net saver during the next 5 years, should you hope for a higher or lower stock market during that period? Many investors get this one wrong. Even though they are going to be net buyers of stocks for many years to come, they are elated when stock prices rise and depressed when they fall. This reaction makes no sense. Only those who will be sellers of equities in the near future should be happy at seeing stocks rise. Prospective purchasers should much prefer sinking prices.”
Again, factors can be used to expose your portfolio for the right stocks. For example, value strategies have a strong cyclical bias, tending to outperform during Bull markets and particularly in the aftermaths of market crises. By contrast, equity momentum should be expected to suffer significantly during recoveries.
The literature offers plenty of evidence and explanation for this phenomenon as well. In a study of the US market between 1927 and 2013, researchers found that the two worst performing months for a momentum strategy (which buys the top decile of past 12-month winners and shorts the bottom decile of losers) were July and August of 1932 - the months immediately following the Wall Street Crash. Similar results were found from March to May of 2009 in the wake of the 2008 Financial Crisis. The S&P 500 rose 30%, the researchers’ past-loser decile rose by 163%, but the decile portfolio of past winners gained only 8%.
There are many technical explanations for this evidence, based around market beta and volatility. But, put simply, momentum performs badly because it has held up the best during the period of downturn. By contrast, the stocks that have fallen the furthest (value stocks) will enjoy the steepest climbs.
Getting the timing right
The problem with this knowledge is that timing makes a significant difference to strong and weak performance. Over exposure to value stocks too early can see your portfolio crash hardest at the bottom of the cycle, but hang onto your momentum strategy for too long and you’ll miss out on the biggest gains.
Mistiming the market can be hugely costly, as research by Schroders found in 2018. Investing £1,000 in the FTSE 250 in 1987 and leaving it for 30 years would have seen the pot grow to £24,686. But trading in and out of the market and missing out on the index’s best 30 days would have left you with just £6,878.
So where are we now?
Without a crystal ball it is almost impossible to time the market to perfection, but we can make some sensible assumptions based on the current situation:
- Excess liquidity has carried the global equity markets to record highs without being backed up by underlying fundamentals
- Western economies have started to tank dragging down the value of their currencies compared to the US dollar
- Inflation is rising and central banks are stepping in to try and curb this by setting interest rates higher
- The flight to safe assets is being compounded by rising interest rates
- The liquidity which has kept the market buoyant for so long is being drained out of the market fast
All these points come together to suggest that the pain is nowhere near over and investors are likely to continue to have to deal with big losses. Just remember, when it’s all over the rewards for sensible portfolio management will be big.
Want more? Our resources can help you manage the current crisis better
Improve your understanding of current market conditions
The FTSE isn't as strong as you think and you aren't doing as badly by Ed Croft
Where to invest as the pound hits an all time low by Megan Boxall
Which sectors and themes are resisting the best in 2022 by Edmund Shing
How to navigate another Winter of Discontent by Alex Namaani
Lessons from history and how to hunt for value in a sell-off by Ben Hobson
Manage your portfolio in a downturn with these tools
Reviewing your folio diversification
Tools to help you pick stocks during a downturn and subsequent recovery
Building a Custom Screen: Use our screener to find momentum opportunities
Learn from the Gurus: Market experts have identified many momentum and value opportunities which you can copy here
Apply StockRanks: Our unique system will make it easy for you to pick stocks with high exposure to the factors you are looking for
Disclaimer
This is not financial advice. Our content is intended to be used and must be used for information and education purposes only. Please read our disclaimer and terms and conditions to understand our obligations.
26 comments
How can the markets stabilise.Strong stable govt ,recipe for growth not liquidity injected through QE.Which sectors can play a pivotal role in lifting the economy.The housing sector no, building materials no, financials no too much liquidity already exists in the system.,The equilibrium has been disrupted (covid,QE,QT,Lowering taxes without thinking how the govt will meet its obligations).How can it be restored,Naturally will take forever, can we rely on the new govt for policies No.What policies do we need ?
Can we move the discussion of best and worst days in the market to a practical level ?
Most of us have been active in a few.
My experience of the worst days is:
1. One does not know it is the worst day until it is over.
2. One picks up some unbelievable bargains
3. One is suffering on other holdings
The worst day is seldom a surprise and in the days preceding it I have been making a jab at finding bargains. They turn out not to be so cheap when the worst day comes.
4. Sentiment will be against some sectors.
Look at Oil in the Covid crisis. Everyone was talking about Contango in the futures market and the collapse in demand. I bought some SHEL at 15 pounds and had to watch it fall to 9.50.
5. I have found it impossible to turn over an entire portfolio in one day.
Maybe it is the size, maybe it is my method.
Like most of you I have an investment portfolio which is fully invested and a trading portfolio which may be mostly cash.
So at the end of the worst day I am exhilarated by the number of trades made but in terms of overall performance not much will have changed.
Only over the longer term do the winners reveal themselves and even then one has to hold on to them.
Sometimes I buy so cheap, see them double, sell but they keep going exponentially.
Of the best days I have less to say except that
1. One does not know either.
Of course there are indicators, the media tell us, price stretching away from MAs and RSI.
2. One does not want to sell.
If a share i hold doubles i sell half and set out to hold the other half forever as aware that most multi-baggers along the way will fall at least 50% which unless one has a hold forever altitude will likely shake one out.
Megan, This is a very interesting piece. But I cannot agree with your assertion that "You have only lost money once you have sold your shares." I believe that if your shares are currently worth less than you paid for them, then sadly this is a REAL loss. The difficult choice that an investor faces in this position, is whether or not to crystalize the loss. If you believe that the shares will go down from here then, the rational decision is to sell your shares, which obviously crystalizes the loss. It is very uncomfortable to crystalize a loss, and I find that I can only do it because I believe that it will avoid an even larger loss in the future. I do it to protect my capital. But it only works if you sell relatively early in the market downturn. If you believe the shares will go up from here, then the rational decision is to hold them, which obviously does not crystalize the loss.
This strategy may well be closer to short term trading, rather than long term investment. But if one has a good process, and a good understanding of what the market trends are, then it can work fairly well. It's not great to crystalize losses, but it's better than watching what some might call "paper losses" growing bigger day by day.
Depends on if you bought the business or you're buying the market. I buy the business, so unless my business is in a long term decline, not a market price decline, I accumulate while others sell. To make the market work for me, I have my own valuation of my businesses and if the market is willing to sell me portions of my business for less than my valuation, I accumulate. This is for me, a buyers market and while it is, I will continue to buy. Different for traders, and I am not a trader as I enjoy studying businesses, not markets.
Mark B I also am very selective about which shares I buy. I don't buy anything without spending about three hours on analyzing the company. As part of this analysis, I calculate what I think the shares will be worth in 12 months. I am not buying the market, but I am paying quite a lot of attention to what the market is doing. I would describe your approach as buy good companies when cheap, and wait for the market to become more optimistic. Our approaches are different, But Both approaches can work well.
I think the shortest amount of time I have ever spent on researching a company was 3 days :-) I typically spend several weeks finding out everything I can about a company before buying it. Yes, we are very different.
This is for me, a buyers market and while it is, I will continue to buy.
Snap.
"Accumulate" is also the phrase I'd use. Buying monthly, pound cost averaging across relatively long periods of time, allows me to avoid the nagging annoyance of buyer's regret - buy today and see the price drop tomorrow. I want the price to drop so I can buy more in future.
Having been doing this for nearly four decades this is where I generate long term returns when the market recovers. As an investor it's "obvious" - I can now pick up shares in quality companies at 30%+ discounts to where they were trading a year ago. If I intend to hold for five years or more buying now makes much more sense than buying then.
"LTBH" generally has a bad name because, obviously, if that's what you do you'll end up with stupid results where you hold a failing business through to collapse. Although, of course, you'll also hold businesses that recover and do incredibly well. However, managing the process with discipline - buying companies with the appropriate quality metrics, relatively low debt, etc, and doing so only when the valuations make sense (which for these companies is nearly always in a bear market) can generate some very decent long term returns, with relatively little psychological disturbance.
The other thing I'd note is that the cashflow into my porfolio at the moment is very significant. Few dividends have been cut (as yet) and we're seeing good companies taken out - EMIS (LON:EMIS) and AVEVA (LON:AVV) in recent weeks. It's quite an odd market and the UK looks particularly cheap.
timarr
Thanks for an excellent post. I especially liked the 'Nowhere to Hide - Every Sector has Underperformed...' plot. Could I ask the source of this data? e.g. it shows the Energy Sector underperforming, while most energy stocks are significantly up on the calendar year.
they haven't and you can
Tobacco is the biggest outperformer +20% YTD British American Tobacco (LON:BATS) £IMB though big oil is doing well exp Shell (LON:SHEL) BP (LON:BP.) - sector is up +4.5% YTD
Every other sector is negative though many are outerperforming on a relative basis
Here's a simplified sector plot YTD (median price)
here's a more detailed one
and here's an insanely cluttered one but you can see the outperformers : on a YTD basis (Y Axis) they are all oilers
Though this is a plot of all 361 share in the green YTD by sector
This is not a passive , index-following type market, it's a very active investing/trading market .
To paraphrase Keynes: when the market conditions change, change your style (or look away for a long, long time)
https://twitter.com/runningpro...
"Mistiming the market can be hugely costly, as research by Schroders found in 2018. Investing £1,000 in the FTSE 250 in 1987 and leaving it for 30 years would have seen the pot grow to £24,686. But trading in and out of the market and missing out on the index’s best 30 days would have left you with just £6,878."
For balance, is there data for the counter metric to that? Missing the worst 30 days in the market?
The best days for returns often follow the worst days of returns as sentiment tends to be mean reverting and capitulation selling is a herding thing: Buffett's fearful-greedy maxim is trickier in reality if some of the blood on those streets is yours,
Take last Thursday's mass sell-off: 29 Sep 22 and then the corresponding big bounce
Here's a spike down in All-Time Highs minus Lows (market breadth) for total LSE - 1830 stocks : that is a lot of pain which is followed by a big updays- see Friday .
Here's a coresponding metric for how deeply sold the various indices got : these are percentages above the various moving averages from relatively short term (8EMA) to long term (200MA): a proxy for staring at a lot of charts.
On the left is the short term , the long term on the right - the FTSE250 (UK plc) fell off a cliff last week with just 3% of shares above both the 8 and 21EMAs: that is fairly extraordinary and suggests there was very little left to sell!
Wind forward a week and here's the same plot, again looking at the FTSE250,the number of names above the 8 EMA has risen from 3% to 44% while the 21 EMA went from 3% to 28%. This is Mr Market at his most psychotic, though expressed in numbers and not Ben Graham's narrative (100 years makes no difference in human behaviour: there are still only two forces driving markets - fear and greed)
This does of course support the "missing the best days thesis" though it relies on participating in the worst days counterargument.
It also supports the notion of watching the technicals, understanding the deeply oversold nature of the market and seizing this opportunity to be a selective buyer : the essence of market timing . This is also much easier in hindsight (as is most technical analysis!) however, the above deterioration in technicals wasn't an event, it was/is a process and there were/are ample opportunities to position and profit from these moves (i.e what traders do) . My suggestion is that investors should increasingly be aware of , and using some of the data-driven powerful tools that better INFORM market timing - at least from a loss avoidance/capital preservation stance.
This grim plot shows what buy and hold forever looks like YTD
Being in cash in bear markets on a backdrop of rising interest rates is also a good route for outperformance: it's fairly passive alpha! Ray Dalio recently reverting his long term view that cash is trash is timely : while inflation erodes cash, it doesn't do as much damage as plummeting stock markets especially given the optionality of cash (that and most people aren't going to buy eggs and milk with their PFs)
Just a few counterablancing thoughts, though as an amusing anecdote, Fidelity recently published that their outperforming customers between 2003 and 2013 were actually dead : very difficult to mess with your portfolio from six foot under!
My strong sense is that as this tidal wave of liquidity now recedes, the good old days of all boats floating are over ( many will sink forever as the tightening continues). Timing, knowing where we are in the business cycle, stock picking and research will be even more important in the markets ahead. The legendary Stan Druckenmiller recently said that in his 49 years of investing, he's never known markets as tough : nor is he wildy optimistic about the next 10 years
I am a technical trader with an investing background and a scientific training: I post this kind of stuff on twitter https://twitter.com/runningpro...
Very interesting. Yes, advice to stay in the market for the best 30 days similar to advice to buy Amazon when it was pennies. Better to deal in practicalities.
" their outperforming customers between 2003 and 2013 were actually dead" - I've a sneaky feeling, dscollard, that at 78 yoa I'm going to view the top of this cycle from down under!
And you're not referring to an antipodean adventure either .. who knows and age is just a number (though it does have an inferred probability distribution attached to it)
Grateful.
If I had a pound for every time I have read, or been told, that missing out on the index’s best 30 days would have cost me x millions, I would be a very wealthy man. Not once, anywhere, have I seen a statistic for how I would have fared had I missed the worst 30 days in the market…Does anyone have a figure for this?
I've read that a stock's best day is usually the one after the worst day. Don't know how that translates to 30 days though.
Not once, anywhere, have I seen a statistic for how I would have fared had I missed the worst 30 days in the market…Does anyone have a figure for this?
I don't, but it makes no difference because it's still nonsense due to something called "volatility clustering".
In essence the best days usually occur close to the worst days. For instance, the S&P had one of its worst days ever on 9th October 2008. Four days later it had one of its best days. Two days later it had another one of its worst days. Thirteen days later one of its best.
Even better (or worse) both best and worst days both tend to occur during bear markets.
So, basically, to get the best days without the worst you need to be in the market on the right days in the worst years.
timarr
I was busy writing an overlong response that supports that .. with a bit of data so sorry , didn't ignore your contribution Tim
For the S&P...
Agree. As egregious as the tired observation that 4% of stocks are responsible for all the gains. Statistically provable, but unrepeatable in practice.
Returns are roughly symmetrical; the impact is similar.
Timing the market has a bigger impact on performance than stock picking BUT timing is very difficult / impossible whereas stock picking is possible but not easy.
Timing the market is possible but difficult, I have studied reversals on many different markets and time frames and one key aspect people should be mindful of is price / rsi divergent lows / highs. These often show a set of double or even triple peaks with divergence indicating momentum is waning and a reversal is imminent. The higher the TF , the more reliable the signal. All must be viewed in the context of market structure and macro outlook though.
Don’t fight the Fed.
Very interesting, i wonder if you have more info.
From what i understand you are looking at over sold relative strength. Essentially the size of price change over a certain amount of time.
Essentially looking at acceleration, the change in speed rather than speed, i.e., price change.
I take your point about the macro-outlook, in a bear market even though there is whipsaw up and down, only play the downside because that is the overall direction. The reverse for a bull market. The Fed and other central banks have told us it is a bear market via interest rates and QT. It would be silly to disbelieve them.
In essence, yes. I use momentum indicators alongside price to gauge strength of trends and to determine where the trend may be running out of steam.
For example, you may see divergent peaks presenting at a significant price level (support/resistance, key MA etc); or indeed you may not, this can then inform whether the probability is greater in terms of reversal or continuation to increase the odds in your favour.
This can offer attractive entry points when combined with other confluent data points. You should pull up a charting package and do some back testing to see what I mean :)
Novacyt SA (LON:NCYT) (I hold after recent entry), on the 4h or daily TF would be a good example.
Seeing as I've mentioned it, I'll plug the fact that the business is currently available for free as they have cash in the bank of almost twice the current mcap, allowing a nice buffer for the execution risk of their growth strategy following their Covid bonanza.
Many thanks. Interesting comments.