Exploring a Guru Screen
Each Guru Screen overview contains a wealth of resources about an investing approach originally devised by a legendary investor or renowned academic. The overview will help you learn about the strategy, track the performance of Stockopedia’s independent model, and discover new stocks that qualify for the rules on a daily basis.
You can navigate to the Guru Screens by clicking Browse and choosing an investing category listed under "Guru Screens" in the local navigation menu. Alternatively, you can click one of the Most Popular Guru Screens on the main Browse page.
We’ll dive right in and take a look at a Guru Screen overview using our model of Jim Slater’s famous strategy, The Zulu Principle.
Navigating around a Guru Screen page
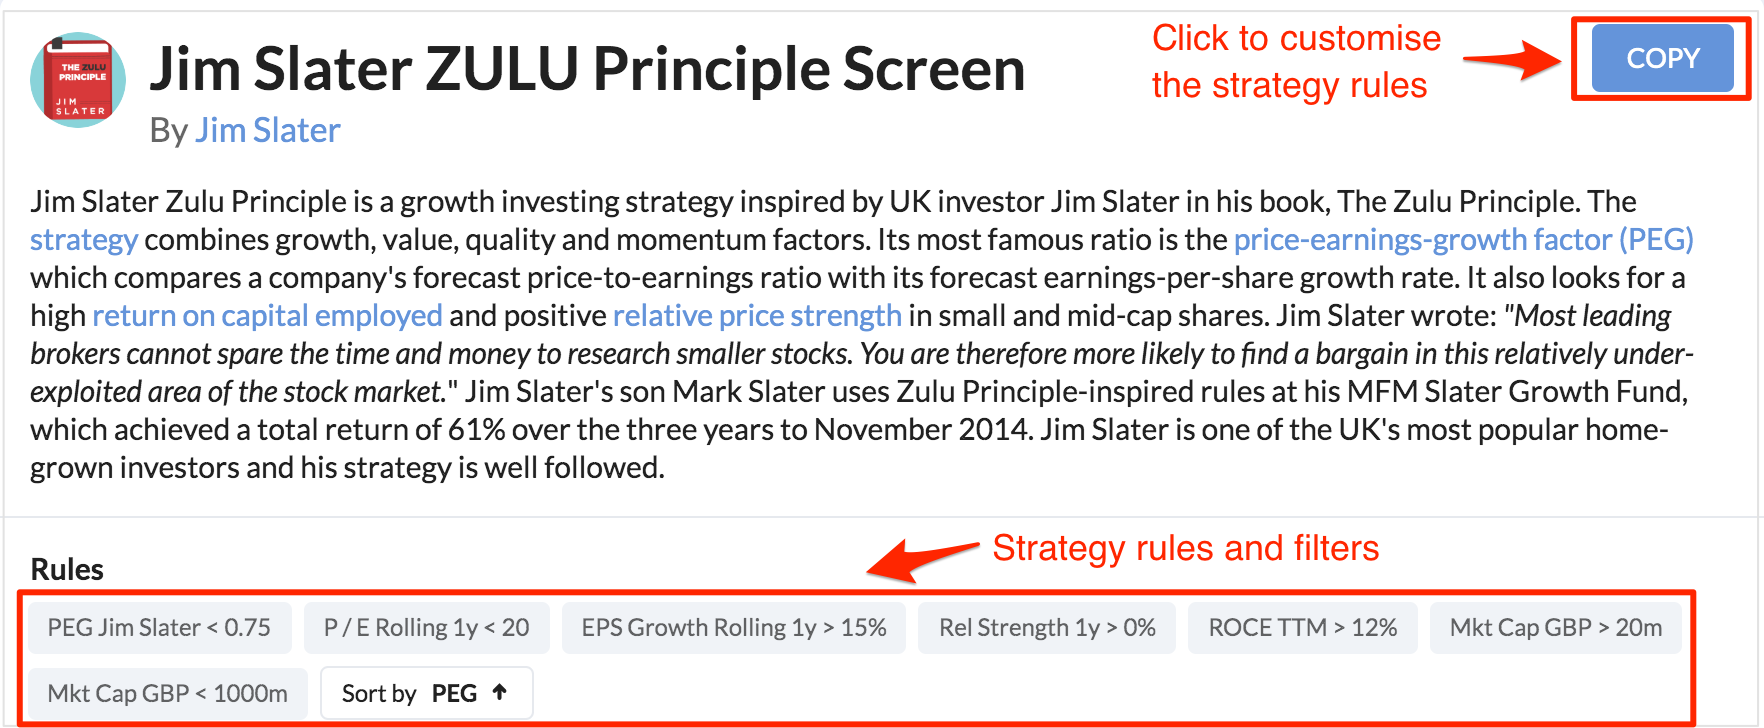
At the top of each Guru Screen page is brief overview of the screen and details about the individual it was inspired by. We’ve tried to keep these descriptions standardised with useful links to further reading and key ratios in the glossary.
Key information
- Source: Under the name of the screen at the top of the page, you'll find the name of the guru(s), which links to the source book or academic paper where the strategy was first introduced.
- Rules: These show the precise set of rules & filters that we’ve used to create this screen.
- Screen summary: This includes an overview of the strategy, including the average StockRank, StockRank Style, RiskRating and performance.
Performance Tracking
Below the screen summary is the performance tracking section. This tracks the returns of this screen daily - as we describe more fully in the [Performance Tracking Guide], and also conveys other key points like the screen's aggregate StockRank.
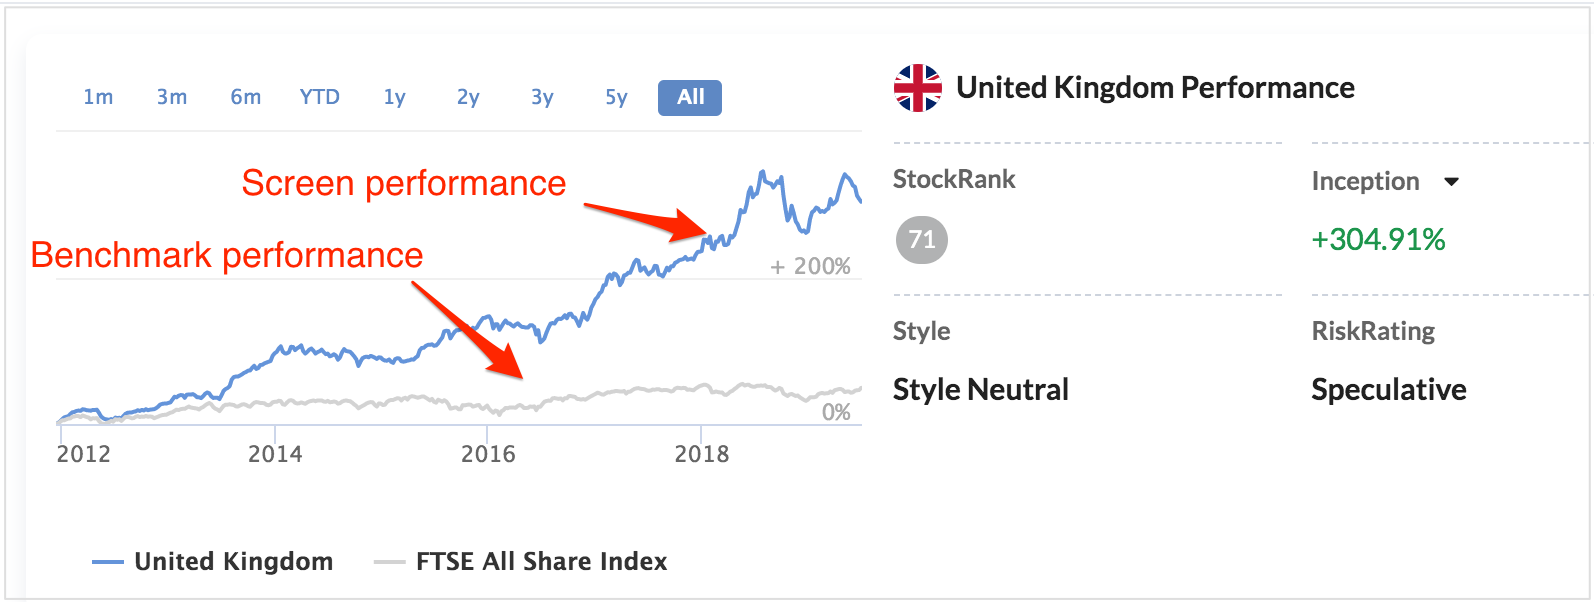
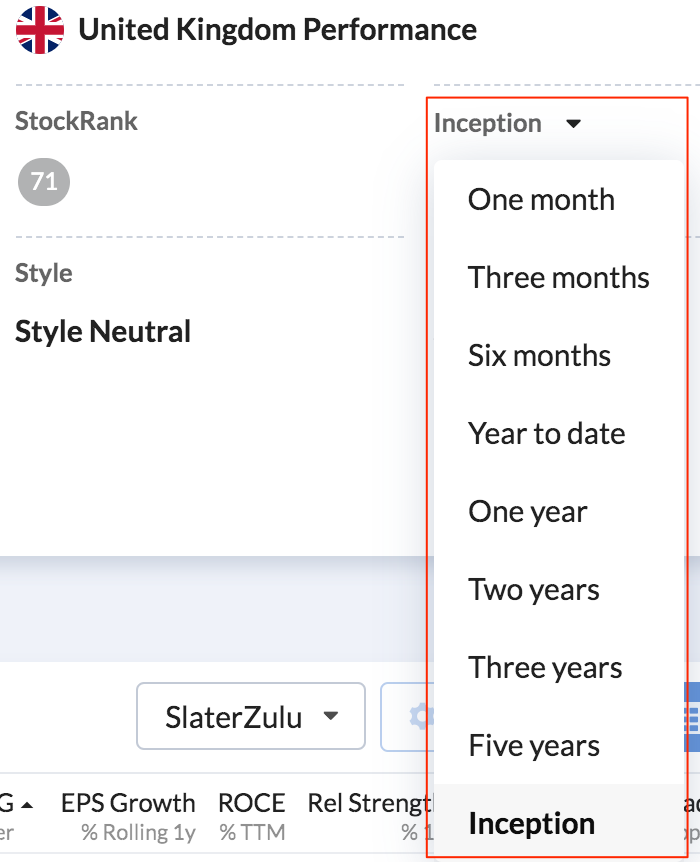
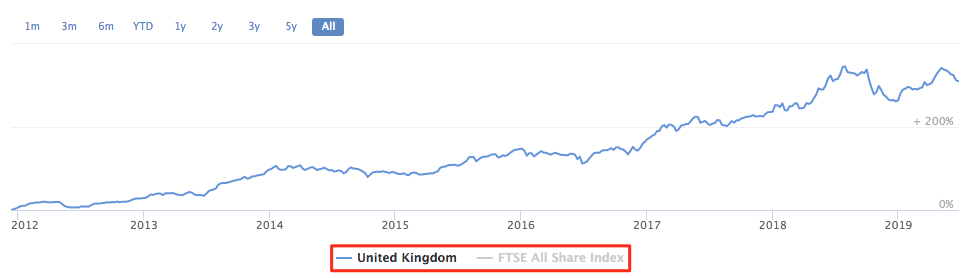
The long-term performance of each strategy in different geographic regions can be seen on the chart. You can see the screen for different regions by changing the "Region Focus Mode" at the top of the screen across from the Search bar and change the timescale by clicking "Inception" and selecting your preferred range.
If you would like to hide either the Benchmark or Screen performance line by clicking on the relevant label at the bottom of the char
We ‘live track’ the performance of these screens (rather than backtest).
Please note that our performance tracking studies are based on equal weighted portfolios of a maximum of 25 stocks [rebalanced quarterly]. Don't forget: Past performance is not indicative of future returns.
Qualifying Shares
When you are exploring lists of stocks, you can speed up research by using the Pager. After opening the first StockReport in a list you'll see 'Previous' and 'Next' navigation arrows appear at the top of the page. Click those buttons or use keyboard arrows to quickly flick through the rest of the StockReports without having to return to the list.
Further down the Guru Screen page you'll find a list of the companies that are currently meeting the rules of the screen.
Note that while we track the performance using quarterly snapshot portfolios, the list published in this section is updated daily. So you can think of this list as the current opportunity set available using these screening rules. As a result this is the most popular part of the page.
Remember! These lists are not ‘buy lists’ but they are a good starting point for further research into individual companies.
Table Views
There is a lot of detail in the table so let’s take a closer look.
Rows
Each row in the table represents a company that passes the strict screening rules of the strategy. The list is sorted according to the default sort order as defined in the rules tab (in this case in order of ascending PEG ratio).
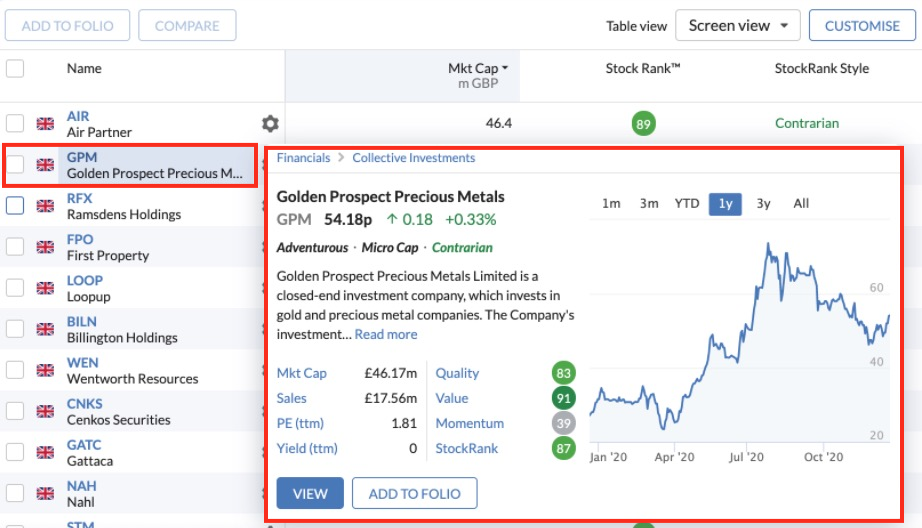
At any time you can take a detailed look at any of the companies by either hovering over the company and viewing the Snapshot, or clicking a company name which takes you to directly to its StockReport.
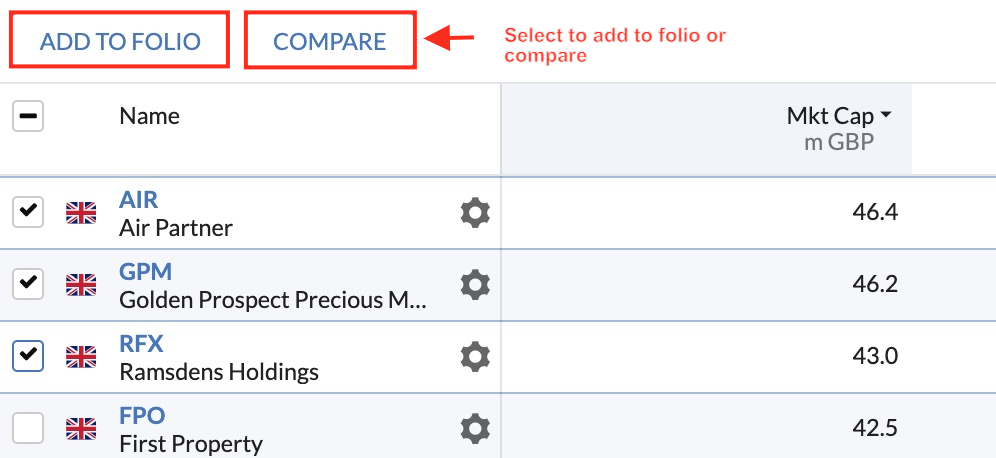
At the start of each row there is a tick-box. Ticking it will activate the Add to Folio and Compare buttons at the top of the table.
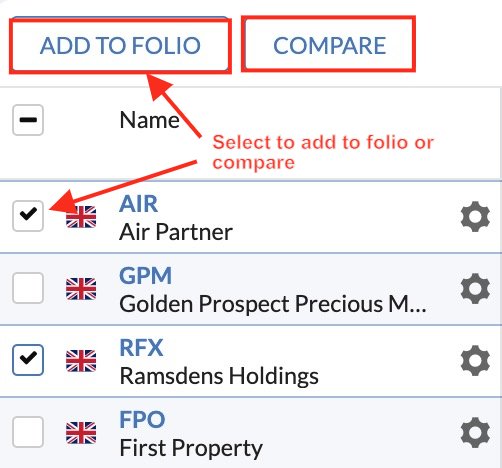
These buttons give you the option to add any or all of the stocks to a watchlist or portfolio, or compare stocks head-to-head against a range of historical and forecast measures in the Compare Stocks Tool.
Next to the name of each security is a 'cog' icon. Click that to Add Alerts or Add Notes about a stock.
Columns
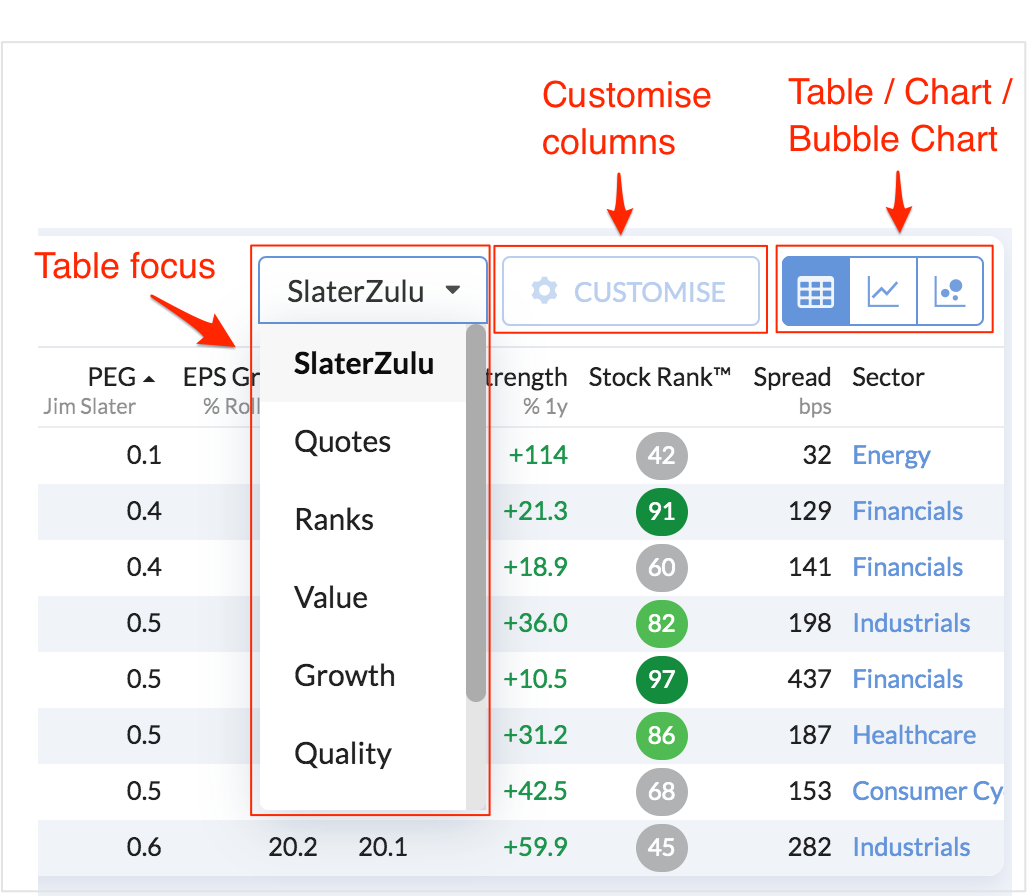
In each column on the default table view you’ll see all the metrics that were used in the rules of the strategy. Clicking on the top of any column will re-sort the qualifying stocks by that column in ascending or descending order.
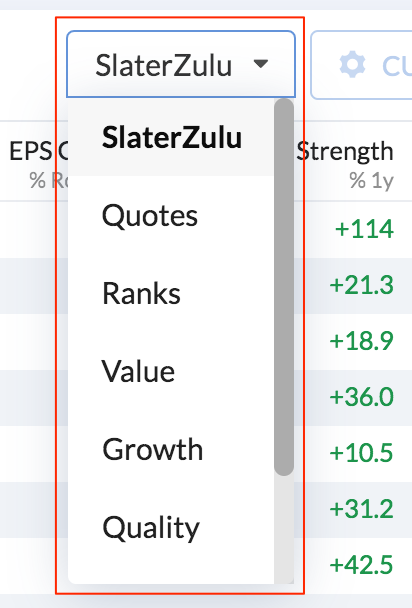
You can switch between different column views by using the drop-down menu and selecting one of the alternative options, including Quotes, Ranks, Value, Growth, Quality, Income or Momentum.
Remember! You can customise table views in any way you want. Click the Customise button at the top of the table to launch the Table Editor. This will give you the option to change the current view to include any of Stockopedia’s vast library of ratios. So you get to see precisely the data you want to.
Other views - snapshots & charts
As well as changing the data in tables and seeing Snapshot information, it’s also possible to switch between different visualisations of the companies on the list. To the top-right hand side of the table are two buttons which allow you to view the companies as a:
- Table - the default list
- Charts - in different timeframes
You can learn more about these different data views in our dedicated Tables & Views section.

