How a decade of NAPS portfolios beat every fund manager in the UK

I can hardly believe it, but it’s about to be ten years since the inception of the NAPS Portfolio at Stockopedia. And what a decade it’s been for UK stocks. We’ve had Brexit, six Prime Ministers, a pandemic, FTSE indices that have gone nowhere, an AIM index that’s gone backwards, and a torrent of delistings as company executives up sticks and move to the USA where everything is going gang busters.
So it’s rather surprising to find that the humble NAPS Portfolio has done rather well. This model portfolio that I run based on the StockRanks only invests in UK stocks. It’s so simple, it takes barely an hour every year to put together. Minutes really. The writing and thinking take far more time.
But these few minutes of work each year have yielded a more than a tripling of the starting capital. Compounding at a 13% annualised rate, the NAPS have beaten every UK fund manager, all the UK indices, and even the S&P 500. Yes, just by investing in UK stocks.
Playing a winning hand
Picture sitting at a card table, and being dealt a hand so strong you know it's almost certain to win. That's called a "nap hand” and it’s where the NAPS portfolio got its name. The difference is that instead of relying on the luck of the draw, we stacked the deck with data.
In starting the NAPS, we weren’t 100% confident, but we wanted to prove something. Could a methodical, data-driven approach to investing beat the traditional “share tips" approach of the financial press that so often underperform. So we designed some simple stock selection rules, based on the StockRanks, that anyone can apply in as long as it takes to make breakfast:
- Sort the UK stock market by StockRank descending.
- Exclude small and hard to trade shares (sub £20m market cap).
- Select the top 2 stocks from each of the 10 sectors.
- Buy the list, and hold for one year.
- After each year, sell and repeat.
Occasionally, I've tweaked the formula here and there - sometimes picking just one stock from smaller sectors like telecoms, sometimes leaning more into value plays. But the core approach hasn't changed. I figured it’s much less harmful to fiddle with the rules once per year, than fiddle with the portfolio daily. And a major benefit is not having to worry over every news announcement, CEO interview or broker downgrade.
Applying the NAPS approach means not getting emotionally attached to the holdings. Yes, maybe it “takes the craft out of it”. Maybe it’s “too mechanical”. Maybe it’s “not proper investing”. But maybe all these biases we have about “the right way to invest” get in the way of outstanding returns. So let’s leave those at the door and review the results.
Ten years of outperformance
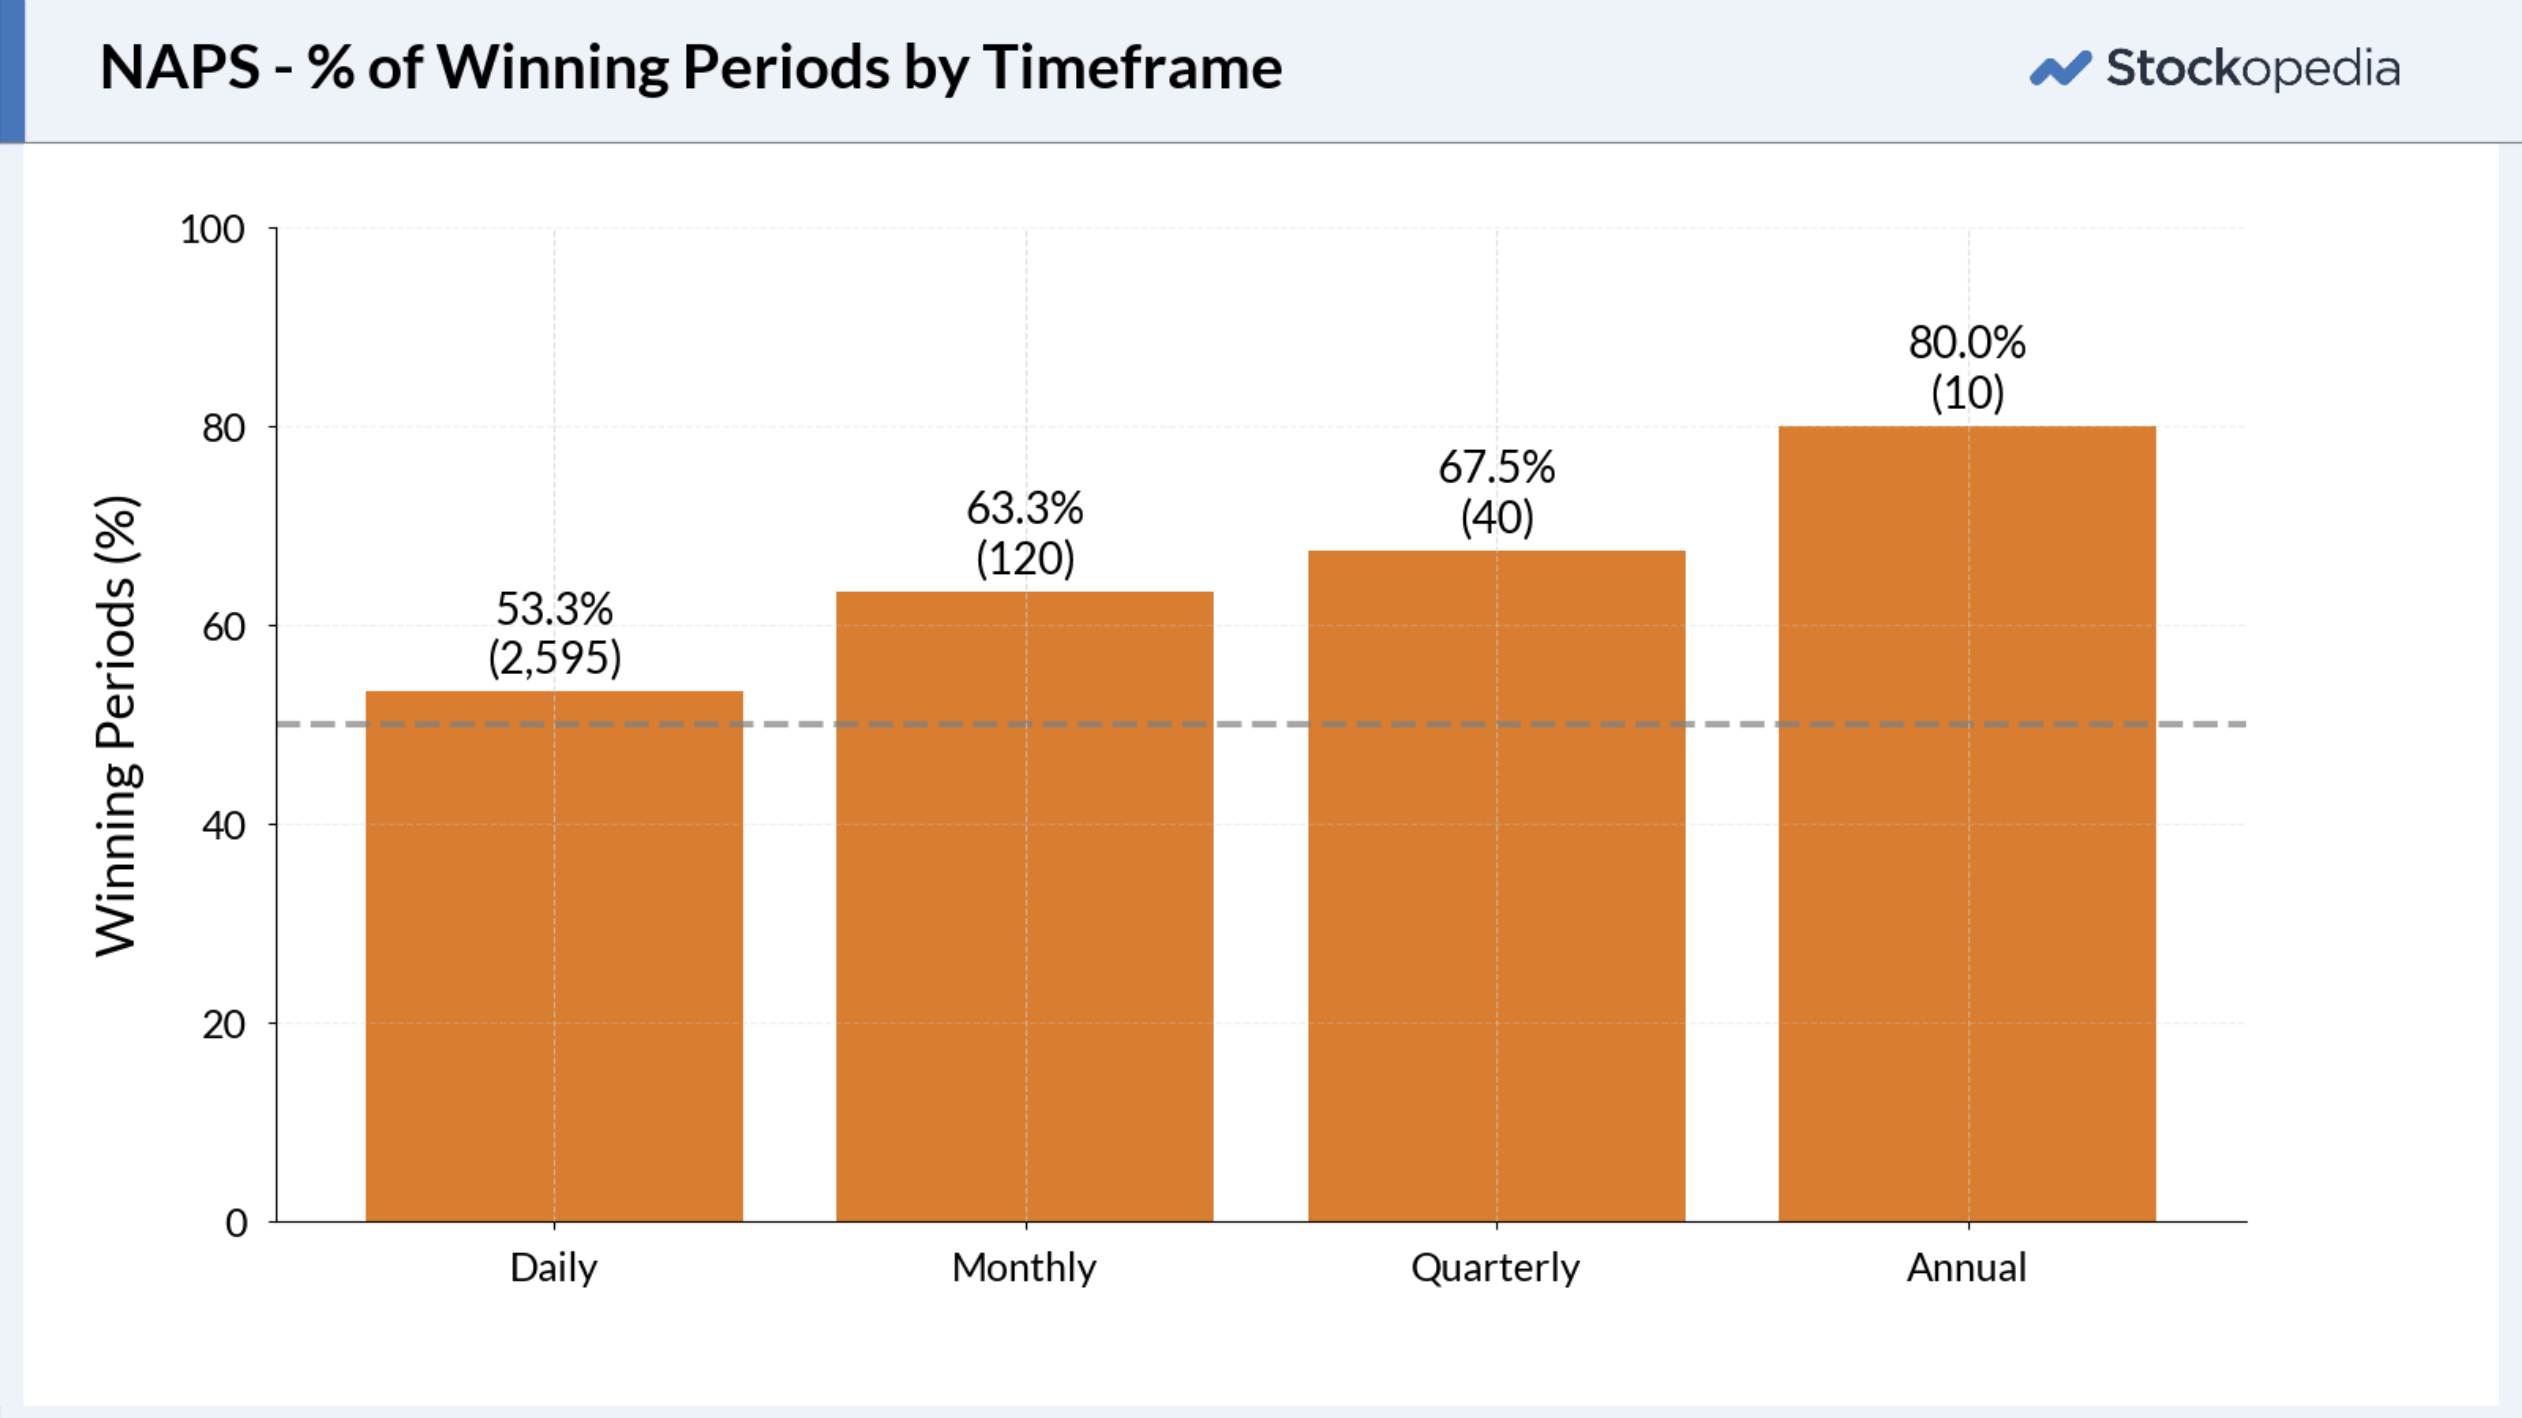
2024 has been a good year for the NAPS, with the portfolio at the time of writing (17th December) up 21% year to date. This strong recent rally, driven by stocks like Greencore and Costain, has brought the portfolio near to its peak valuation, seen in green in the chart below.
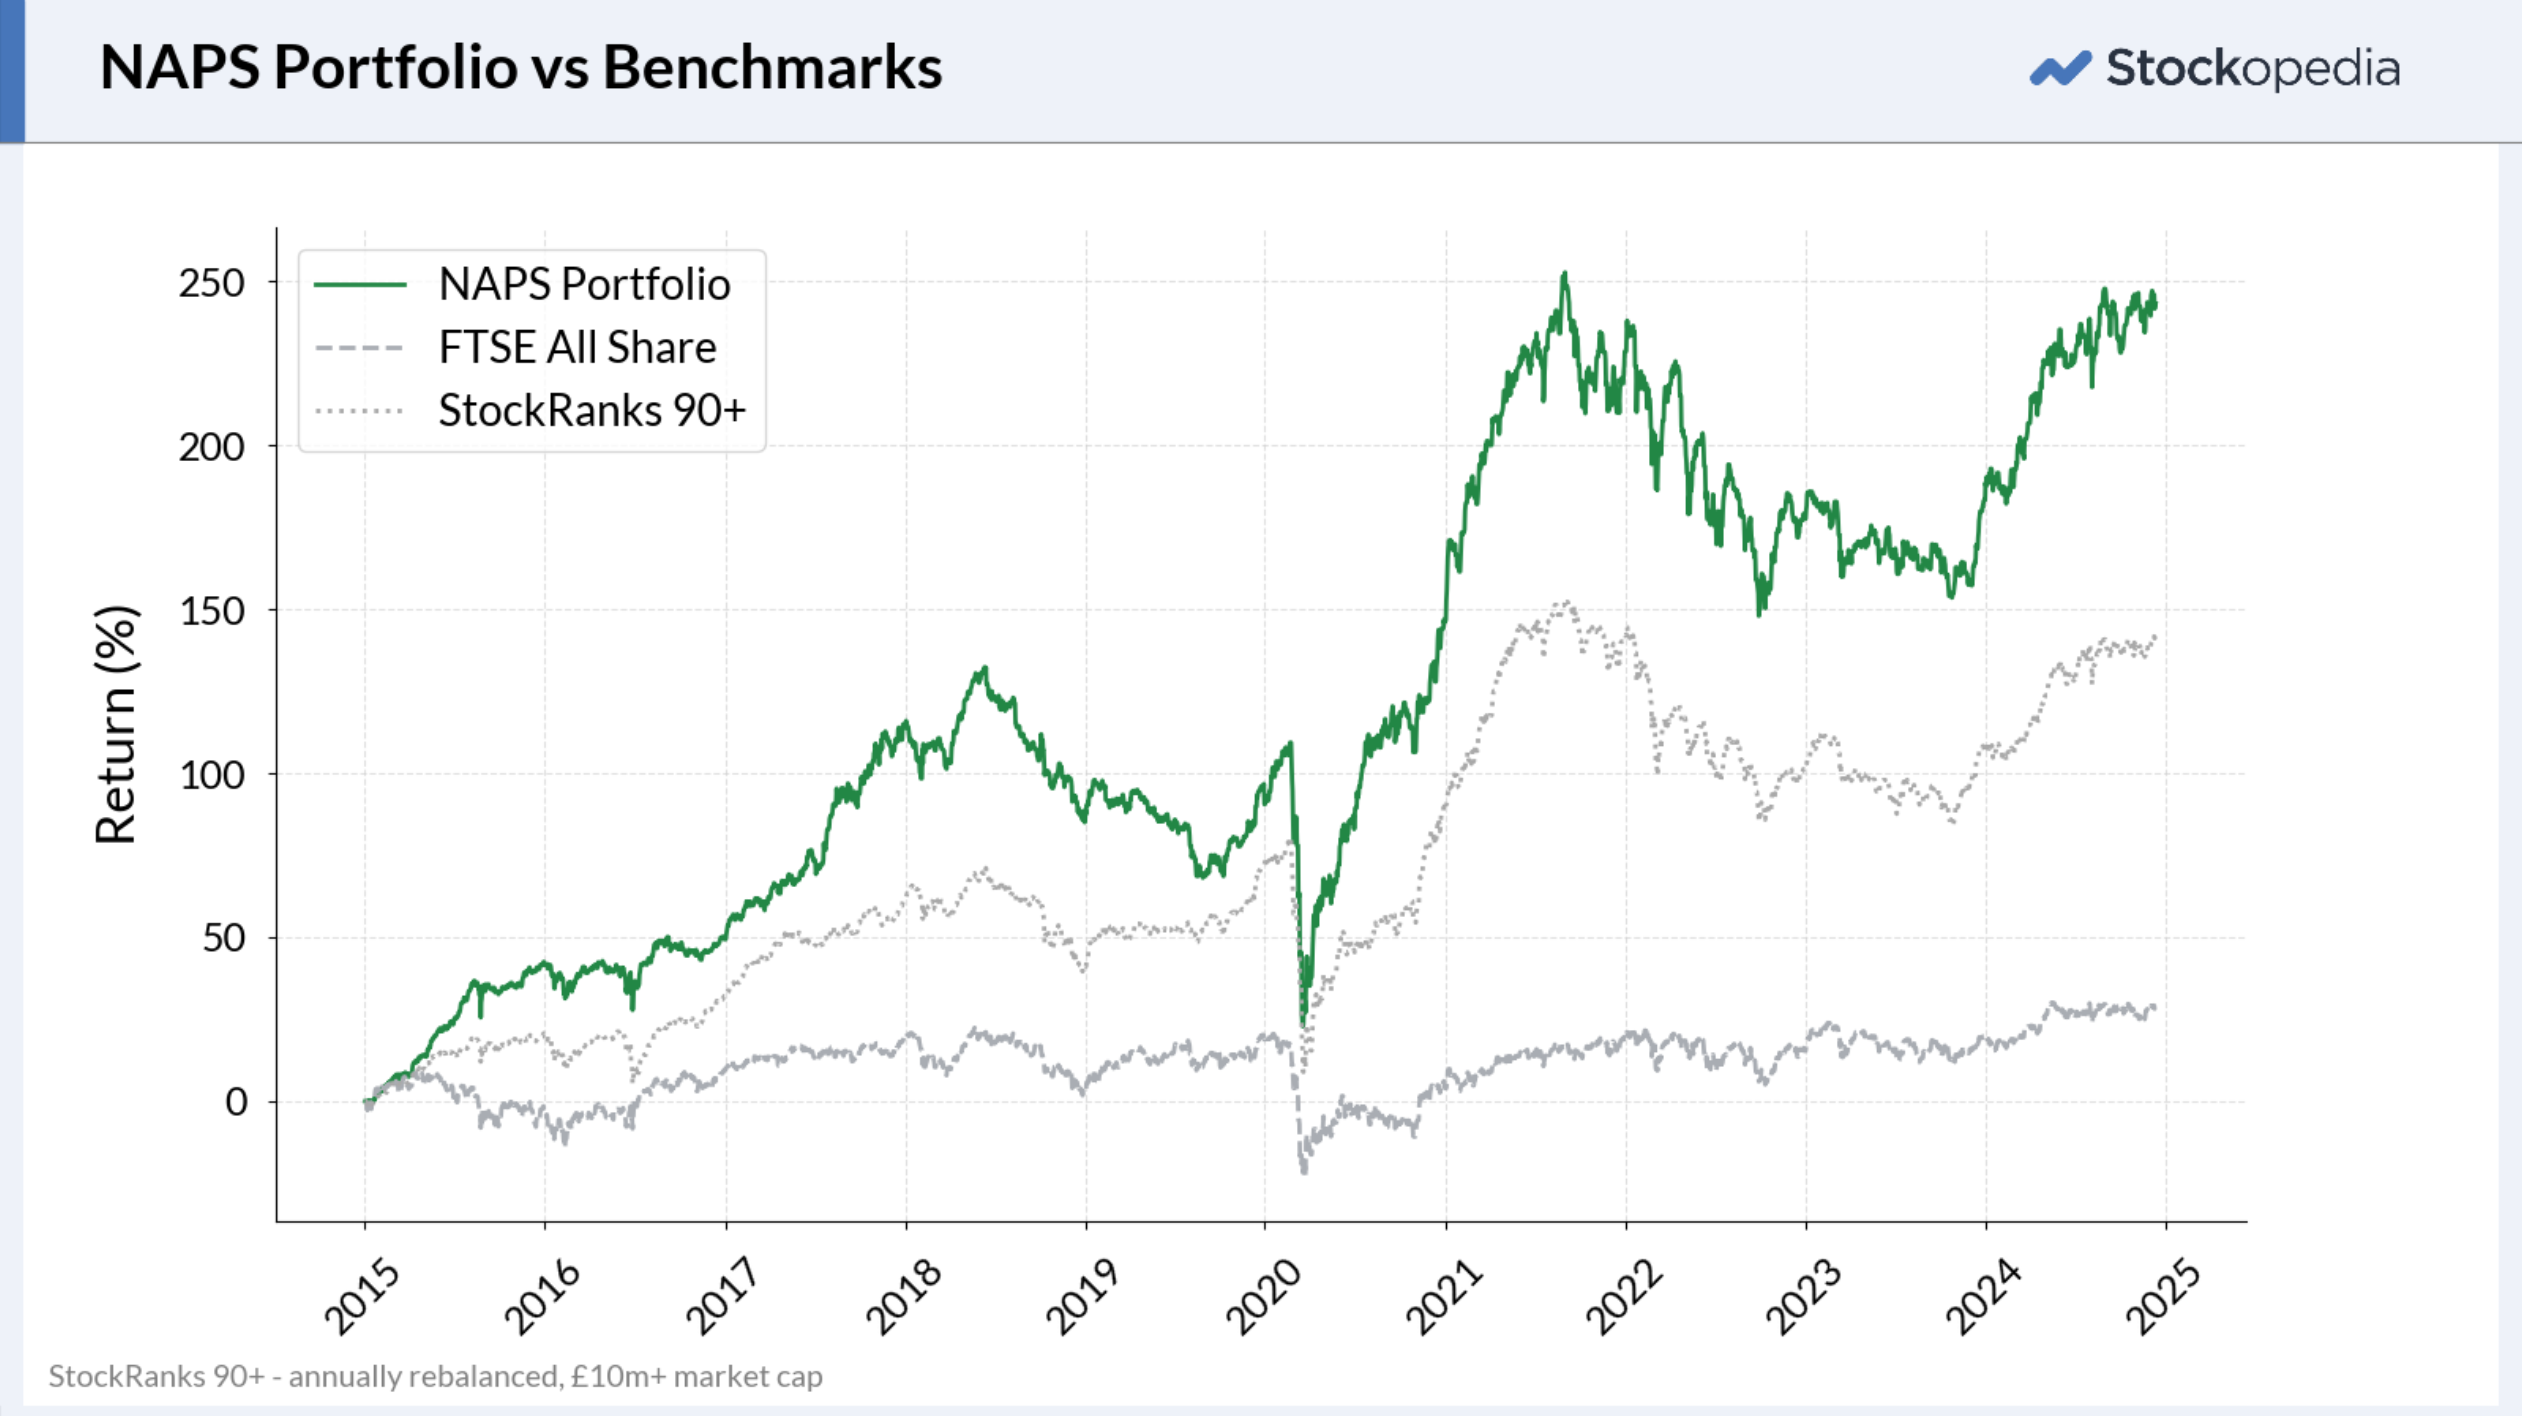
The returns have dominated the overall 90+ StockRanks set (dotted light-grey line) on almost all timeframes (over a 1 year, 3 year, 5 year and 10 year period). Maybe it’s just luck, but it does seem that the diversification benefit of owning the top-ranked stocks in every sector has driven additional returns. More on that later.
But it’s the outperformance of the portfolio against the indices which really drives home the point that private investors, using simple rules can outperform. Yes, the NAPS has beaten the low bar of the FTSE All Share (+27% over the decade*), but it’s also beaten the S&P 500. The S&P’s 193% over the decade can’t keep up with 241% for the NAPS.
The lesson here is clear - you don’t need to “give up” on the UK stock market. You don’t need to chase returns in hot sectors or geographies. There are quality, undervalued businesses at turning points everywhere. These traits are what the NAPS process hones in on. Simple rules, repeated consistently, really do work.
Seven years of suffering
But let’s not pretend that generating outperformance is easy. It’s regularly been absolute torture. Only one year in the last seven, from 2020 to 2021, has seen the portfolio power itself to new highs. The rest of the time it’s been in a “drawdown” with a valuation well below its high.
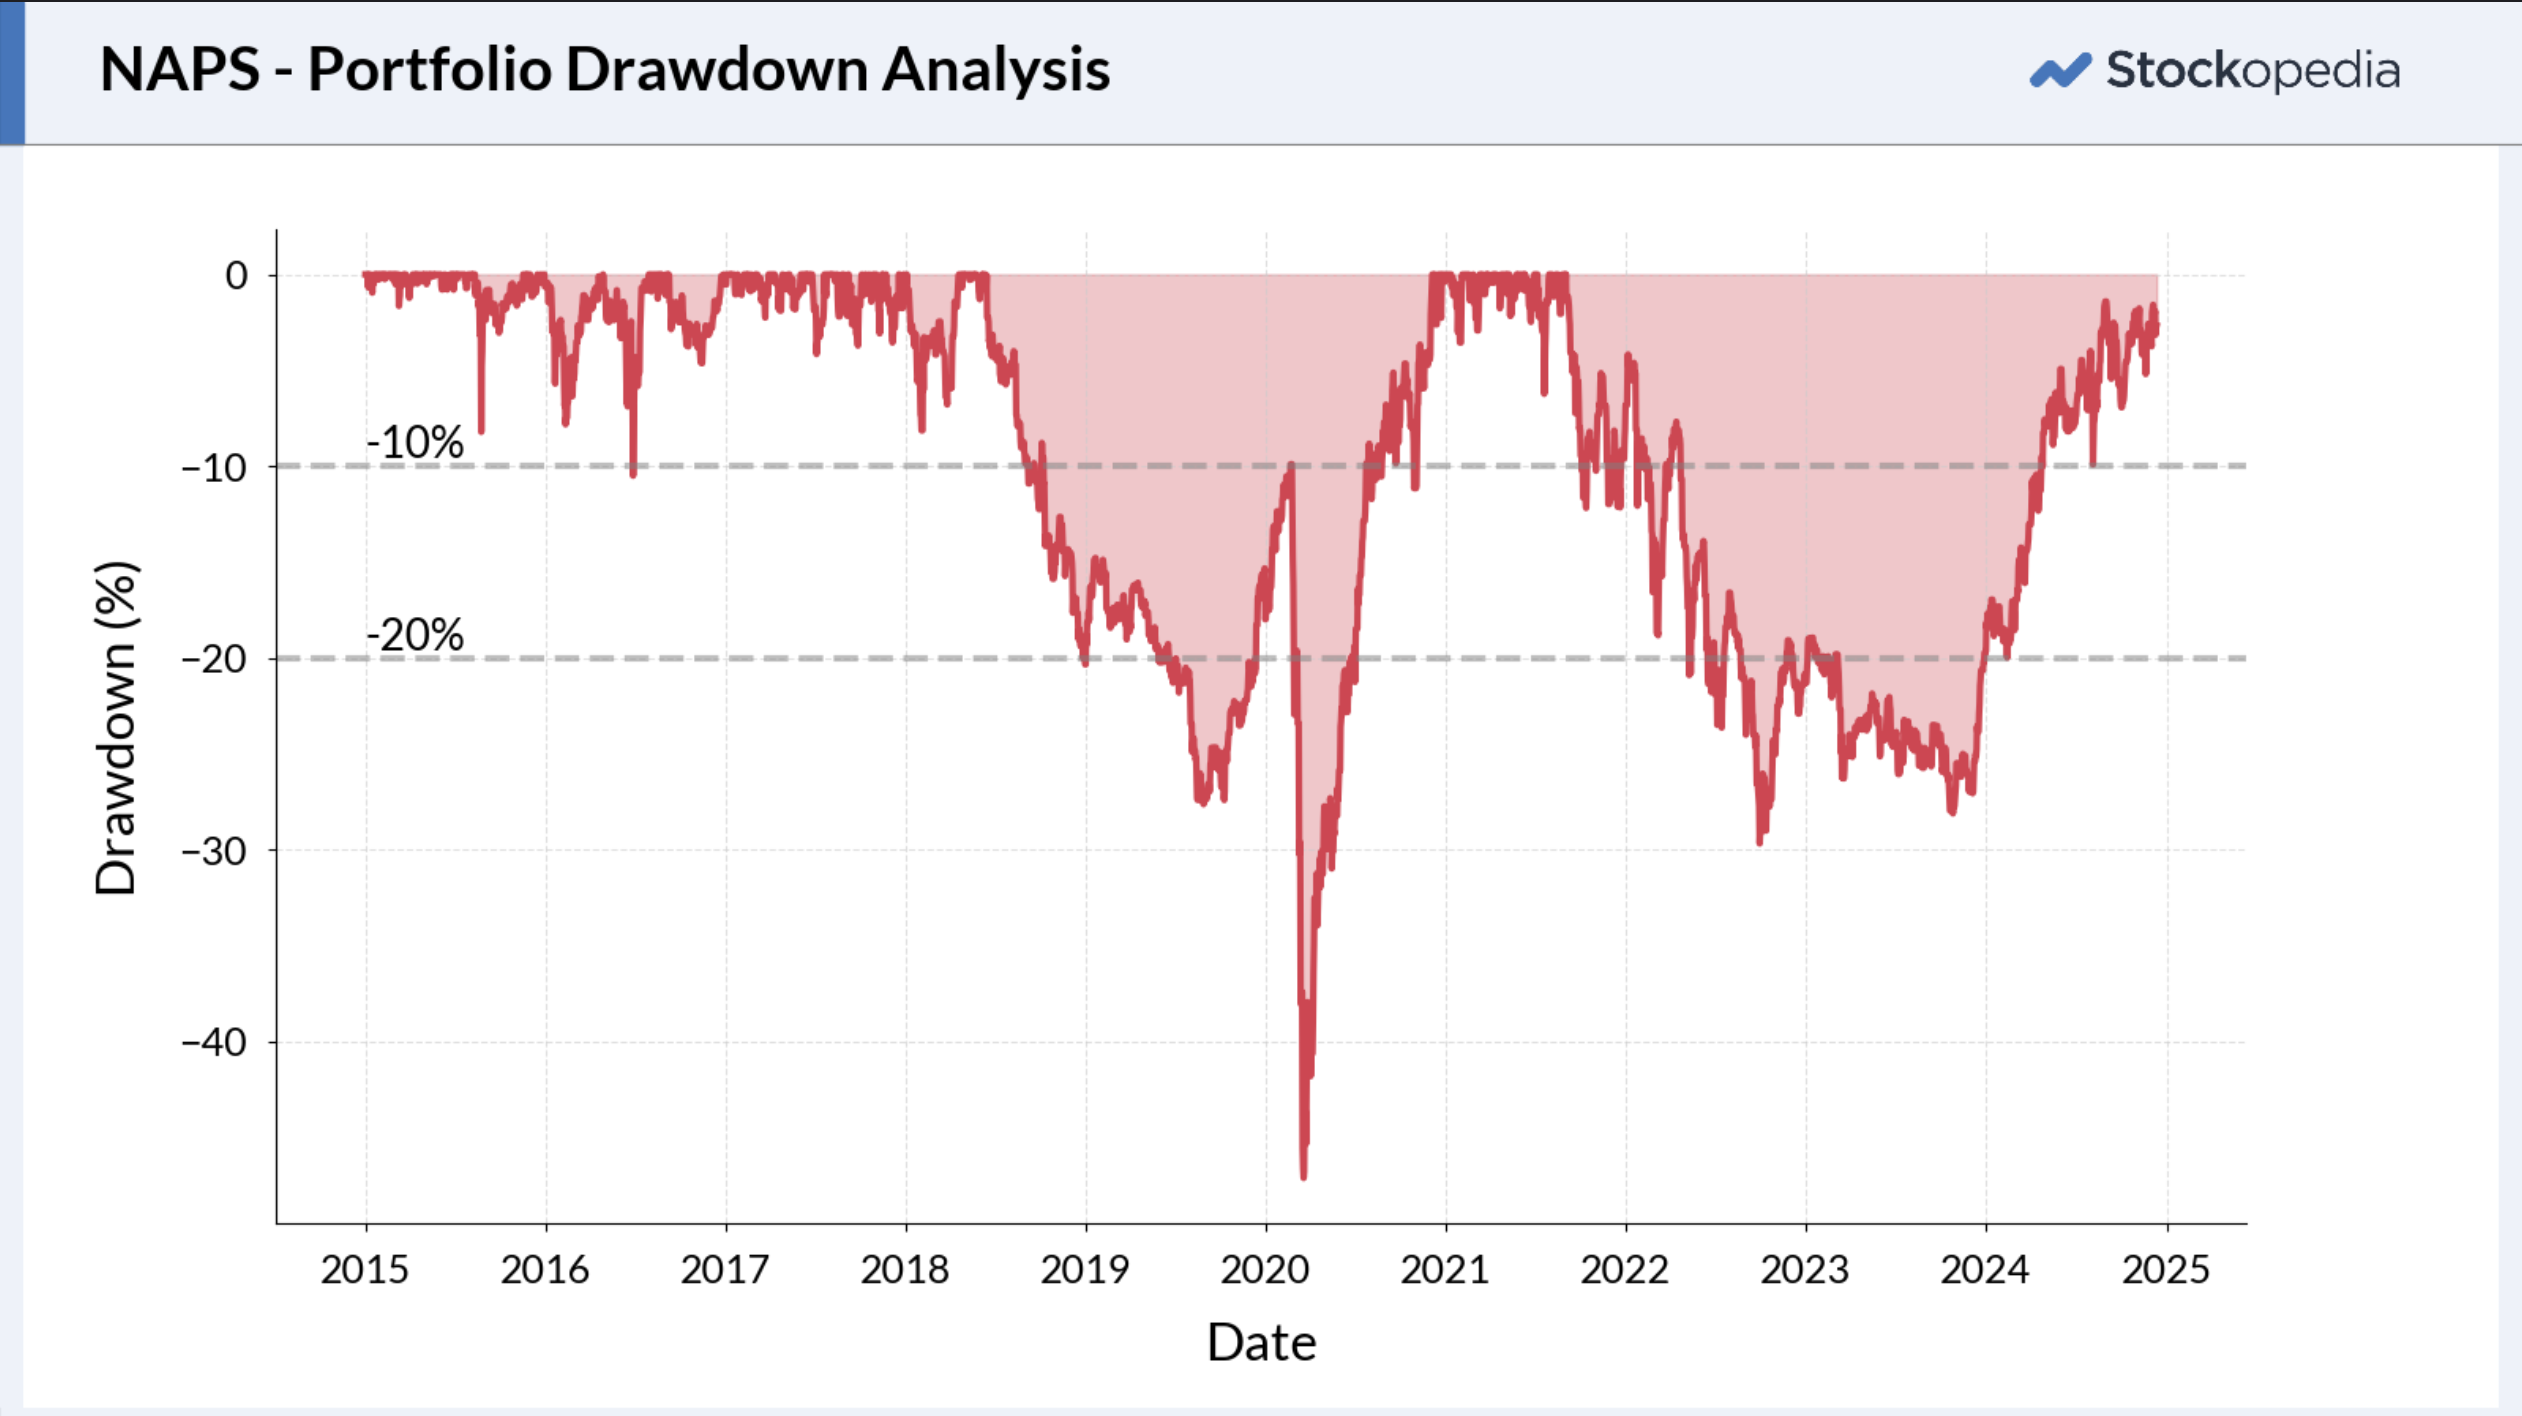
Do you remember this? March 2020, the pandemic hit. In just over a week, five years of steady portfolio gains vanished into thin air. Every morning drew fresh horrors as markets were limit down. The portfolio sank to 47% below its high. It felt like the world was ending.
But by the year’s end, it was up 29% for the year. The rally back from the low was extraordinary - the portfolio nearly tripled over 18 months. So many investors missed those returns having raised cash through stop losses or risk aversion. Getting back in can be so difficult.
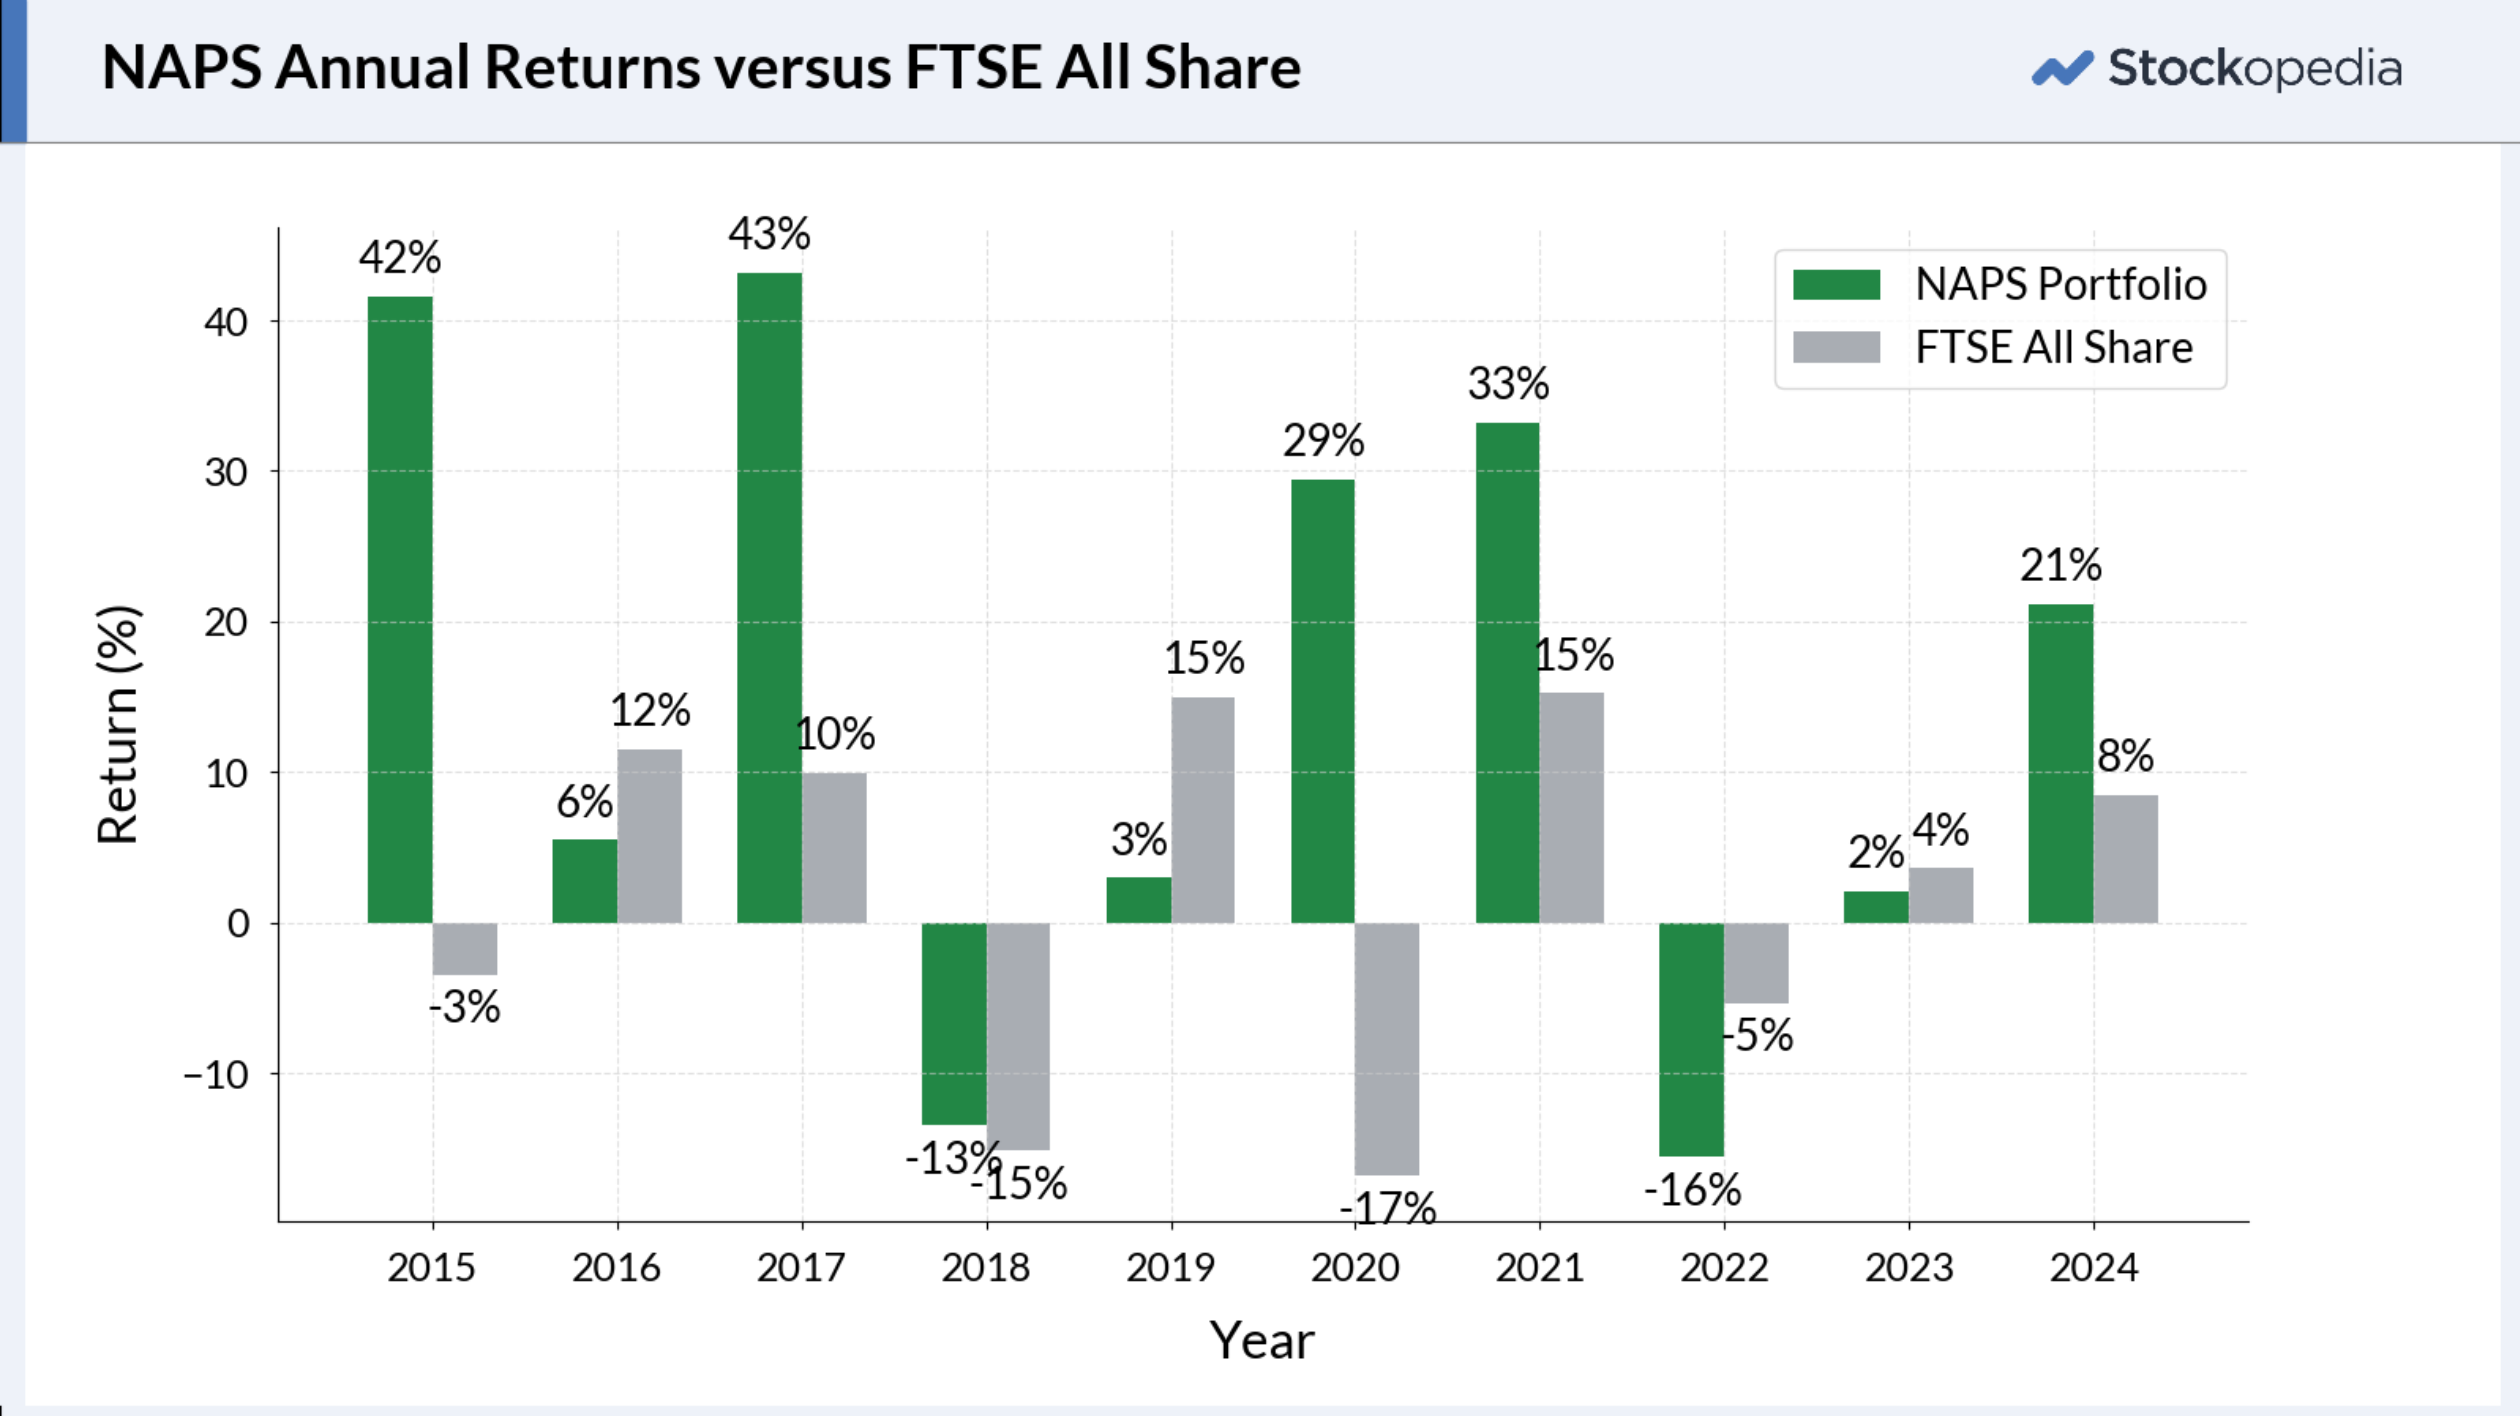
There’s a huge lesson here. We all check our portfolios far too often, and pay a great emotional price. If you check your portfolio daily, you'll be disappointed about half the time. The NAPS portfolio only rose on 53% of trading days. If you look at your portfolio just once a year, your chances of seeing a gain jump to 80%. That's 364 fewer opportunities to do something stupid…. like over trade, selling everything or chasing crypto. I know it’s easier said than done, but taking less actions, and staying disciplined really does pay off.
Taming the fund managers
The last time I published this chart I got in all kinds of trouble from a subscriber... so let’s do it again. If there’s any point at all in running your own money, you really ought to beat the average fund manager. So I downloaded all the data on the IA UK All Companies Funds Sector from Trustnet to compare against the NAPS. There are 175 UK focused funds with 10 years of history plotted in blue below. The NAPS (in green) beat all of them.
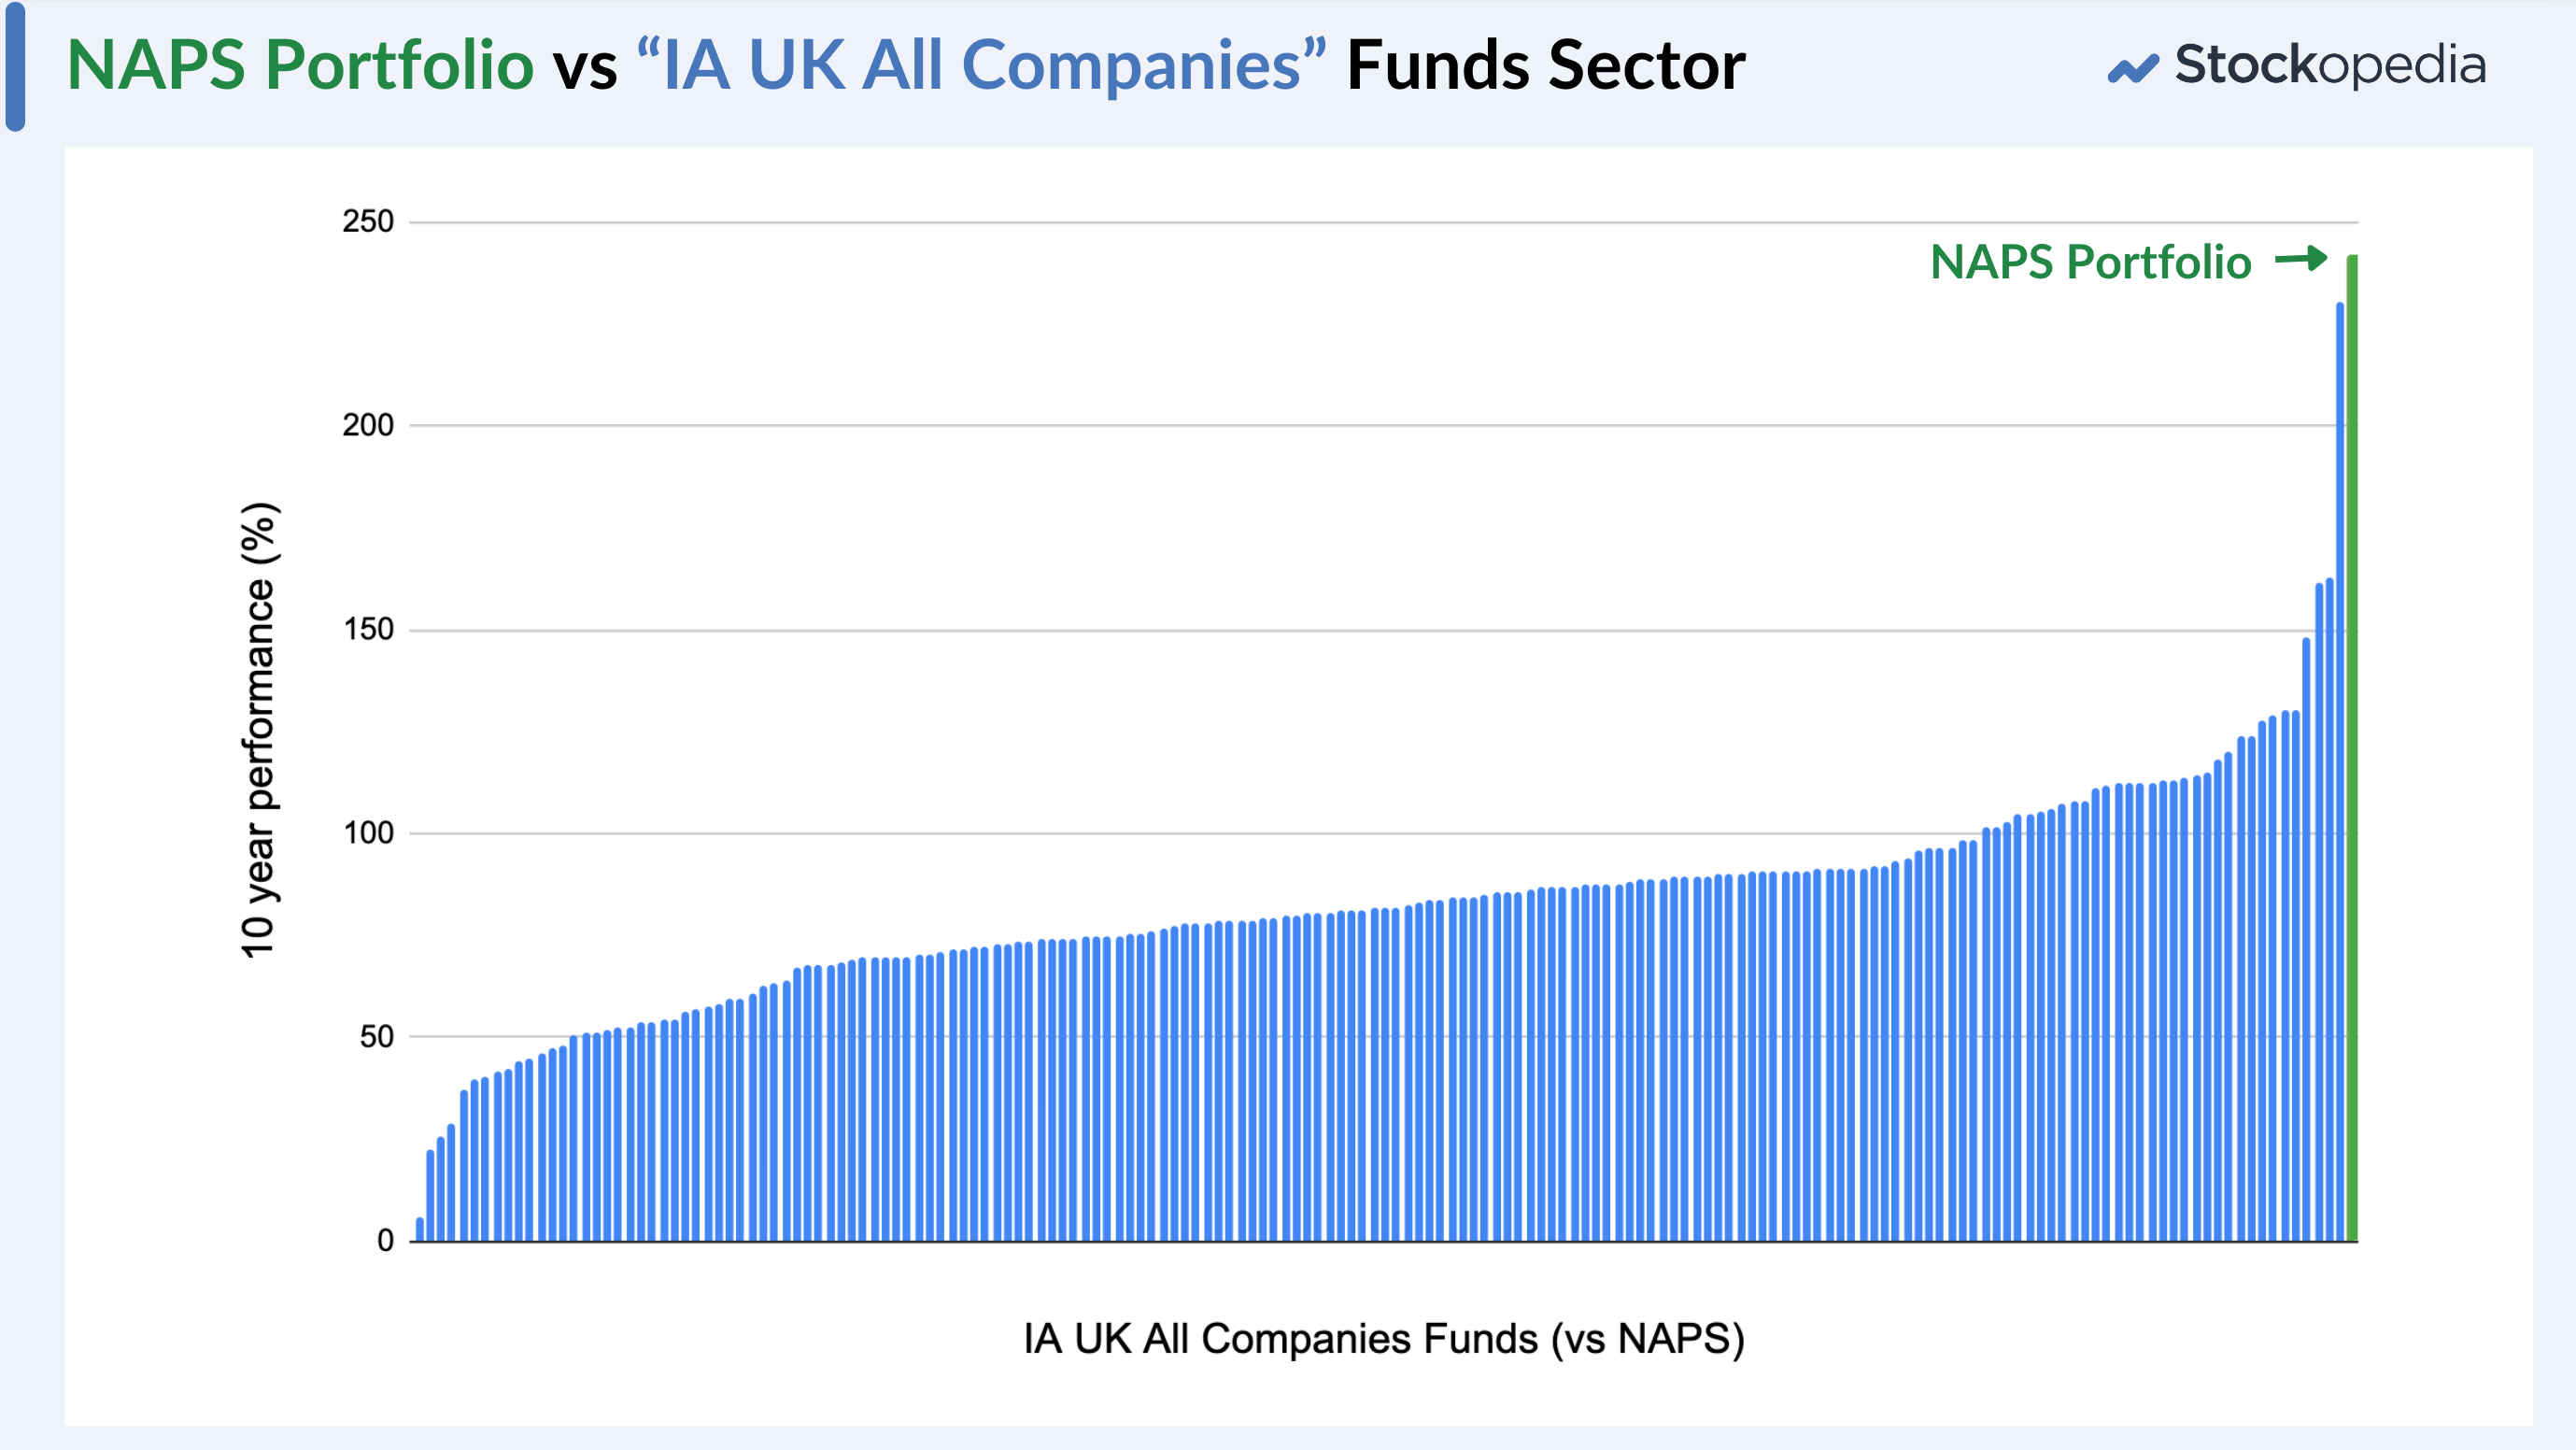
Yes running a fund is a completely different proposition to running a private investor portfolio. It’s not a fair comparison. Funds have to have scale to be viable as a business. We private investors have none of those disadvantages. But that’s why we have such a great opportunity to outperform.
A small edge can pick multibaggers
Many investors go into stock picking expecting to pick only winners. But even the great Peter Lynch once said, “In this business, if you're good, you're right six times out of ten”. The NAPS has nearly hit that level with a 57% win rate over a decade.
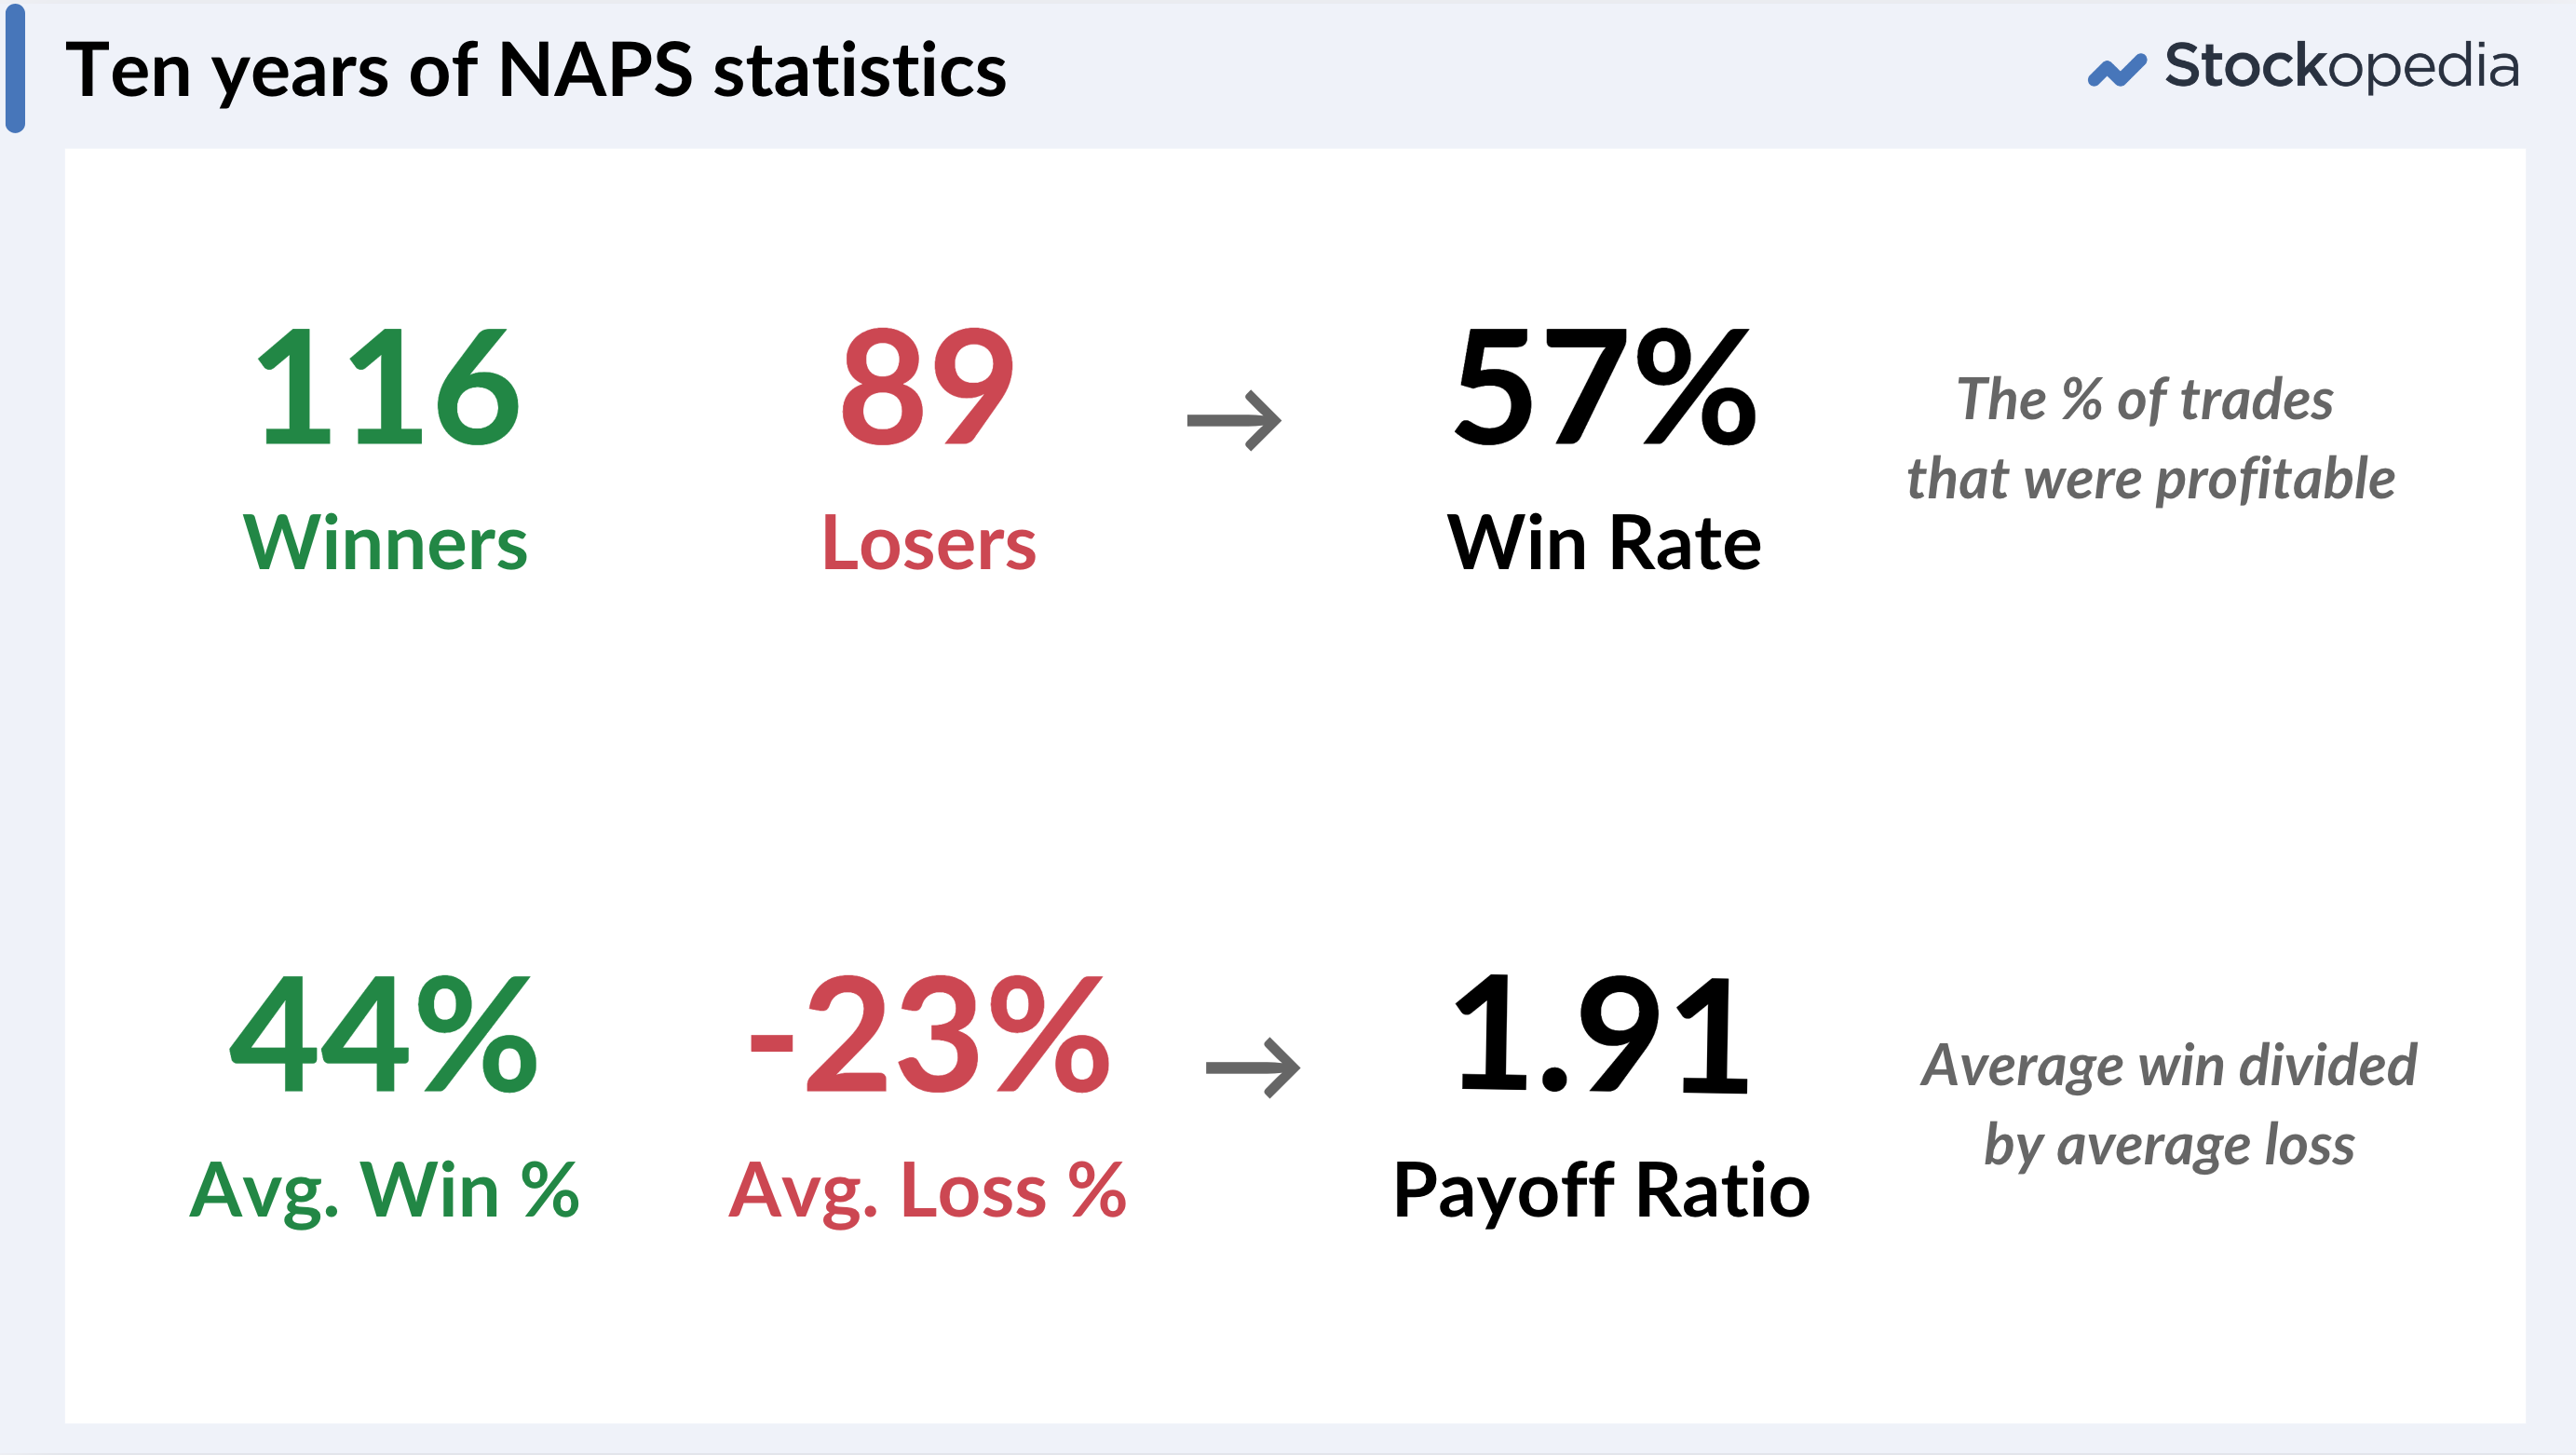
57% may seem low, but it’s super powerful when combined with a payoff ratio of 1.91. With an average winner returning almost double the average loss, these statistics have driven some serious portfolio compounding.
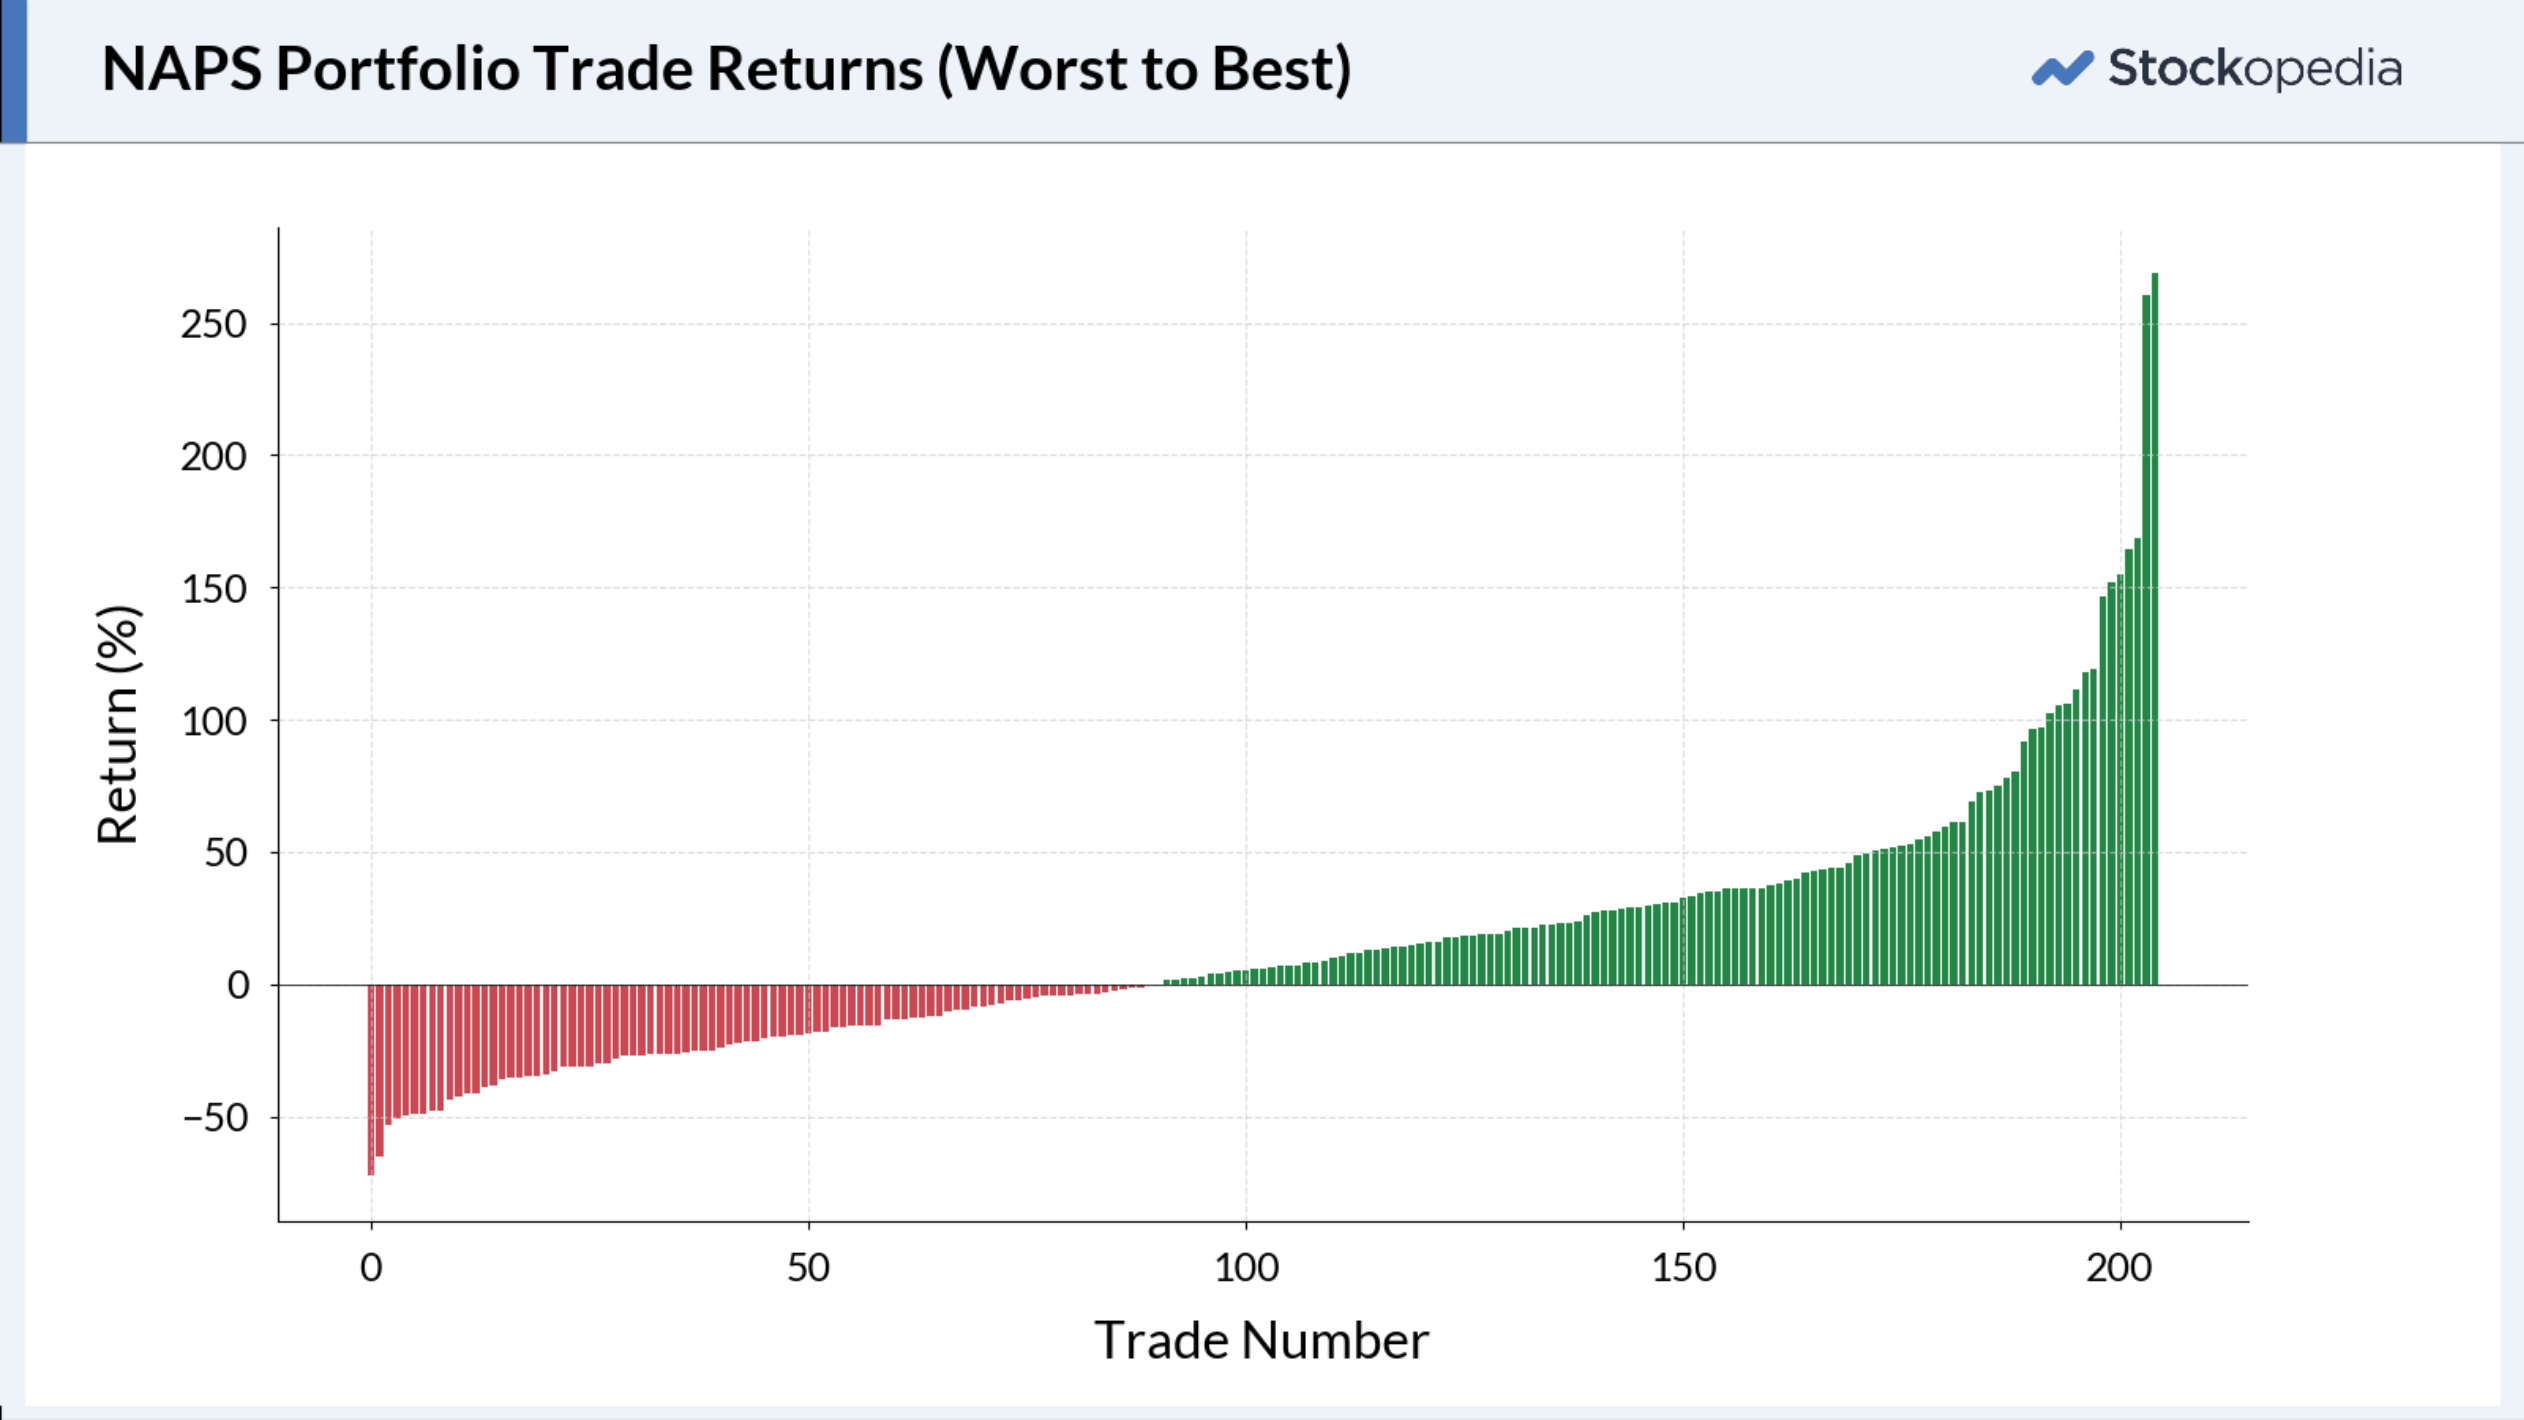
I’ve laid out all the trades in sequence from worst to best in the chart below. 13 stocks doubled, 2 almost quadrupled, but only 4 more than halved. The skew to the upside is high in the stock market. Big winners can make up for all kinds of losses.
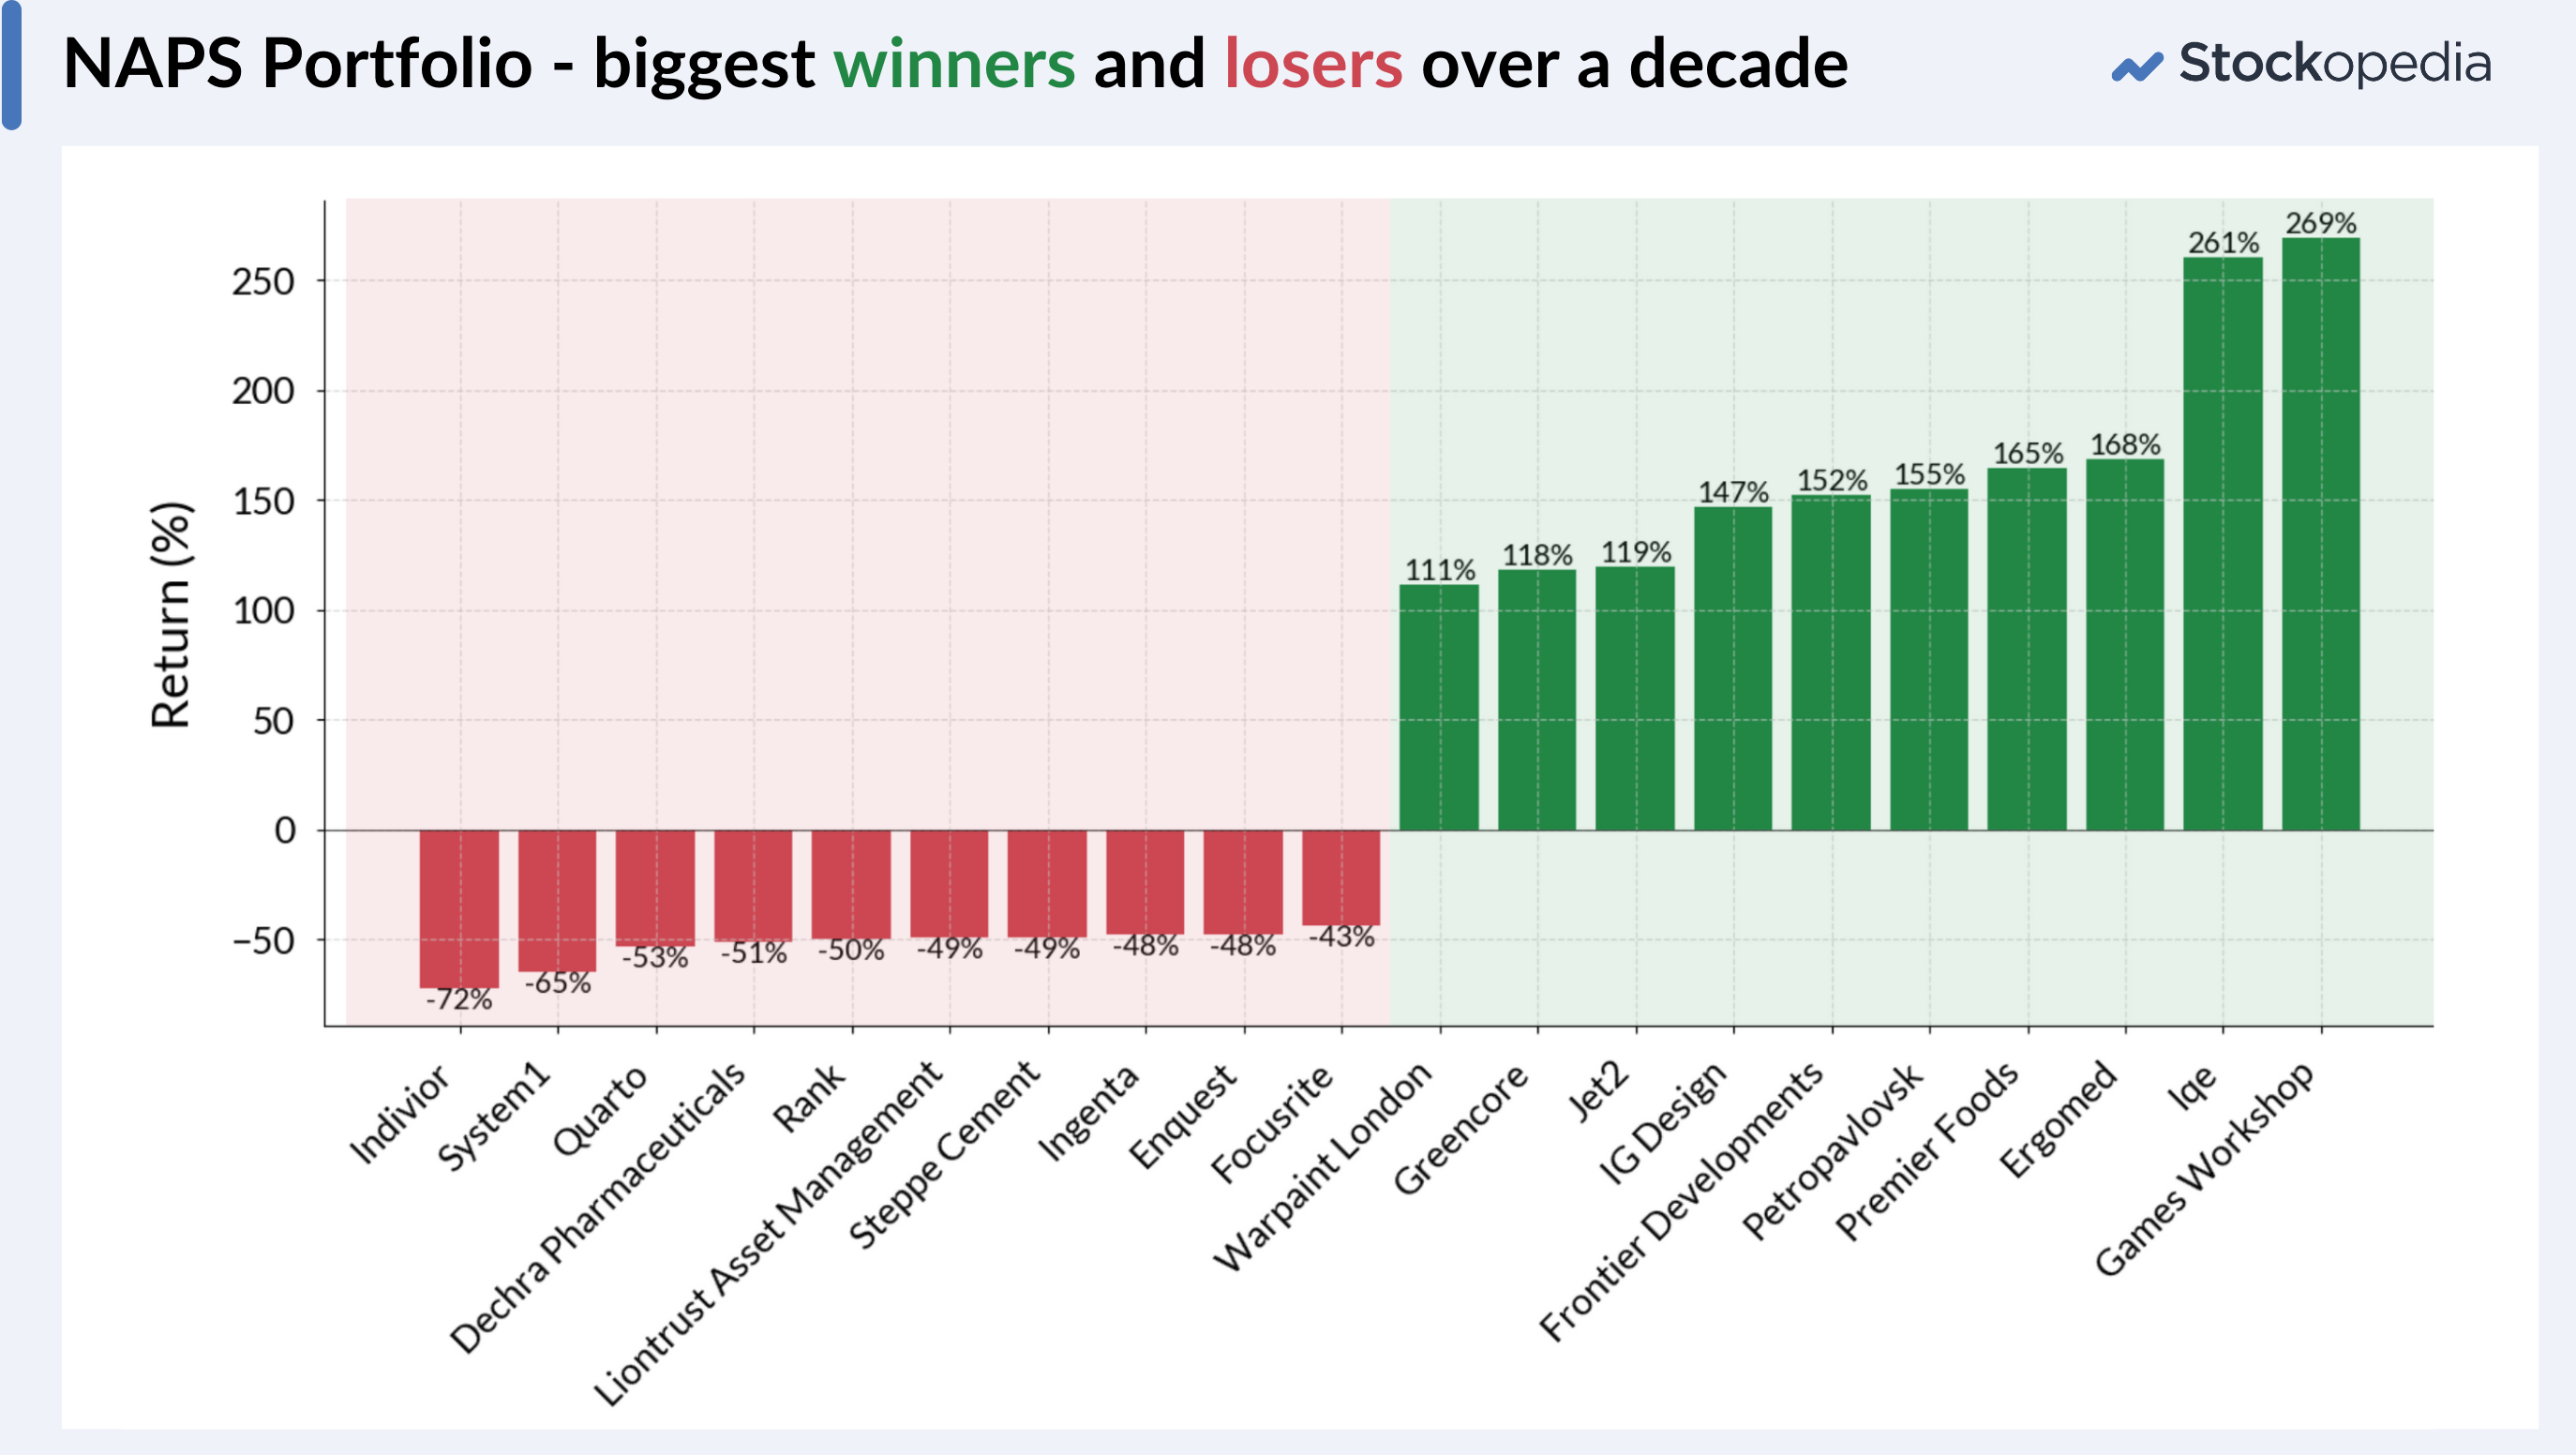
More than this, the small edge of the StockRanks guided the portfolio into some fabulous names. Games Workshop and Jet2 standout as two of the biggest multibaggers of the last decade, but the process also owned some great stocks in their best winning years. Warpaint last year, Frontier Developments and Ergomed in the pandemic, IQE in its fabulous 2017 run as just a few.
Your portfolio needs both anchors and sails
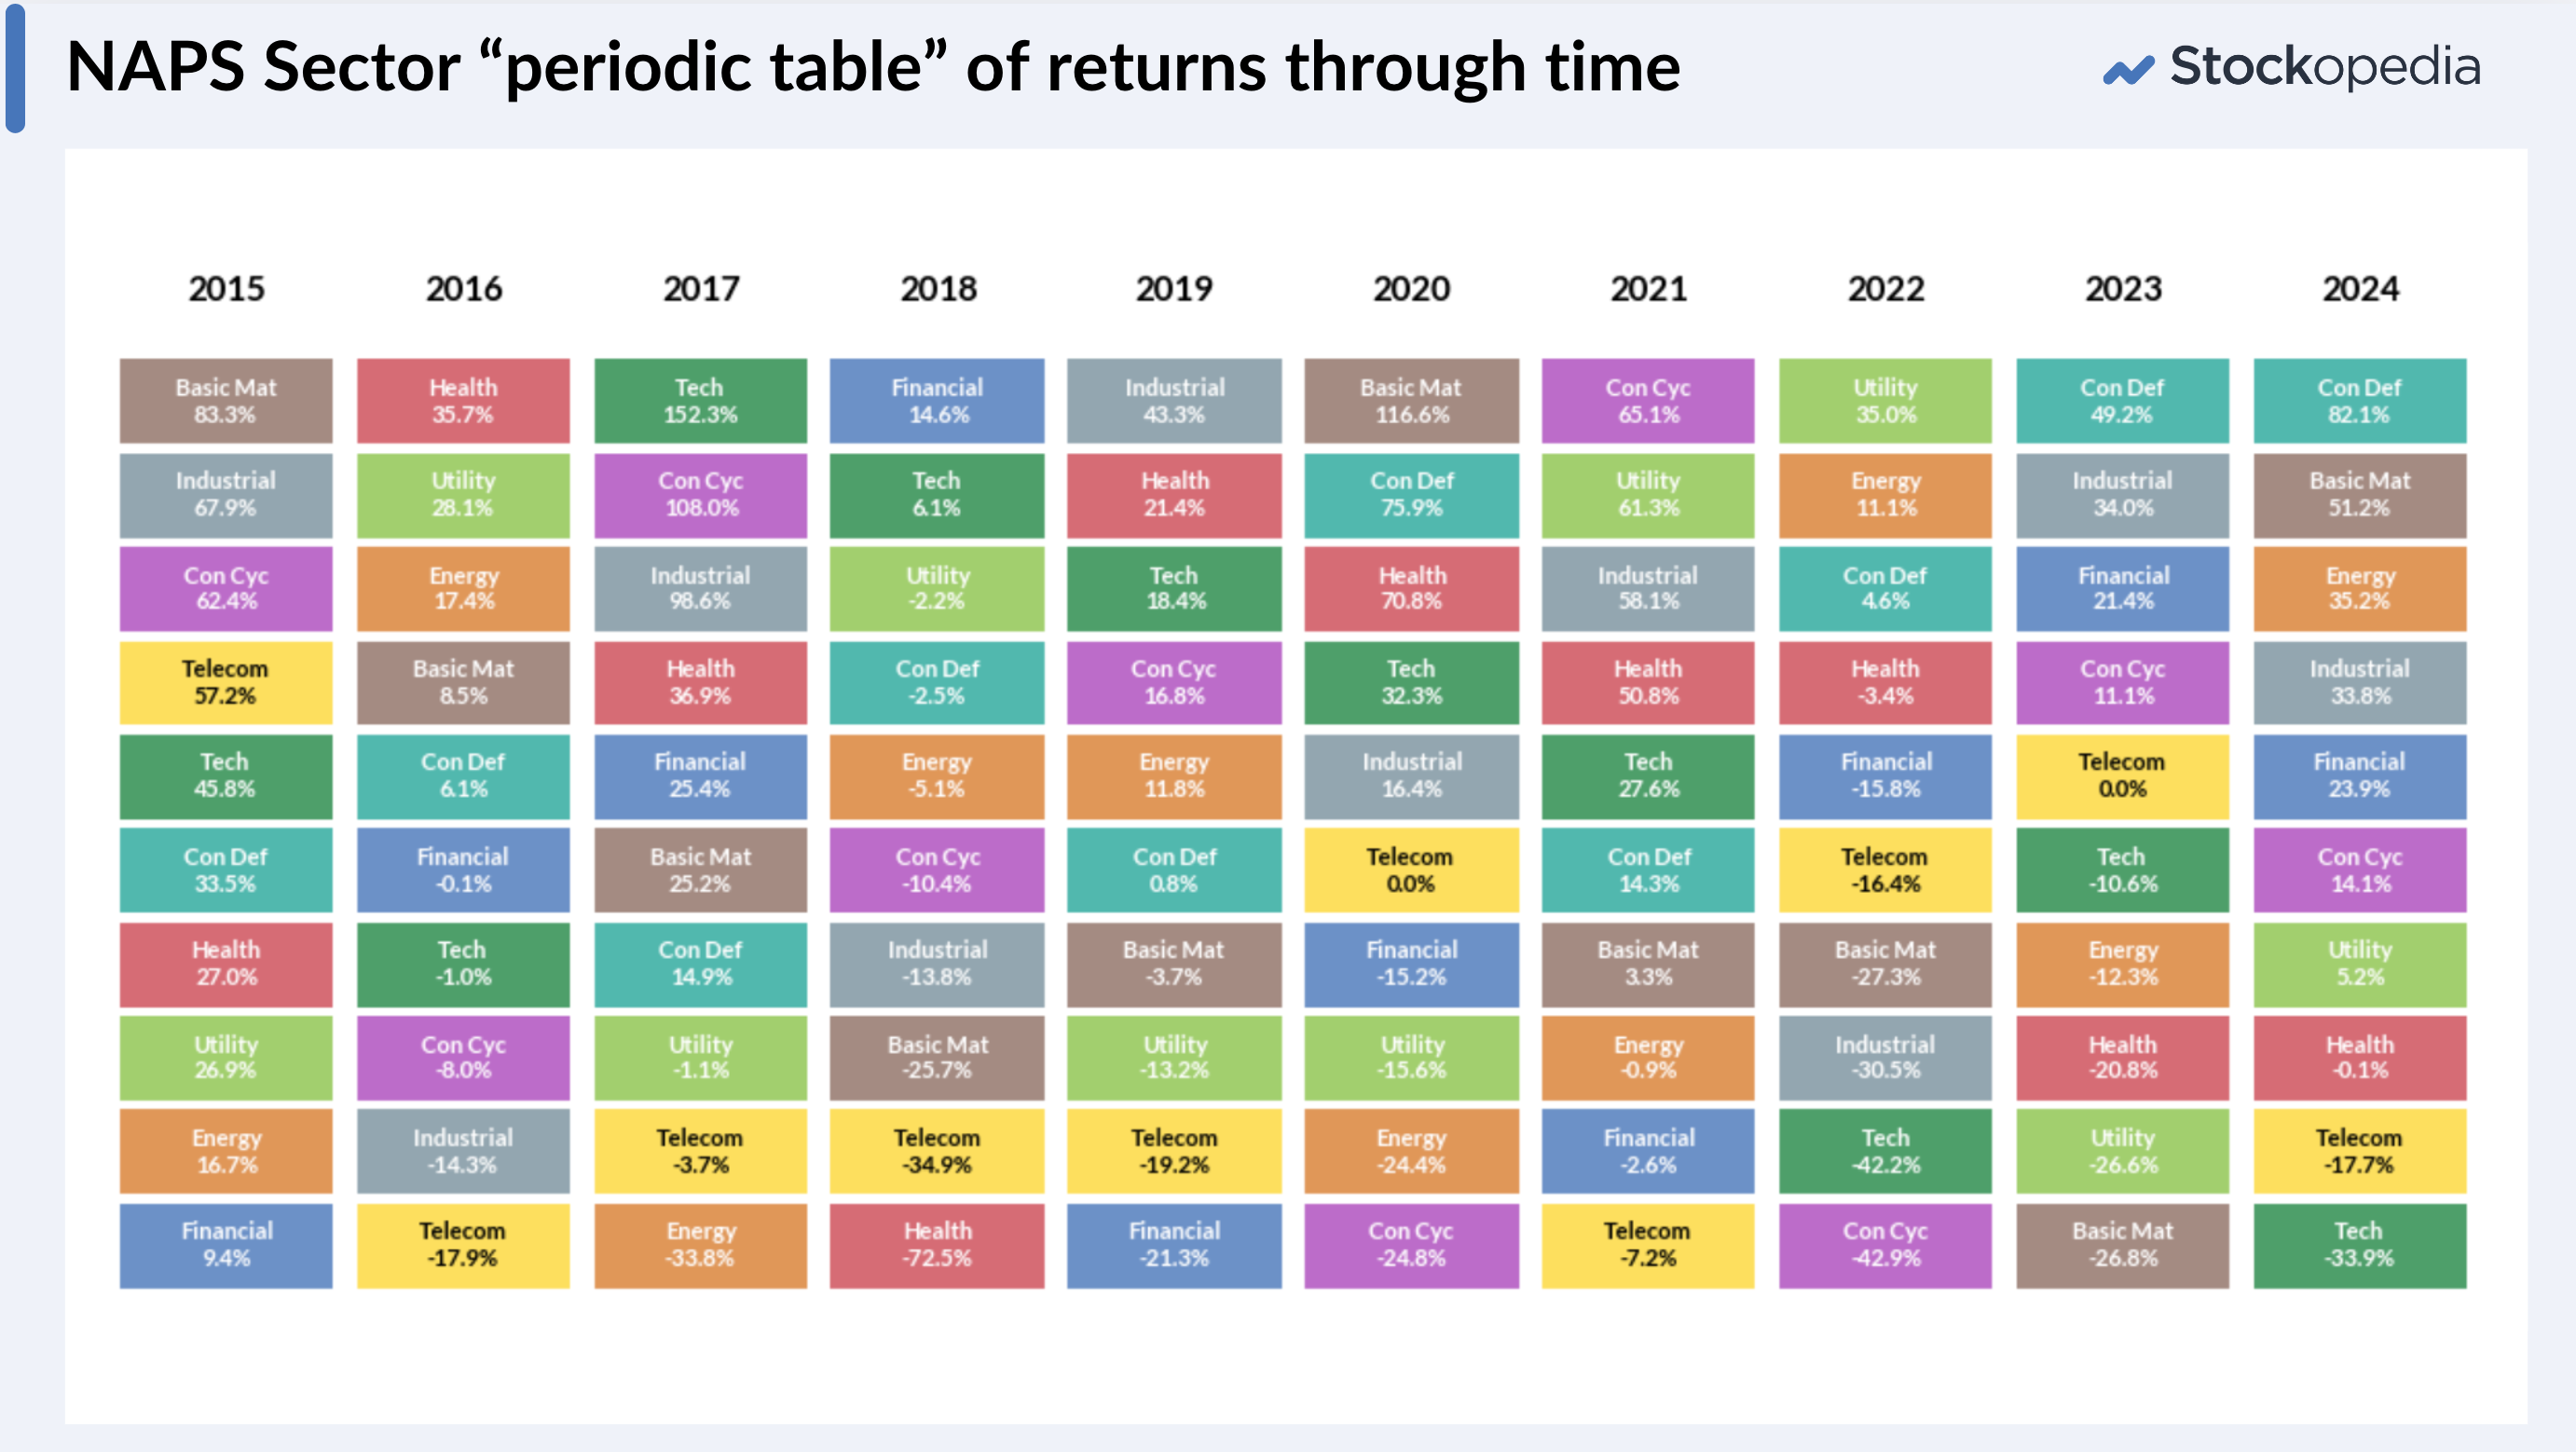
Think of your portfolio like sailing a ship in the open seas. You need an anchor to shield yourself from storms and sails to catch the winds. That's why the NAPS has always invested across all 10 market sectors. You might look at the below and think “I’ll avoid telecoms, financials and energy” - but there have been significant periods in the past where financials and energy stocks dominated returns. You never know which way the wind is going to blow next.
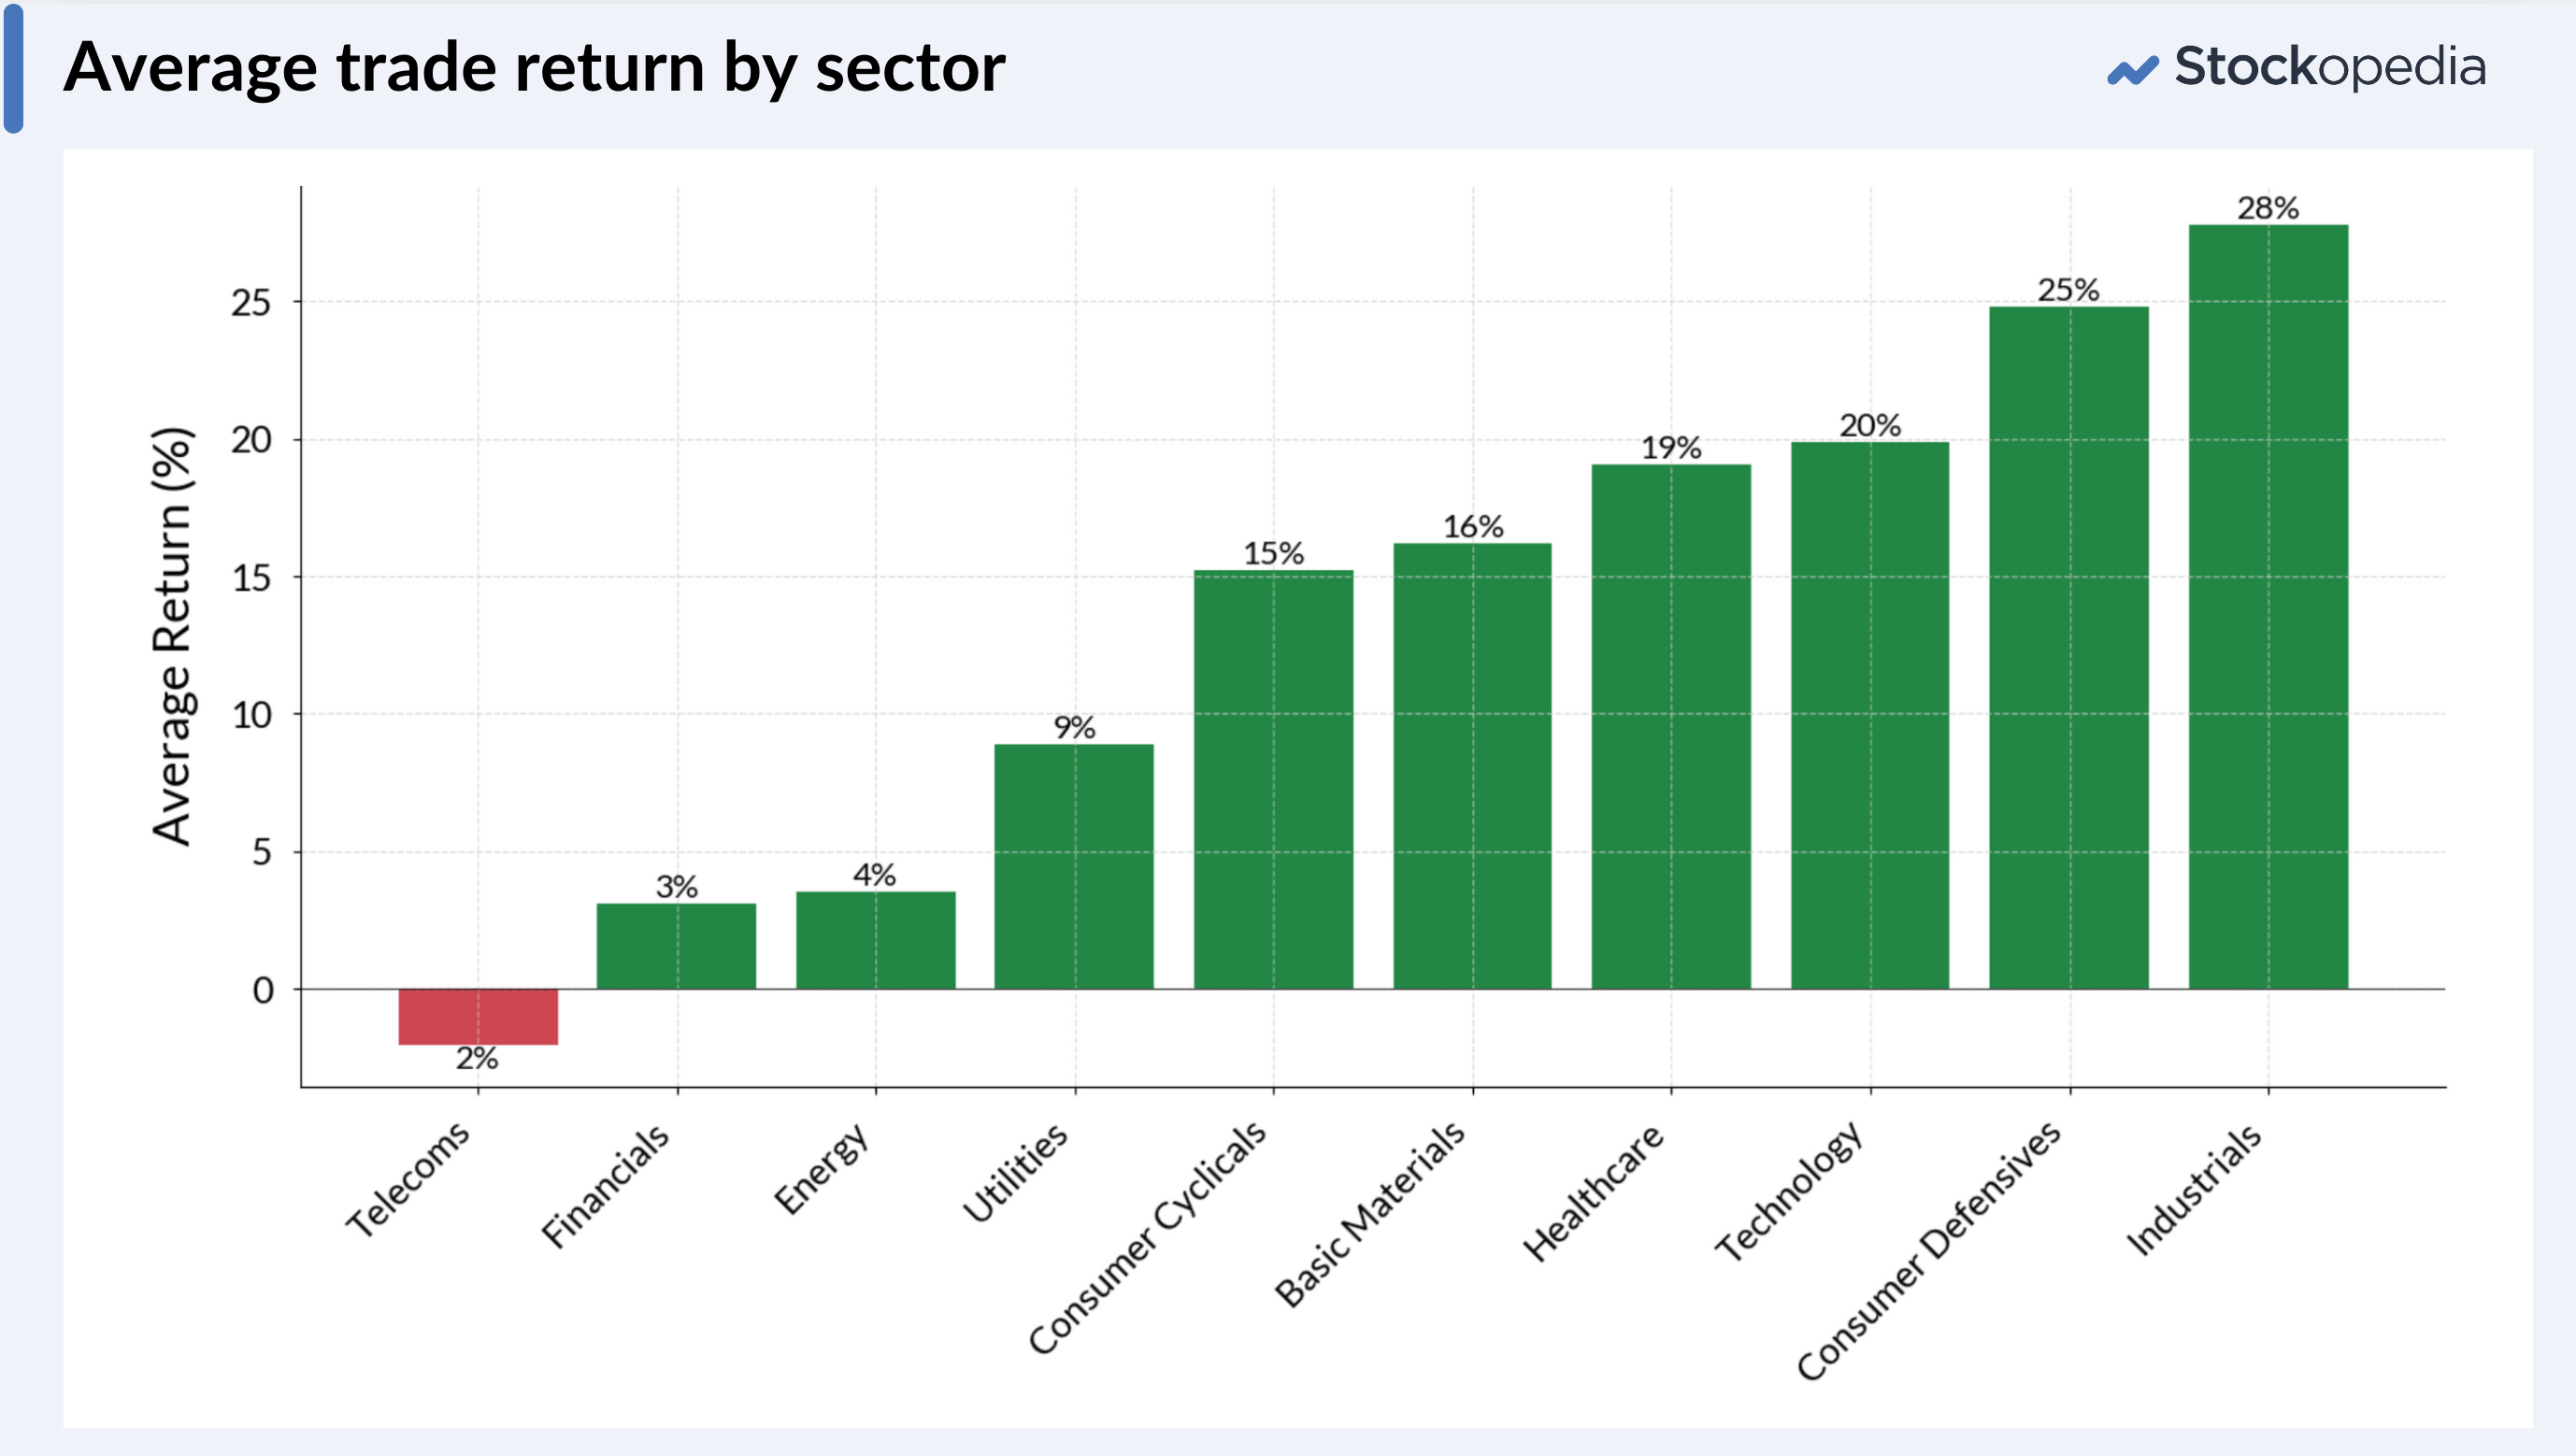
Likewise, many investors completely avoid Utilities (and miss out on multibaggers like Yu Group as a result). But, along with other defensive sectors like Healthcare and Consumer Defensives, Utilities provided great ballast in the pandemic years and bear market that followed. You never know when the next rotation is on. One year’s sector winner can be next year’s loser - I can’t completely prove it, but I do believe the NAPS diversification approach has provided resilience and return in equal measure.
What’s next for the NAPS?
At the start of the year I did say this might be the last year of the NAPS. Some of you were disappointed to hear that. So I am definitely going to be publishing a new set of 20 shares according to the rules of the NAPS rules at the start of the year. It may be briefer than usual given this rather substantial early performance review.
The NAPS principles of high factor exposure (QVM), broad diversification and annual rebalancing have worked exceptionally well. But as time has gone on, I’ve become intrigued about how to take this further. Rather than only investing on an annual basis, there are catalytic events happening all year in the stock market. Can a more active, event-driven approach generate higher returns than the NAPS? Or will an active approach just lead to all the ills mentioned in the article. I’m not saying I'm keen to take a full discretionary approach, but there are many ways to skin the systematic cat.
So watch this space. We will be developing a broader range of model portfolios to cater for more investor preferences, and will keep you updated in the coming months.
(NB - all indices and portfolios performance histories quote capital returns which do exclude dividends. The NAPS has generally had a 3% yield, which is comparable with the FTSE. Transaction costs not included.).
Disclaimer
This is not financial advice. Our content is intended to be used and must be used for information and education purposes only. Please read our disclaimer and terms and conditions to understand our obligations.
98 comments
Thanks for the webinar, very interesting
One point that came up in the webinar was the use of a trailing stop. As I err towards momentum/trend following, I use this as my most common form of exit.
So I would be really interested to see what would happen if you ran a trailing stop and, if a stock gets sold, simply replace it with the best stock in that sector. If there are no suitable stocks, wait until there is.
This would mean no annual balancing; you simply hold each stock until they trigger the stop. This way you should(!) not miss out on any huge runs, while keeping downside risk under control.
My guess is that you might need to run a relatively wide stop-loss to avoid over-trading, but I would be very interested to see the results as a potential model for the more hands-on type of investor/trader
So if you have a list of things to test, could you potentially add something like this to it?
Thanks
Thanks again Ed for doing all this. Just read the e-book you linked on another post. Really enjoyed it. Easy reading and well written. Definitely worth the read. It answered my question of is it better to change the stocks in NAPS during the year. Yes it is! Quarterly. But the downside will be trading costs and in the e-book you mention the costs out weigh the percentage increase. Well that really depends on the size of pf and the broker costs! For those interested in Naps, you really want a pf size of £100k or greater imo. So based on £100k, 20 trades would be 40 trading costs per year (buy and sell) where quarterly would be 160 trade costs. So a lot then depends on which broker you use and their costs. I personally use IWEB where I can only trade uk stocks, but the cost per trade is just £5. So 40 trades per year will cost me £200 and 160 trades will cost me £800. With a £100k pf that works out at 0.2% and 0.8% costs of the £100k pf. So it can be profitable to re-evaluate the pf each quarter. And chances are not every stock will need to be swapped out.
I like the idea of KISS. Selling stock that drop below 72 Stock rank.
When selecting stocks, if there is a choice, an idea may be to choose the stocks that have smaller market caps as your e-book points out that smaller caps in general have bigger moves up compared to larger caps.
Lots to think on. I sure the e-book will help me improve greatly. Thanks again.
Could you post the link to the ebook please GMtrader. Many thanks
https://www.stockopedia.com/ac...*1mi6cqw*_gcl_au*NDk4MDY1MjcuMTczNDAyMzQ3Mi43OTMyNjI4MTUuMTczNTA3NDg4Mi4xNzM1MDc0ODg1
Many thx
You won't change all the stocks each quarter, some will still qualify again. However a bigger cost could be the spread. Smaller stocks tend to have wider spreads. There is also stamp duty when buying. Costs are more likely to be around 2-3%, each time you buy and sell.
Stamp duty isn’t paid in sipps or isa. Yes you would need to watch out for the spreads.
Yes it is.
Maybe you mean AIM stocks?
All mine are in ISAs or SIPPs, l'm paying stamp duty on all apart from AIM shares.
Probably just me that seems to but only aim shares
'Are there any exemptions for stamp duty on shares?
Your UK share purchase will be exempt from stamp duty if your trade is valued at £1,000 or below and you’ve bought privately, without a broker.
Shares bought in eligible companies on the Alternative Investment Market (AIM shares) are also exempt from stamp duty.
Other stamp duty exemptions include UK gilts, corporate bonds, shares in an IPO, and ETFs'
Stamp Duty on Shares Explained | Stamp Duty at ii - ii
No mention of SIPPs or ISAs.
The real benefit to this is if you have a large fund where you want to preserve your holding to then be able to live off the profits each year. Or if you can start it in your 20’s when you have the time to see it compound. An example of this would be to setup a 20k sipp for an 18 yo so that after 37 years they can retire at 55. Even just £20k invested would return over £800k in 37 years
Too late, l've already retired.
Lucky you. I’m thinking further ahead though for daughter and granddaughter.
@gmtrader - it's not just broker costs you pay. The issue with quarterly (or semi-annual) rebalancing is that you have to pay the bid-ask spread on every transaction, and stamp duty on buys. These costs completely dominate any additional return you get from quarterly rebalancing over annual.
I made the huge mistake of attempting quarterly rebalancing in my first systematic portfolio in US stocks. The spreads and costs completely ate it up. I gave up after 2 quarters.
The UK NAPS (right now) have an average bid-ask spread of 1.2%.
If you traded that 4x per year - that's a 4.8% return you are giving up, plus up to another 2% on stamp duty plus more on commission etc. Call it 7% costs.
So that's more than 50% of your return gobbled up by costs.
Quarterly rebalancing in a NAPS approach doesn't work for this reason !
A quarter of the portfolio quarterly - that's fine, but the whole portfolio quarterly - not a good idea.
Ahh that explains then. Thanks for the reply.
'I made the huge mistake of attempting quarterly rebalancing in my first systematic portfolio in US stocks'
Of course, for US stocks currency conversion costs were probably an additional drag on performance.
Yes - that didn't help !
Ed,
A factor that you haven't discussed here but was included in your selection process in the past is Market Cap. I would expect the market to shift fairly slowly between presently favouring large cap to the established long term position of favouring small cap. Is there any way to anticipate that change and incorporate it in a NAPS selection process?
For a period in the middle of the NAPS history, I experimented with not only adding constraints across sectors, but also size group buckets, I even added in risk rating buckets.
All these constraints do is reduce the average ranking. They sort of reduce the degrees of freedom - and I felt those constraints were smothering return potential.
I eventually became comfortable that the sector diversity created enough size diversity - normally a third small, third mid and third large cap.
You can of course add whatever exclusions you like to your own rules (eg no large caps) - if you want to target small caps.
I do feel the current rules overweight large caps at the bottom of down markets, and small caps at the top of bull markets - so there may be a timing overlay that can counter this.
That depends where you are located, the broker and whether you buy in an lSA or SIPPs or not.
Some accounts you don't need to do any conversion, it is all in US$s. In an ISA yes everything needs converting into £. I pay 0.5% forex fee but there are cheaper platforms. US shares have much narrower spreads, most of my trades are around 0.1%. No stamp duty. But you do lose 15% tax on dividends.
Often my US trades are cheaper than UK ones.
European trades are far more expensive, even on large caps.
I wonder why I said probably, Rusty.
Why are you talking about spreads and stamp duty? I only mentioned currency conversion.
Because it is all about the costs.
This influences my investing a lot, but I can't quite let go and become fully hands off.
I'm always reminded of Mrs Doyle and the tea master in Father ted.
"Take the misery out of tea making"
"Maybe I like the misery!"
Matth - I think you raise a good point and one I would like to address more fully (probably not in a comment!).
Essentially, the NAPS is the simplest, systematic manifestation of an investment philosophy. That generating strong returns is not about the stocks - it's about the characteristics of the stocks.
The principles can be applied on a discretionary basis, without such hard rules as the NAPS.
In essence:
There are lots of ways to craft stock picking rules around these principles. And also to wing it with a bit of discipline!
Sounds good to me, I may do it this next year because I'm a lazy, uneducated sort of person.
Great article, thanks. Have you been approached by any of the Fund Managers to replicate? It's amazing that the NAPS have outperformed all of the fund managers over the period - It makes you wonder why they bother when they could design a similar systematic system at a fraction of the cost and outperform in the market.
Some stocks may not be suitable for funds, too illiquid, and fund managers think they know best.
I'm sure with AI there will be a more systematic approach. Problem with AI, it littered with errors, at the moment.
I'm tempted to try a rolling NAPS, buy two shares every month. This means I get to feed my human desire to get involved, after 1 year I will be rotating 2 shares a month, something to look forward to. Now with only 10 sectors, what criteria do I fill the other 2 months with?
Just pick the top 2 stocks under Top stocks, assuming you don't hold them already. If already held then work your way down. How are going select different sectors? It is a job to find 2 in some sectors, above 90 stockrank.
When I just tested the Naps method over the weekend I found one top ranking sector company Haleon only scoring 80, but it's momentum score and value invested by a large number of well known institutional shareholders soon put any doubts to rest.
Yes - this tends to always be the case in Healthcare and Technology especially.. These are premium sectors, so the ValueRank tends to be low. As a result the QVM gets dragged down too. But these sectors also often host great growth stock performers - high QM stocks that keep on going. So it's best not to have a StockRank cutoff at all for the NAPS. Best to just sort the sectors by StockRank and select from the higher ranked stocks.
Having 2 from some sectors does not make sense to me. Some sectors have only a few stocks but other sectors, have loads of high ranking stocks, such as Financials and Industrials. Industrials also have a wide range different companies, many l would consider not as lndustrial, l see Wise (LON:WISE) and PayPoint (LON:PAY) are in that sector, as well as Galliford Try Holdings (LON:GFRD). Wise (LON:WISE) l consider to be a Technology company or maybe Financial. You will get far more diversification from Industrials than 2 telecom stocks or 2 Ultilities.
In recent years, I've bought just one from telecoms and one from utilities, and topped up with the highest ranked 2 stocks from 2 other sectors. So you end up buying 3 in those other sectors - normally industrials and consumer.
Telcos and utilities are v small sectors, so it makes sense.
It's missed some stars due to this rule - eg Yu Group (LON:YU.) in 2023 just missed out - but it's sensible.
It looks like you are having fun testing the naps method as well Rusty. Just as you found some catagories have low stock ranks, although I was able to find Hikma and BXP pharmaceuticals at 94 and 97 ideally placed in health, but struggled to choose a couple of suitable technology telecommunications stocks with dismal returns from BT and Vodafone. I ended up as suggested by Ed, preferring to only select BT and add in industrial stocks including Wise, Paypoint, Galliford Try and Costain, and also Journeo and Cohort, thereby perhaps defeating the idea of choosing just one from each category?
Great work Ed,
Recent cataclysmic events with my own stock picks drew my attention to your article on the Naps method, which seemed way too simple to be believed. Still suffering PTSD from the worst week of Ftse stock falls for several years I set about testing your method, setting up a screen then folio, which I backdated to show British stocks purchased on October 1st, just before I joined Stockopedia and at the start of quite a flat period of general share growth for the funds I was invested in at that time. You won't be surprised, but I was amazed to see that my trial portfolio gained 16% in value over this period and in a steadily rising slope, unlike the wild fluctuations, which showed in my actual portfolio which eventually lost 2%. The most telling aspect for me was the final trading day when after a week of Ftse losses my actual portfolio showed a loss of 1.1% compared with my trial naps portfolio of just 0.3% . From here on I am certainly converted to this method which is a clear no-brainer, figuratively and literally since the work is done for us.
Do please keep up the good work.
The NAPS portfolio looks great. But it is focused only on UK companies. And I was wondering: wouldn't it be a more resilient (and maybe better performance) portfolio if it was diversified across more geographical regions (like US and Asia)? I would love to hear your thoughts on that. And if the answer is yes, would it be possible for you to provide some guidelines for people who would like to create such an international NAPS portfolio?
I'm not sure why going international would be sensible? The NAPS approach is unproven internationally. But very very proven nationally. If it ain't broke etc....
You can do it yourself if you subscribe to those regions. Problem based in UK, many stocks won't be available, even large parts of Europe are not available, on my platform. Buying stocks from Asia is even more difficult.
Just a reminder here of the power of compounding. Say you want to set up one of your kids for life and made a one off contribution into a sipp of £60k (the max amount you can pay into a pension per year). Add in £12k for the tax relief. So you start with £72k.
After 30 years compounding and presume you do get a 15% increase per year, then you would have £4.76m if my maths is correct. Not a bad return.
during webinars you've mentioned selling when the stockrank falls below 75 - have you back tested this with the NAPS, replacing the sold stock with the next ranked stock in the sector? It's simple, mechanical, and easy to implement so fits in well with the general ethos of the portfolio.
The only issue with that is sometimes there is a glitch in the system or some data is missing, so the Stockrank can fall for no good reason. You may see this on the charts on the Stockreport screen. It would be very annoying, if l sold because of a data feed issue. This happened on quite a few stocks about 2 years ago, one of the quality scores went missing.
thanks for flagging this, wasn't aware there was an issue.
The problem with a hard StockRank rule with the NAPS is this - different sectors have different highest StockRank levels.
So in industrials there are always 98/99 stocks... but in Healthcare or Tech it's not uncommon that the highest ranked is 75-85.
So it's not that viable to sell at a fixed SR rule in this strategy, as it's invested across all sectors.
I have an unfinished research project that I want to share that explores the "90/70" buy/sell idea. More to do before I share.
How do you decide which one to choose, if you have more than 2 shares in the same sector with the same stockrank.
You can pick the top one. Even if they have the same score, on the list they are in order. I exclude ones with high debts and wide spreads. But in some sectors you may have 1 stock, l find this with Health, Telecoms and Ultilities sometimes.
The stocks are actually ranked as decimals underneath the hood. When you sort in the screener or a table, I believe the highest ranked is at the top.
NAPS is a fantastic idea both as a guideline and an absolute stock selection. Whilst I'm interested to see what more active variations on a theme might do I'd like to see NAPS continuing and see if the method maintains its resilience over the next decade.
Very interesting article and glad to see that NAPS is still performing well. I considered running a NAPS portfolio a few years ago but in the end decided on a specific tracker fund, the Vanguard Global Small Cap Index fund, as the long term performance is as good as the NAPS portfolio (eg. up 250% over 10 years) but with smaller drawdowns. However, not as exciting as NAPS! What both techniques have in common is that they do not rely on subjective judgement from a fund manager.
This is great! Really informative & useful ( apart from the ridiculous metaphor of an anchor in the open sea; like a chocolate teapot!) otherwise- love this sanguine non emotional NAPs strategy !
NAPS was the first thing that attracted me to Stocko. I was dimly aware of the concept of the investor as their own worst enemy, and suspected I might fit the profile.
I think it would be great just to continue what has worked so well. I wouldn't tinker with it, honestly. Nothing beats the S&P!!!
I'm interested to tweak and back test some ideas, especially with regards to U.S stocks. Is there any way to set up a Naps screen for a specific date, I e Jan 1 2024, so I can see how they would have done.
@GloucesterBob - there isn't a way to do this at present. We can do this behind the scenes, so I'm sure we'll add it to the product in time. All the data viz we do is based on our archive databases, so there will be lots of good ideas to come to the product in time.
The problem with the US markets, is the vast number of stocks, you will see many with same high ranking scores.
The top Stockranks have not performed very well in the US, Momentum has been far better performing.
Hi Ed,
I can’t speak highly enough of the NAPS approach. As someone who has always been interested in investing, the portfolio structure and method has been the best method for me to learn.
I decided to use the NAPS approach for the bulk of my SIPP in 20/21. I thought the track record at that point was sufficient to give it a go. My year begins in August, so I’m always making my own selections rather than following your January/July structure.
Year 1 (Aug 21 - Aug 22) I was fortunate to catch the massive summer-of-2020 updraft. That first year had Luceco (LON:LUCE) as my biggest winner (+167%) with Hummingbird Resources (LON:HUM) the biggest loser (-23%). I think Hummingbird was actually below the market cap limit, so not sure how it snuck in! All in all, a 48% return on the year. 15 of 20 stocks were winners. Easy!
Year 2: Reality check time. An overall decline of -6% - but considerably better performance than the rest of the portfolio which I had picked myself! Six winners out of 21 (Marshall Motors was bought and I recycled into Vertu. MMH was a great return, but Vertu ended up -17%). Biggest winner was Airtel Africa (LON:AAF) at +70%. The biggest loser was Ros Agro (LON:62UL) - the Russian agri conglomerate and “victim” of sanctions. It was suspended and has subsequently delisted from LSE. At the time, I was also holding Ferrexpo (LON:FXPO) and sold - but forgot to consider the Russian side of the equation. Macro lesson! Ros Agro had been performing very well up until that point, but ended up being a wipe out. Extraordinary circumstances and it would otherwise have been a winning year.
Year 3: Treaded water. -0.5% overall. Biggest winner ME International (LON:MEGP) +50%; biggest loser Shearwater (LON:SWG) -60%. Eight winners out of 20.
Year 4: Back to winning ways. +19%. 13 winners out of 20. Biggest winner Gulf Marine Services (LON:GMS) +102%; biggest loser Spectris (LON:SXS) -14.3%. The portfolio was actually +24% 10 days before “selling day” but was hit by a mini crash. It is what it is - and I figured I would be recycling into cheaper prices anyway. At selection time, I also had a dead heat between Coca Cola HBC AG (LON:CCH) and Warpaint London (LON:W7L). The former was +17%, and the latter +90%. No prizes for guessing which one I picked.
Year 5: A poor start - actually mirroring how last year went. Currently hovering around breakeven depending on the day.
Things I have learned:
1, I really understand my psychology - although I definitely haven’t tamed it! That first year I developed and RNS addiction. Everything was going up and I read everything. It did really help me understand the language and the nuance (along with the SCVR commentary) of each update. I wouldn’t have learned half as much if I wasn’t so literally and metaphorically invested. Year 2…and I wasn’t anywhere near as enthusiastic, but I can now spot a profit warning at 20 paces.
2, Diversification is king. I knew it before, but the NAPS approach lives and breathes that and gives you a balanced portfolio starting point. It also means (see 1 above) that I don’t have as much free cash to invest on a whim, which I have a tendency to do.
3, That diversification has introduced me to a wide variety of businesses and sectors. I have a much greater understanding of how they work. This has definitely helped my general knowledge of investing but also helped me in my professional life. Regular RNS reading gives you an instinctive feel for how the economy is performing.
4, Also on the psychology front, a self-imposed guaranteed exit point (ie August) means that I don’t have to worry about getting out. If it wins it wins and vice versa. It has definitely helped me ride the volatility and sleep at night. We are always, ultimately, moving up and to the right.
5, The overall dividend yield is around 3%. It’s a significant component of the return. At current rates of inflation and interest, it’s beating inflation and gives up 1% to a 12-month cash account. Inside a SIPP wrapper, all the capital gain is 100% upside. Yes, there are reasonably chunky dealing charges but they are dwarfed by what I would be paying a fund manager.
7, I’ve rolled over gains so that my position sizes increase as the portfolio grows. This allows me to compound gains. I’ve moved from c.60% of my SIPP in NAPS to c.80%. As of last year, I’ve bought some Vanguard FTSE Developed World UCITS ETF USD D (LON:VEVE) as my benchmark. I outperformed (including costs) by 1.5% last year.
6, I’ve discovered shares I want to hold for the longer term. I’ve got to know some businesses really well as a result, so even if they don’t qualify for the following year, I move them into the 20% discretionary part of the portfolio when I think there is a multi-year opportunity.
7, The power of momentum. Another one of those psychological things. I would never, ever have bought shares showing momentum before. One look at the chart and I would consider the boat had been missed. NAPS shows the boats often keeps sailing on.
8, But the 12-month horizon is about right. Many of those flying shares do ultimately slow down/stumble/crash as the years pass by.
9, It is still advisable to do SOME research before actually buying and selling. My best example of this was EMIS (LON:EMIS^J23. When I bought, I didn’t realise it was in a takeover situation. I was in a rush and just trying to get through 40 trades. Once I realised, I thought it was going to give me a decent arbitrage return between the share price and the takeout price. What I wasn’t bargaining for - which accounted for that spread - was a CMA investigation which EMIS lost at Phase 1. The shares subsequently dropped by 25%. I sold them all with the rest of that year’s NAPS portfolio on August 11, 2023, precisely 12 hours before the CMA approved the takeover at phase two, resulting in a 25% increase in the share price!
9, I’m not scared of losers. They obviously p*** me off, but you need to lose some to win more.
10, A system, a set of rules, boundaries and guardrails is massively helpful for me. I can learn within it and I think the story of the last 10 years, when it has encountered a variety of market conditions, shows that downside versus the market is limited. Upside in the good times feels magnified.
So, thanks Ed for a brilliant system that has taken a novice to novice +1. There is lots and lots still to learn but I feel like I’ve had a fantastic education and a decent return in tricky markets.
I’m really interested in how you might tweak, potentially to maximise downside and minimise downside within the year. I did sell a position one year on a profit warning (Centamin (LON:CEY^K24) which turned out to be very wise, but I haven’t adopted a hard and fast approach. Similarly, Gulf Marine Services (LON:GMS) peaked at +150% last year before closing at +102%. It also qualified for this year’s list so we roll on.
I look forward to the update!
@Honey Badger - that is the most terrific comment and case study on applying the NAPS - congratulations on sticking with the process after the tough 2 year bear market. Let's hope better times are ahead.
I calculate you are running at 12.2% annualised plus a 3% dividend - which is terrific.
The 12 month fixed selling rule has so many benefits. You are right to point out that many big winners do ultimately stumble. IQE was a classic example in 2017. It more than tripled, then fell all the way back - but was only in the NAPS for the rise !
There is a phenomenon known as "volatility pumping" which shows that rebalancing actually increases returns. Stocks are volatile and often rise too much, or fall too much - especially among mean-reverting value stocks. Yes, we do say "run your winners" - but not every stock is Games Workshop - the vast majority aren't - especially in the UK. So rebalancing can be exceedingly powerful.
And yes - momentum is hugely powerful, and as PIs we are best placed to ride it !
You should copy and publish your comment as a full article as it will get more readership (click "New Post" in the Discuss sidebar) and more direct replies.
Many thanks Ed. I have done that!
@HoneyBadger, what a fantastic summary! I'm of the same mind for all your points and hope you keep us updated in future years too. I agree with Ed, this deserves to be published as a standalone article.
Really insightful post, @Honey Badger.
I think the timing point is worth exploring in more detail. For example, there must be a point during the year where the Stockranks are most reliable/valid, which could then be the optimum time to start/refresh a NAPs portfolio. This could be once the majority of companies have published their half-year or end-of-year results, or at another time where the data could be considered most fresh.
@Ed, I'm not sure if this is possible but it would be really interesting to run a model NAPs portfolio starting at the beginning of each month during the year and see if any particular starting month leads to better results over a 12 month period.
Kieran
I’m curious too whether a refresh of the chosen stocks done every 6 or possible 3 months would be beneficial or turn out to be detrimental.
That is already done by SNAPs in July. SNAPs l don't think has performed so well.
I used to do that, every month, a lot depends on the market. There is quite a bit of luck involved. I know Ed, swapped Yu (LON:YU.) for another stock, at the last minute, that had a big impact on the results.
I did a NAPs this year, about the same time as Ed, but got quite a different selection. I had Serabi Gold (LON:SRB) which has been a big winner this year. This may get selected again for next year as it is currently ranked 100.
Hi Kieranj077 and Ed
Doing a month by month simulation of NAPs would be a great experiment, as not only would it give a sense of if the starting month was relevant, but also smooth out the results by giving us more data points.
David
It is easy to do your own and now we have 25 folios, more capacity.
Hi Rusty,
I mant back testing a month by month selection, over the last ten or so years that Stockopedia has data for.
David
I see. Not sure that reveal much, the best time to buy is after a big fall, see early 2020, if you started in April, 2020, you would have done very well.
You can browse the Top Stockranks but that is adjusted quarterly l believe.
Yes, unfortunately to do the timing analysis properly, access to StockRanks data based on a specific date is needed, so the Stockopedia team would need to do this. Using the folios approach isn't really feasible, as it would take a VERY long time (many years) and a lot of effort to try and get valid results.
The alternative could be for a feature where the user (us) can select a date on the screens page. The StockRanks would then be visible for companies as they were on that specific date. This could be as simple as just including StockRanks, or extended to other data points. The feature would be interesting as it would start to open a form of back-testing for subscribers, which could then help the overall community.
@Honey Badger - thank you for your experience of NAPs. Have just started in the world of investing and coming across posts like yours give someone like myself a glimmer of light at the end of the proverbial.
Many thanks Ed, for a very interesting article about the outstanding results achieved by your Naps approach to investing. Having only just been on board since October, I have already made elementary mistakes in underestimating the risks posed by small cap "highly speculative" investing and found myself daily checking to ensure that alternative investments more soundly placed are steadily erasing these. However, although freed from the herd mentality to be possessed of the magnificent 7 technology stocks and buying mainly UK, I still can't ignore my recent reading that climate change, demanding alternative electrical power supply, is likely to require massive input from companies such as Siemens and Prysmian cables. While obesity and various unproven health benefits may be markedly affected by drugs manufactured by Novo Nordisk and Eli Lilly. Keen as I am to devote all of my funds to trying out the Naps method for myself, I am struggling to resist the temptation to buy into these latter stocks as well, in the hope I will be doing so at a rock bottom price.
I shall look forward to reading further suggestions or lists of stocks you may consider ideally form the basis of the Naps list going forwards and to investing some or all of my funds into it depending on whether I can let my head rule my emotions (:-)) .
Many thanks, Ed, for yet another extremely well-written, well-researched and thoughtful article. I did wonder if it contradicted your recommended use of stop-losses, but I see that there’s already been a discussion of that.
I use Stocko a lot and shudder to think how I invested without it. My portfolio is entirely UK and I hope the team won’t dilute their efforts by venturing further afield.
I use a few funds, mainly for diversification, and this is the first year I’ve arranged my records so that I can differentiate between the performance of funds vs shares.
I know that what I’m about to tell you can hardly be considered statistically significant, but it does broadly support your headline theme. My returns for 2024 ytd (including dividends):
Funds: +6%
Directly-held shares: +28%.
Happy Christmas to you and all the team.
One more thought about stop losses - if you sell a share because it hits your stop loss, why not rerun the initial selection process across all sectors and buy the share that comes out top?
@John O'Gaunt - thank you for the kind words. So good to see your DIY direct stock picks outperforming your funds.
Hi Ed,
The NAPs approach and data-driven insights are exactly the reason why I subscribe to Stockopedia. I think sometimes there's such a focus on the regular commentary, which is interesting, but there are probably many of us who want to reduce the noise and focus on making portfolio decisions backed by data. I think this is evident by the number of people that read and interact with these NAPs articles.
Since being a subscriber, I have been hoping that Stockopedia would launch more front-end features to help with this type of portfolio management. Maybe this is unfair, but I feel like little or slow progress has been made in the past few years.
There are a lot of features that could be added which could help subscribers form their own NAPs strategy and manage their portfolios better. For example, rather than just showing the StockRank graph on the Stockreport, show the QM, QV, VM ranking over time. Alternatively, give an option through a screen to track and alert when a StockRank changes by a certain % over a time period, rather than just the past day or >90 on the dashboard.
These are just a couple of quick examples, and there’s a huge number of features that could be added that I think would take Stockopedia to the next level. The StockRanks are unique to Stockopedia and could be used in many ways to really bolster the experience (they are great!). From the comments, it sounds like there are some developments in the pipeline, which would be good to see.
Kieran
@Kieranj077 - yes we do want to add a lot more StockRanks and other proprietary data features. We have many design ideas, and many ideas for how to improve the factors that feed into the ranks too. We're a small team in a complex domain, with a very broad feature set - so we can only push in one area at a time. We're improving our news offering at the moment - but I'm confident we can develop some proprietary data signals from news - so watch this space.
I joined Stocko in December 2016 so I've followed the NAPS with interest along the way although I never could get on board with it because I'm too addicted to the daily soap of opera of private investing. The idea of setting and forgetting at the start of each year would be almost unbearable (but incredibly time saving!).
This article really encapsulates for me the essence of all that is so brilliant about Stockopedia. At various points throughout the past eight years, I have gone back and rewatched some of Ed's early videos to remind myself of the power of the Stock Ranks. I've then cleaned up my portfolio by throwing out the speculative dross that has a tendency to creep back in after one too many PI focused videos where some punter or fund manager is talking a great story about their latest great idea. Each time I've done this, and got my portfolio looking green again across at least two columns of Q, V or M, then my performance has improved.
Although, I have used Stocko for only eight years, I have been investing since March 2012 and I've entered every single transaction from that date into my Stocko portfolio. My past ten year performance has been 300% but that includes all dividends which comprise around a quarter of that total return. Given that the NAPS has returned 250% over the same period not including dividends, it makes me realise that I would have done just as well, if not better with just a single hour of admin across an entire decade versus the countless hours I have spent on this hobby!
I'm really looking forward to the future model portfolio articles and to improved analytics around market and trade timing / sentiment signals and all of the other incremental improvements which will no doubt continue to add value to this fabulous resource. In the meantime, I plan to try and be more NAPS and less CUPS (Chaotic Undisciplined Portfolio System).
Merry Christmas to Ed and all the team at Stocko HQ and wishing all members a successful 2025.
@johnsmith68 - that is such a generous hearted and inspiring comment. What a terrific performance you have achieved! I think the discipline you've shown to manage your portfolio so well over such a long time period is outsanding.
I will pass your comment onto the team - many thanks and Merry Xmas to you too.
Well done Ed. Clearly a great performance. I was going to ask how this could be improved on with a slightly active approach or whether that would end up becoming negative to the end outcome but you already are thinking on that.
I do believe it can be improved on. Selling stocks on profit warnings maybe. And selling when smaller stocks just get too far ahead, to then be brought back. Maybe with use of moving averages. I imagine there are plenty of ways that may give better results. It is certainly something to look into and I am looking forward to seeing what you come up with.
Many thanks for doing this. It has certainly given me plenty to think on and if a system could be made up that then produce say 15-20% annual increase then I think many would end up settling for that.
Have you looked into a NAPS for the US? It would be interesting to see how that would perform.
Great piece Ed, as always.
It is very encouraging to see the long-term performance. I have maintained a real-life NAPS portfolio for the last 3 years although, given my typical bad timing, only this year is really performing well, but that's just life. The longer you run the process, the greater the rewards, hopefully.
I am glad that you will be continuing to publish your NAPS 20 stocks at the start of the New Year - it is certainly a big part of the value which I get from my Stocko subscription - but if you can also suggest other "tweaked" model portfolios such as those in your recent articles focussing on high flying mid-caps and US stocks, even better. The one using US stocks would be enough for me to expand my subscription to cover the US.
Also a good reminder that it's not particularly healthy to check stock performance daily, and one of the main points about NAPS is to relax and trust the process...
Derek
@derekwhogg
Yes, unfortunately, the current trailing 3 year period (back to December 2021) has the lowest annualised return of all the lookback periods for the NAPS. In other words, the last three years have been poor. So I do empathise with the frustration! I did create another chart that illustrates this a bit more clearly.
I haven't quite ironed out a few minor issues in the chart below - but will share anyway.
It's notable that the portfolio has only compounded at 2.4% over three years - but on every other lookback timeframe it's done rather well.
The last 12 months (back to mid December 2023) have been strong. I did note back then that the market had given a few strong timing signals (oversold, then uptrend), and it's good to see they were prescient. Sadly the AIM All Share did revert back into a sideways/down trend. These are the headwinds that we deal with in the UK market - but quality shares can still do well!
Another excellent article Ed. You and the rest of the Stockopedia staff have produced a substantial amount of quality articles throughout the year. Well worth the subscription fee.
Great article and please do stick with it as I think you’ll find people value more highly than you realise
Thanks Ed, a very uplifting article showing how StockRanks has worked in real time since 2015. No hindsight bias, no subjective nonsense. The ride would have been difficult but well worth it! The drawdown graph shows how hard it is to be a private investor, even if you are picking some of the best companies in the UK market. I actually think the annual rebalance makes a lot of sense. Both private and institutional investors are influenced by the calendar year.
I also look forward to seeing a broader range of model portfolios maybe with some active component. It may work well, even better than the NAPS. Whilst some could focus on growth, others could be more defensive in nature (suited to a retirement portfolio). However, I would encourage you to keep doing the NAPS portfolio. So simple in concept and it has worked brilliantly so far. Well done!
I suspect performance could have been even better if you were to sell stocks on the first hint of bad news, rather than hang on to them for the year - 1 profit warning usually follows another. As the stockranks naturally lag, by the time bad news/performance is reflected in the stockrank, you've mostly taken a big hit.
Would also be interesting to know if the same approach would work on the top ranked US stocks.
Will you many stocks left?
It is easy to get spooked out winning shares just on some negative news. I nearly sold Synectics (LON:SNX) at 200p, their CEO suddenly died.
l could have sold Wise (LON:WISE) around 750p, their HY was not that good.
Serabi Gold (LON:SRB) some problem with licences l seem to remember, shares went down about 15%.
I find US stocks bounce back quickly.
Slightly different thing, but l did a study on using stop losses on NAPs a while ago, stops around 10-12% would have worsen the performance, some of the big winners, around 150%, did fall around 15% before their big rise. 15% stop loss be about break even, 20% slight improvement but probably less tge trading costs.
@af20001 - I think your idea has a lot of merit. We are working on some news improvements currently, that I do hope are going to bear some "data fruit". The ideal would be to generate a database of "ahead of" or "behind" trading statements, as per the article I wrote last week, and possibly define significant shifts in sentiment. Apparently sentiment in company announcements rarely changes (it's serially correlated), but when it does it can be rather predictive.
As an aside, I've been studying the impact of stop losses on the NAPS recently. I will be writing an article or sharing the information in due course. In summary, I find they reduce the drawdowns considerably, but cap the upside to a frustrating degree. The issue being that cash balances grow and you lose the exposure to equities. It's the "getting back in" that is hard with stop losses. Stop losses must be paired with re-entry rules. But if you've been stopped out because markets are falling, immediately buying another share may not make sense.
Edward- I assume your integrating some AI into this, could be a useful tool for these sort of price v. announcements data.
I have found stop losses to improve the NAPS performance to a worthwhile degree. Firstly I would distinguish black swan events such as the pandemic from the normal situation in which stop losses apply - I sold all of my shares at the onset of the pandemic, and repurchased when they started to rise again. Obviously I did not sell right at the top and repurchase right at the bottom, but this was the right thing to do.
As for individual stop losses, as you say there can be an opportunity loss if the share recovers subsequently. I usually have sufficient cash around to repurchase any share if I wish to - as a rule of thumb, if a share has hit my stop loss and subsequently rises by 15% or so from its lowest level then I would think about repurchasing. Obviously if the share continues to decline, then I am well out of it.
I have set up a separate folio with all of the NAPS shares in it, which is separate from my portfolio of shares held. This makes it easy to follow the progress of any NAPS shares that I have sold.
Surely it’s a major influence in some folks renewing their subscriptions. I for one find it invaluable, and gives me food for thought
Lump sum, at the beginning of the year. No stop losses or adjustments during the year, although there is SNAPs which is beginning of July.
What was the difference with the Snaps ?
Nothing really, just done after 6 months, ie beginning of July.
It's always been written as an annually invested portfolio at the start of January, but I've encouraged people to riff on the ideas rather than follow to the letter.
There are lots of variations, from sector choices, to rebalancing periods, to stop losses, to number of stocks, to ranking and filter choices.
Something i have wondered about. Maybe buying the two best shares each month for twelve months. Then sell those that are twelve months old and reinvest in another pair, this means that on average you have a much higher ranking portfolio. Although it is more difficult to include industry diversification.
I set up a NAPS portfolio as a side interest using my ISA allowance in 2023, but I deployed the cash by investing one third every three months for nine months.
I ran the full selection screener at every tranche deployment; working my way down the StockRanks but avoiding any sectors that'd I'd already filled in earlier rounds. Each share is held for one year, then the selection process is run again on its anniversary.
Over the last 12 months, my return of 9.6% is not as good as Ed's, but it's better than I could have achieved on my own, by picking stocks in a discretionary fashion like I used to do. The best performing in share in the 2023 portfolio was Kier (LON:KIE) [86%] and the worst was Burberry (LON:BRBY) [-53%].
In the 2024 portfolio, the best/worst, currently, are Pan African Resources (LON:PAF) [47%] and Team Internet (LON:TIG) [-34%].
On the subject of stop losses, I did wonder if I should have got out of Burberry sooner, but the 'getting back in' dilemma, made me put the idea from my mind. My concern, was that I would have to replace it with another share from that sector, but if the sector in general is on a down trend for any reason (financials in 2009 for example), then I would potentially be serially stopped out of one share to the next, taking, say 25% hit each time. I considered that, by sticking with Burberry, I would contain the problem rather than compound it.
I also had thoughts, for 2025, of using a StockRank exit rule (selling when it falls below 70 and replacing it with another 90+). But I haven't fully thought things through yet - it's something to ponder during the Christmas break.
Something else I had to deal with along the way, was the takeover of Wentworth Resources (LON:WEN^L23). Should I sit on the unexpected cash until the end of the year, or redeploy straight away? I opted for the latter. Of course this means I have one share that now reaches it's one year anniversary on a different date than the others in its cohort.
You might say it would be easier to just buy what's on Ed's list every January, and it certainly would, but I enjoy the process, and I feel connected to the portfolio.
Ed, thanks for the article, and please do keep the NAPS going! My favourite articles here are all the ones that make use of the proprietary Stockopedia features.
@1MCF - "My favourite articles here are all the ones that make use of the proprietary Stockopedia features."
That's good to know - and we have had a lot of feedback in the surveys that our readers want more of the data-driven articles and research studies.
The lessons that come out of all the data analysis are key really. Half the time I'm just trying to reinforce to myself the simple things I ought to already know, but that are easy to forget in the day-to-day arena of stock market self-sabotage!
Thanks for persisting with the NAPS portfolio. It adds to the pool of Stocko pool of thought and is succesful to boot.
Interesting figures. Yes some sectors do well at times, after Ukraine invasion, Utilities and Energy did very well.
I would probably skip telecoms, often difficult to find anything to qualify.
Industrials is such a wide sector, really it is everything that does not fit in other sectors, some l don't think belong under Industrials.
I have never done a full NAPs, l tend to cherry pick a few, some l hold already.
But a great way for new subscribers to start.
Another great article, it restores my faith in the UK market (a little). In the last few years it has felt that throwing in the towel and buying a US tracker was the answer.
But i think with the UK index on such a low P.E. it has the best prospects, especially now Trump is managing the US.