Is falling MomentumRank an early warning sign?

Can changes to a company’s StockRank and factor ranks be used as an early warning sign of possible problems ahead?
Some recent examples have made me think this area could be worth examining. In this piece, I’m going to consider two case studies before taking a broader look at the data behind this issue.
Case study #1: Bunzl
On 16 April I covered the profit warning from FTSE 100 distribution group Bunzl (LON:BNZL) in the daily report. What struck me most at the time was the way that the company’s StockRank had fallen sharply in March following its full-year results:
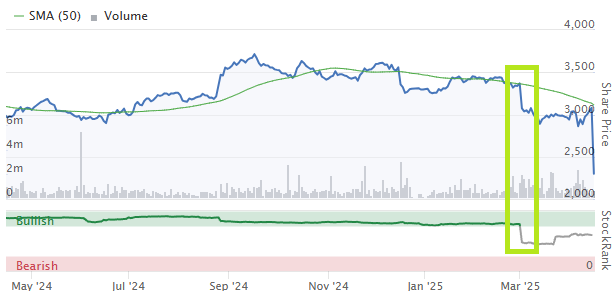
The annual results had received a poor reception from the markets, but the headline numbers did not seem to flag up any obvious concerns. Profits and margins were broadly stable.
With hindsight, the problems that triggered April's profit warning were mentioned in management commentary. Even so, brokers had only made a slight cut to full-year forecasts – not necessarily a big concern for a mature and reliable performer like Bunzl:

(Bunzl: 8 March 2025)
However, April’s profit warning subsequently led to a much more severe cut to profit forecasts – and a 25% one-day share price drop that I’m sure some shareholders would have liked to avoid:

(Bunzl: 5 May 2025)
Checking back through the StockRank history, a clear pattern emerged. While Bunzl’s QualityRank and ValueRank have remained broadly stable, its MomentumRank fell sharply following its results and has fallen further since then.
22 Feb 25 - High Flyer - the MomentumRank was high prior to its results (share price 3,336p):

Bunzl’s 2024 results were published on 3 March 25. By 8 Mar 25, its style had fallen to Neutral and the MomentumRank had fallen sharply (share price 3,076p):

The company’s Q1 trading update and profit warning was published on 16 April 25. Here’s how Bunzl’s QVM ranks looked two weeks later, on 5 May 25 (share price 2,380p):

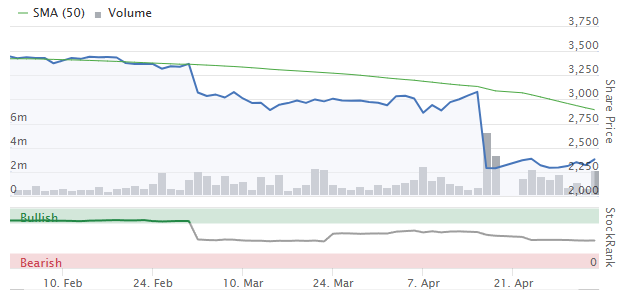
The dominant theme is the rapid decline of Bunzl’s MomentumRank, which has fallen from 93 to 8 since 22 February. Its share price has fallen by 30% over the same period:
Case Study #2: Celebrus Technologies
A week or so later, it was the turn of small cap technology group Celebrus Technologies (LON:CLBS) to deliver a dose of bad news to shareholders – see our analysis here.
However, what struck me again was how the company’s StockRank had come off the boil well before the worst of Celebrus’s share price decline.

Checking back through the StockReport history, I saw a similar story of falling momentum.
Celebrus’s half-year results were published on 3 December 2024. These did not appear to raise any concerns - on 13 Dec 24, MomentumRank was still high (share price 296p):

However, the share price began to head south soon early in January 2025. This was soon reflected in the company’s MomentumRank, which had fallen more than 20 points by 1 Jan 25 (share price: 270p):

As February unfolded, the shares continued to fall. Celebrus Technologies’ MomentumRank also continued to fall, dropping a further 28 points by 14 Feb 25 (share price: 222p):

All of this came before the company’s trading update on 22 April. This warned that sales would miss expectations this year and flagged up some potentially significant changes to both its accounting policies and a key customer relationship.
This news was poorly received by the market and left the stock trading well down on the day. This quickly fed through to a further fall in MomentumRank – although note how Quality and Value ranks were still largely unchanged.
Here’s the situation on 25 Apr 25 (share price 178p):

Celebrus shares have bounced back somewhat since then and were trading just below 200p when markets closed ahead of the Bank Holiday weekend.
However, the accounting changes announced in the April trading update mean that forecasts for FY26 have been withdrawn, as the company hasn’t yet worked out their likely impact on next year’s performance.
I think there’s a risk that revenue (and profits) may reset at a lower level, at least temporarily. Stockopedia’s Falling Star styling is also flagging up the statistical risk of further underperformance.

Investors left holding the shares now may be wondering whether to crystallise their losses or hope for a return to form. But anyone monitoring the falling MomentumRank here would have had several chances to get out at a higher level since December and might now be quite relieved to have done so.

Is there really a pattern?
In situations such as these, it’s easy to fall into the trap of using the wisdom of hindsight to find patterns to support a hypothesis. There’s obviously a risk that this is what I’ve done with these two examples.
To see if the falling MomentumRank was a signal I should consider acting on in the future, I enlisted Alex’s help to search Stockopedia’s historic database for more objective evidence of a possible relationship between MomentumRank and share price returns.
Do changes in MomentumRank correlate with share price performance?
We took snapshots of the UK market at six and 12-month intervals, dividing the market into a number of groupings. We then monitored returns until the next rebalancing date and then repeated the process. In total, we looked at data covering the last 10 years.
The groupings we chose were designed to try and highlight any correlation between MomentumRank and share price performance:
Positive M-Rank change (all StockRanks)
Positive M-Rank change (StockRank >80)
M-Rank >90 (all StockRanks)
Negative M-Rank change (all StockRanks)
Negative M-Rank change (StockRank <20)
M-Rank <10 (all StockRanks)
Semi-annual rebalancing
In this test, our selections were rebalanced every six months. The dominant trend here is that stocks with high MomentumRanks outperformed all other groupings, even including a subset with improving MomentumRanks and high StockRanks.
Conversely, the shares with the lowest MomentumRank underperformed everything else:

The Bunzl and Celebrus Technologies examples both focused on the impact of falling MomentumRanks. These stocks are represented by the pale pink line in the chart above.
Average returns from this subset across a six-month period oscillate around zero on a 10-year view. This suggests to me that shares with a falling MomentumRank won’t necessarily collapse (they may still be good businesses), but are likely to underperform shares with higher or improving MomentumRanks.
The chart above was mostly as I expected, but there were a couple of surprises for me:
Stocks with a rising MomentumRank didn’t outperform those which already had high MomentumRank;
Shares with a rising MomentumRank did not do very much better than shares with a falling MomentumRank, on average across all StockRanks.
I had expected improving momentum to have a more marked impact on share price performance. Thinking about this result, I wondered if the six-month rebalancing period was too short to allow improving momentum to feed through to share price performance.
To test this, Alex re-ran the simulation using a rebalancing period of 12 months.
Annual rebalancing
Momentum can be a fairly persistent effect, as Ed discussed recently. But for shares with weak or average momentum, there can be a lag between signs of improvement and share price gains.
I think these two characteristics help to explain what we see here, in our annual rebalancing simulation:

Over a 12-month timeframe, companies with a high StockRank and improving momentum came much closer to matching – and sometimes exceeding – the performance of stocks that already had a high MomentumRank.
The longer rebalancing period seems to have allowed improving momentum the time it needs to deliver results.
In addition, shares with a rising MomentumRank did significantly better than those with a falling MomentumRank, regardless of StockRank. These two groupings were much closer with six-monthly rebalancing, again suggesting that the benefits of improving momentum take time to be reflected in share price performance.
Final thoughts
There is no one-size-fits-all formula that can tell us the right time to buy and sell stocks. As we’ve discussed before in recent months, one key element of such decisions is buyers’ investment style and timeframe.
Long-term investors who make subjective decisions about investing might choose to argue that both Bunzl and Celebrus Technologies are suffering from temporary problems that will not disrupt their long-term growth trends.
This is a reasonable argument that may yet be proved right – or it may not. The difficulty is that it could be several years until the correct answer becomes clear. In the meantime, investors who continue holding run the risk of suffering further losses and prolonged underperformance.
On short or even medium-term timeframes, the evidence from our historic database suggests that in aggregate, shares with weak or declining momentum are likely to underperform.
I see this as a useful systematic element to consider as part of my broader investment process. It's also consistent with the academic theory behind the StockRanks and their performance over the last decade:

In summary, for investors who are comfortable harnessing the power of statistical probability, I’d argue that paying attention to changes in MomentumRank could help to improve overall returns, as part of a systematic investing strategy.
Disclaimer
This is not financial advice. Our content is intended to be used and must be used for information and education purposes only. Please read our disclaimer and terms and conditions to understand our obligations.

10 comments
Be nice if you could screen on rank history for whichever one and also add it to a chart
Had a comment on hindsight, besmirching my name, technical analysis, mystic meg, false prophets, net zero, but got excited apologies for the non comment.
Trouble is, with a lot of these indicators they are seen after the event and could be more of a buy signal than a sell.. Keep on watching, never let up.
Edit: Roland speaking from my experience with Celebrus Technologies (LON:CLBS) , I sold my holding after buying in July 2022 at 242 pence, doubling-down in April 2023 and finally selling in November 2024 at 301 pence. The company was D4T4 Solutions before a name-change and looking at the 5-year performance chart I first bought just as the Momentum was dropping. The share price first rose then trended down while Momemtum carried on rising until the date I doubled-down so holder relying on Momentum had lost out at that point in time. After that things got into sync to the point where I sold for a small profit and then we see both share price and Momentum falling together . Frankly the 5-year performance chart is a horrible sight, the type that as a mid-term holder I now avoid.
Interesting and potentially useful study. I have the same question as Cuddlesticks wrt monitoring momentum.
Thanks Roland for another really useful article.
When looking for stocks rising after a large Market fall I focus on Quality and look for 'M' rising above 66 & ignore 'V' <30 ; to try & identify those starting to move. Also based on earlier Stocko work check for a rising 'SR' moving UP over 70. Along with some technical analysis.
All in an attempt not to collect too many mange dogs.
Thank you, this could be very useful. What's the best way to track changes to the momentum rank? Can you put it on a graph?
Hi Cuddlesticks,
If you hover over the arrowhead next to a stock's factor ranks you can see the change in the last 30 days. For example, this is Bunzl (LON:BNZL) :
However, as far as I know there's not an easy way to monitor changes to a stock's MomentumRank without recording it regularly or looking up historical StockReports (using the Print button).
Roland
You can screen Momentum so as Funderstruck can flag up when rises above 66 or your own choice -
Hi Cuddlesticks,
Another way might be to set alerts for the individual ranks or their combinations. I've attached a link below, which will take you through how to set this up.
https://www.stockopedia.com/le...
This screenshot below may help better illustrate this in action.
Hope this helps!
Best,
Keelan