Screening for cyclical opportunities with tips from Slater & Lynch

This week’s article is based on a recent subscriber suggestion that I might try to screen for cyclical sectors that could be about to turn up.
This was an interesting challenge. While I did find one sector where I believe there’s evidence of widespread value and opportunity, I also found a range of cyclically-depressed individual stocks that I think could have significant turnaround potential.
According to legendary investor Jim Slater, I shouldn’t have been surprised by this. In his classic book on growth investing, The Zulu Principle, Slater says:
Turnarounds are not far removed from cyclicals and asset situations … a badly-managed cyclical often becomes a turnaround at the bottom of the cycle
In One Up On Wall Street, legendary fund manager Peter Lynch says much the same thing about turnarounds (discussing Chrysler in the 1970s/80s):
These aren’t cyclicals that rebound; these are potential fatalities … A poorly managed cyclical is always a potential candidate for the kind of trouble that befell Chrysler.
Both Slater and Lynch stress that timing is critical with these investments. Share price swings of +/-50% from peak to trough are not unusual and profit swings can be even greater.
Get it wrong and you can spend years waiting for a real upturn to (hopefully) rescue your investment. For this reason, both men emphasised that having an informational edge is often one of the few ways to get an advantage in these types of situations.
Lynch also cautions us to recognise the true nature of these businesses:
Cyclicals are the most misunderstood of all the types of stocks … because the major cyclicals are large and well-known companies, they are naturally lumped together with the trusty stalwarts
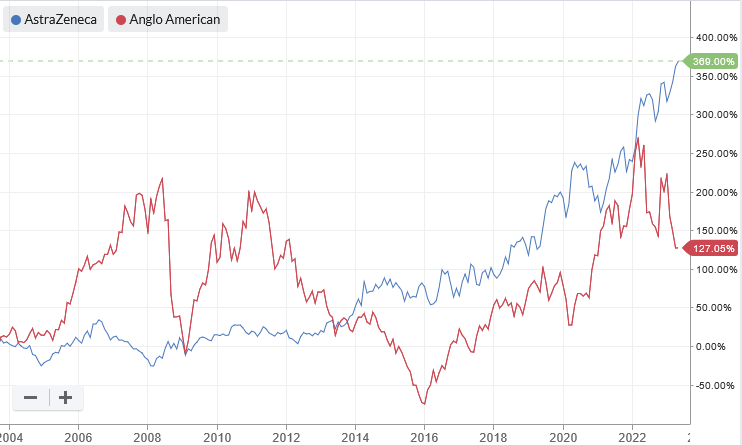
However, we need to remember that these businesses perform very differently. Consider this share price chart showing FTSE 100 pharmaceutical group AstraZeneca (LON:AZN) and miner Anglo American (LON:AAL) over the last 20 years:
I read One Up On Wall Street and The Zulu Principle many years ago, and revisited them for help with the construction of this screen. Both books are well written, entertaining and packed full of timeless investing wisdom. I would highly recommend them, whatever your style of investing.

Building the screen
Let’s get down to nuts and bolts. What am I looking for – and why?
Even more than usual, I should caution that these screen results are only an initial basis for further research. They are also unlikely to provide a complete view on cyclical opportunities today. Small changes to individual criteria can have a big impact on results. As always, please DYOR.
Sectors
Whenever I build a screen, I start by defining my investable universe.
In this case, I’ve narrowed down the market to the sectors that are classified by Stockopedia as either cyclical or sensitive.
Cyclicals are stocks whose profits tend to rise and fall fairly predictably due to external factors. Two obvious examples on the London market are mining and property.
In Stockopedia’s classification, cyclical sectors are defined as Financials, Consumer Cyclicals and Basic Materials.
Sensitives are businesses that are influenced by the economic cycle, but also have the ability to deliver long-term growth and gain a competitive advantage over rivals.
In Stockopedia’s classification this includes Industrials, Technology, Energy and Telecoms.
(You can see how your portfolio is spread across these sectors on the Allocation tab in the Folios.)
I selected these sectors for my screen and also specified a minimum market cap of £25m:

Valuation
What tends to happen in cycles is that a company’s valuation doesn’t vary quite as much as its earnings. This means P/E ratios tend to be higher at the bottom of the cycle and lower at the top, as investors start to price in the top of the cycle.
Jim Slater again:
a cyclical stock should never command a very high multiple and a low dividend yield near to the top of the cycle
For this screen, I am looking for companies whose present and forecast earnings are below their cyclical average. In particular, earnings must be well below cyclical peaks.
To try and do this, I’ve compared companies’ rolling P/E with the P/E based on 10-year average earnings (CAPE 10y). If earnings are below their cyclical average today, then the rolling P/E should be higher than the CAPE 10y.
I’ve also specified a maximum CAPE 10y of 22, to exclude companies that appear to be very highly valued based on their past earnings.

Are earnings about to rise?
At this point I’ve hopefully identified some companies whose earnings are below their historic average level.
I now need to find out if their earnings are starting to recover. What I want to avoid at all costs is buying into a cyclical downturn. I know from experience that this is all too easy to do. However, the cost can be high, as Jim Slater explains:
If someone throws a safe out of a window from the penthouse of a skyscraper, you will be severely damaged if you lean out of a window on the third floor and try to catch it. Wait until you are really sure that the cycle has hit bottom.
More prosaically, Slater says that it’s “absolutely essential that the forecast for the year ahead shows rising profits”.
To try and capture this, I’ve used the PEG ratio and rolling 1yr earnings growth:

By using the rolling PEG ratio, I’m hoping to find stocks that are attractively valued relative to expected earnings growth. Hopefully this will provide a greater margin of safety if any unexpected problems occur.
Profitability
One characteristic of cyclicals is that their profits tend to vary widely through the cycle, but their revenue often remains fairly stable. In other words, their operating margin varies a lot – the business may even report a loss at times.
We can see this if we look at Anglo American’s 10-year operating margin history:
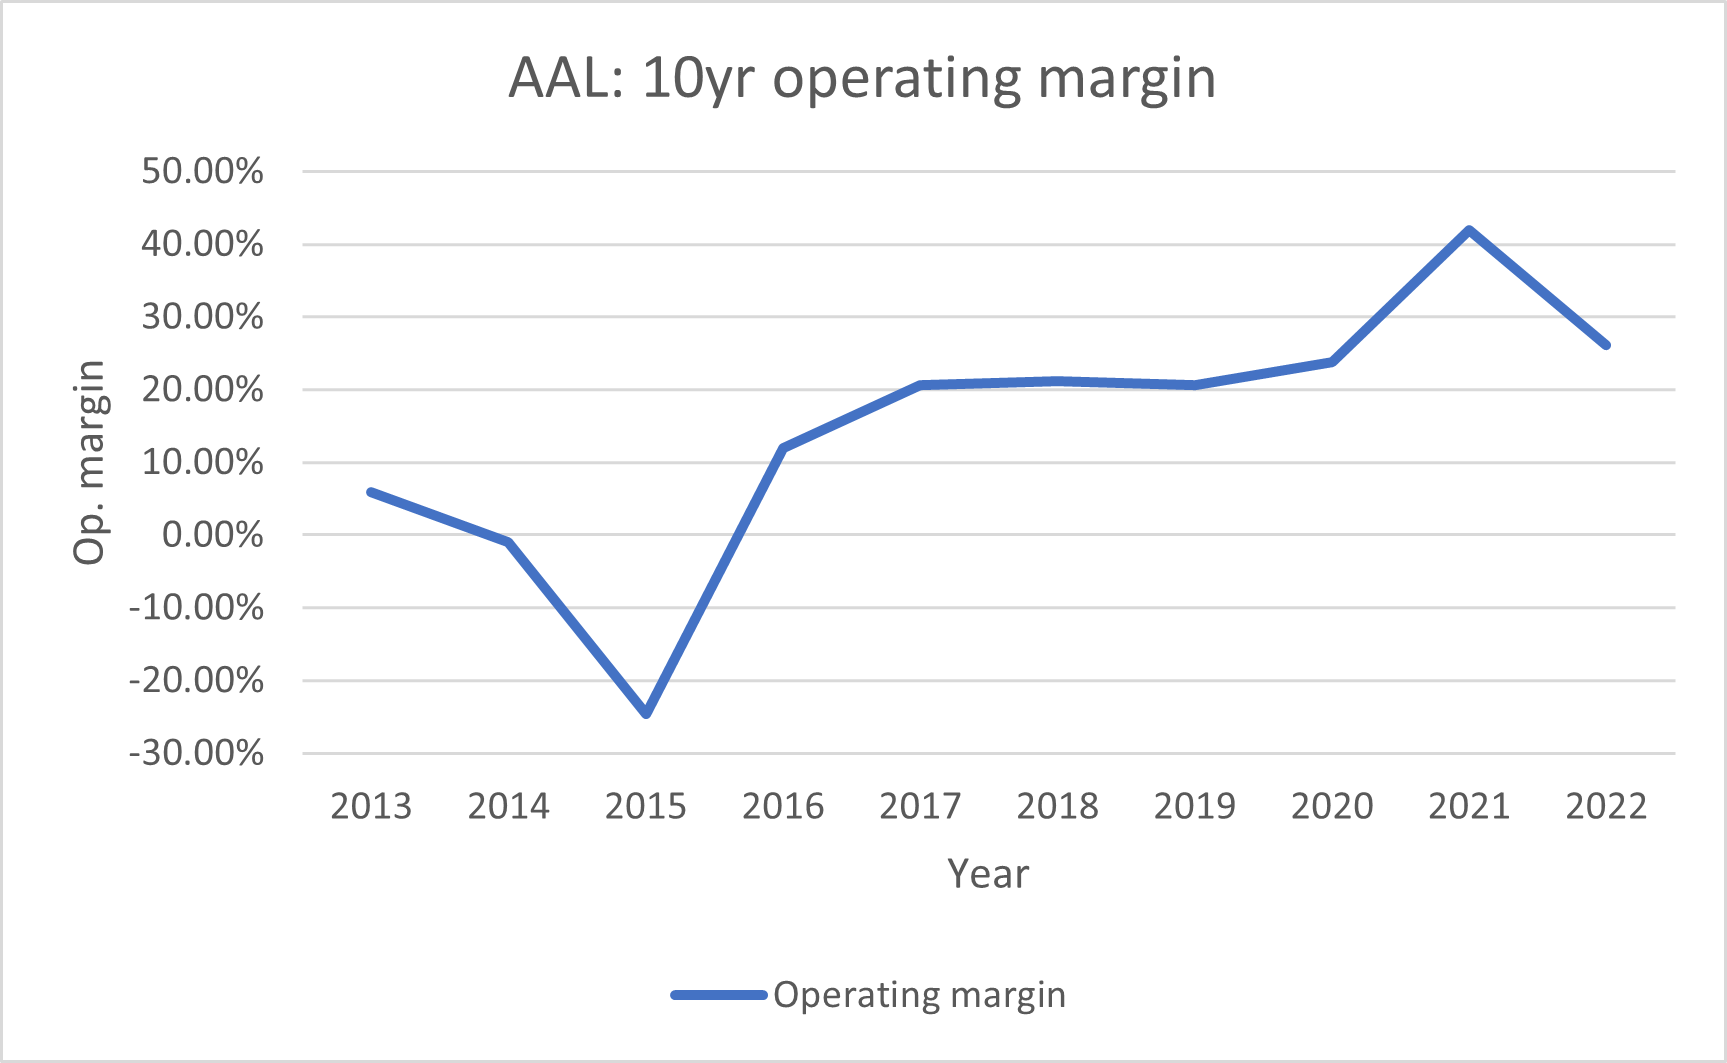
What I want in this case is to identify shares whose operating margin is below historic average levels. This should mean that when cyclical conditions improve, I’ll benefit from rising earnings driven by higher margins.
To try and identify suitable companies, I used an advanced rule comparing trailing 12-month operating margin with the five-year average margin:

Balance sheet
Cyclicals that are mismanaged or unfortunate can end up with too much debt at the bottom of the cycle. This is when – as Peter Lynch describes – cyclicals can become “potential fatalities”.
Sometimes these situations are rescued by a timely upturn or a successful refinancing. But the risks for equity holders can be very high, in terms of loss and dilution.
Right now, the rising cost of debt and uncertain economic outlook mean that I would prefer to avoid companies with very high levels of gearing.
There are a number of different ways to measure debt levels. This challenge becomes even more complex when we consider financials.
I’ve opted to keep things fairly simple by using net gearing. This compares the value of a company’s net debt with the book value of its equity.
Net gearing is a measure that’s included in the StockReports and was specified by Slater in The Zulu Principle.
I would say that prudent levels of debt vary between companies and sectors. But for this initial screen, I’m only interested in excluding companies with obviously high levels of gearing.
For this, I’ve specified maximum net gearing of 100% – i.e. net debt equal to book value. This is the maximum recommended by Slater for cylicals and turnarounds:

You can find the finished screen here - feel free to copy and modify it.
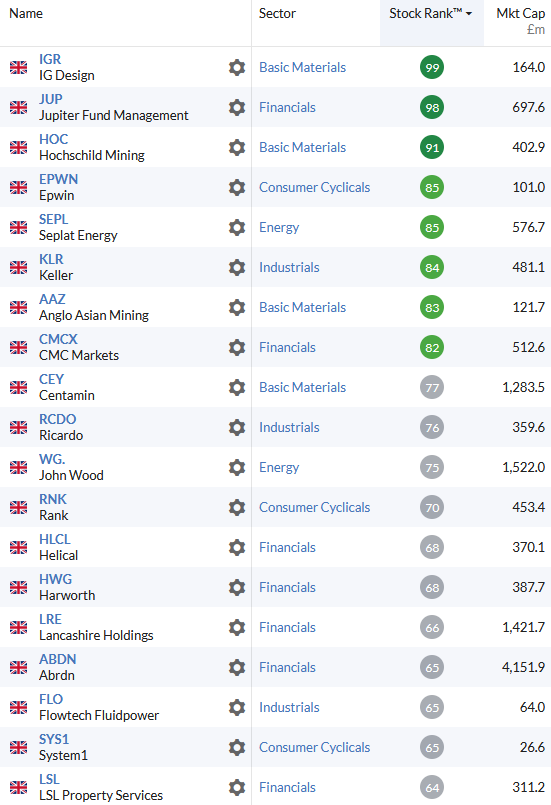
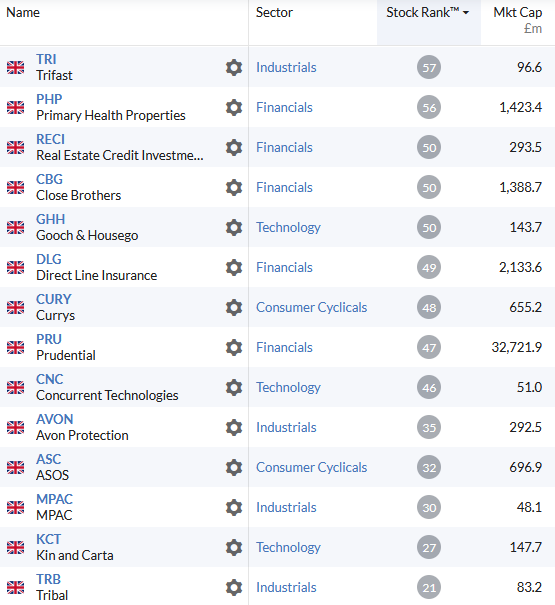
Here are the results from the screen at the time of publication, sorted by StockRank:
Other factors to consider
There are some other factors I think are worth considering for cyclical stocks, but which are harder to encapsulate in a screen.
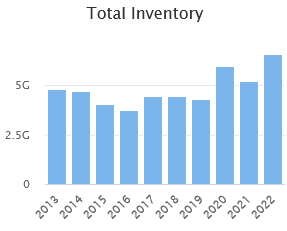
Inventories: rising inventories can be a sign that a slowdown is imminent. Both Slater and Lynch emphasise this.
Returning to my example of Anglo American, Stockopedia’s balance sheet data suggests inventories were at decade-highs at the end of last year. I will be interested to see if these have fallen in this summer’s half-year results.
Underlying growth: Most sensitives and some cyclicals have the ability to deliver underlying growth, either through organic expansion or acquisition. Measuring this isn’t easy.
Understanding this factor and making allowance for it relies on in-depth research into the business, in my view.
Conclusions
I think these screen results throw up some interesting potential opportunities. If there’s a sector theme here, I would suggest that it’s the financial sector.
I can see a number of good quality financial stocks that look very attractive to me at the moment. This includes some of these in the screen results, as well as some that didn’t appear in this list.
Beyond that, I would say there are selective opportunities in consumer cyclicals and industrials, but I’m not sure I would suggest that these whole sectors are turning up.
I don’t have a very strong view on the macro outlook – this isn’t the way I invest. I certainly would not be comfortable putting all my eggs in one sectoral basket and hoping for a recovery.
However, I am pretty confident that there are plenty of opportunities for stock pickers in the current market.
Researching these companies and digging into the financial data with the help of the StockRanks should deliver positive results, in my view. That’s the approach I plan to take over the coming weeks and months.
Disclaimer
This is not financial advice. Our content is intended to be used and must be used for information and education purposes only. Please read our disclaimer and terms and conditions to understand our obligations.

6 comments
Roland thanks for addressing this interesting and important area.
When I think about cyclicals I tend to think about housebuilders. There are no housebuilders in the screen but they are very much on my watchlist. You emphasise the importance of timing and this is obviously very important. I note for example that US housebuilders Pultegroup (NYQ:PHM) and DR Horton (NYQ:DHI) are up about 67% in a year whereas British housebuilders are fairly flat for this period although they have recovered from the Autumn lows.
The reason for the difference may lie in the fact that the US is further along in the cycle than we are, their recent CPI Inflation report gave a figure of 4.9% as compared to the UK's 10.1%. This may be partly due to the US producing more of their own raw materials rather than importing as we do in the UK. I also note that the two US housebuilders have fairly low dividends and are also practicing share buybacks, given the apparent value of housebuilders I'm surprised that this is not more prevalent in the UK.
On this basis it may be that a little more patience is required for housebuilders. It may be that the upturn is beginning but perhaps initially in the smaller ticket items. For example I tried to book up my usual guest house in London only to discover they were booked up for the next three months. I think at this juncture I agree that some careful selection and timing is needed.
The next set of CPI figures due I think next week may be very informative.
UK retail energy prices have not fallen unlike many other countries, yet the wholesale prices of gas have fallen considerably, why are we paying high prices still?
I think you are referring to the new buzzword i.e. greedflation. I noticed that Decaff Coffee has gone up by a third in Sainsbury's which seems excessive. Also British Gas lowballed an estimate for a bill so that they could charge my previous quarter's consumption at a higher rate on the next bill.
I think profiteering by companies has unfortunately played a part in perpetuating inflation.
Well not really, Ofgen set the cap suppliers can charge. Why in the UK is it taking so long for prices to fall? Wholesale prices have been down for about 6 months now. Prices are miles higher than pre Ukraine.
Putting interest rates up is not the answer, that just causes more inflation for many households.
Thanks Roland - but I do feel these types of study can become overwhelmed with stats.. I am often amazed at how certain companies are scored so high and in your study looking at Jupiter Fund Management (LON:JUP) - scoring 98 just doesn't make sense to me - I do agree that it has potential to regain some of the lost ground over the past few years - but on the other hand - there is so much competition out there - No 'moat' for these fund companies to rely on!
Hi bohenie,
Thanks for your comment. I think screens can be very useful, but they're only ever a starting point for further research.
In this case I think that's more true than usual - understanding the business and the macroeconomic context and then forming our own view is essential.
Regards,
Roland