Semi-Year SNAPS 2019 - how many stocks are enough?

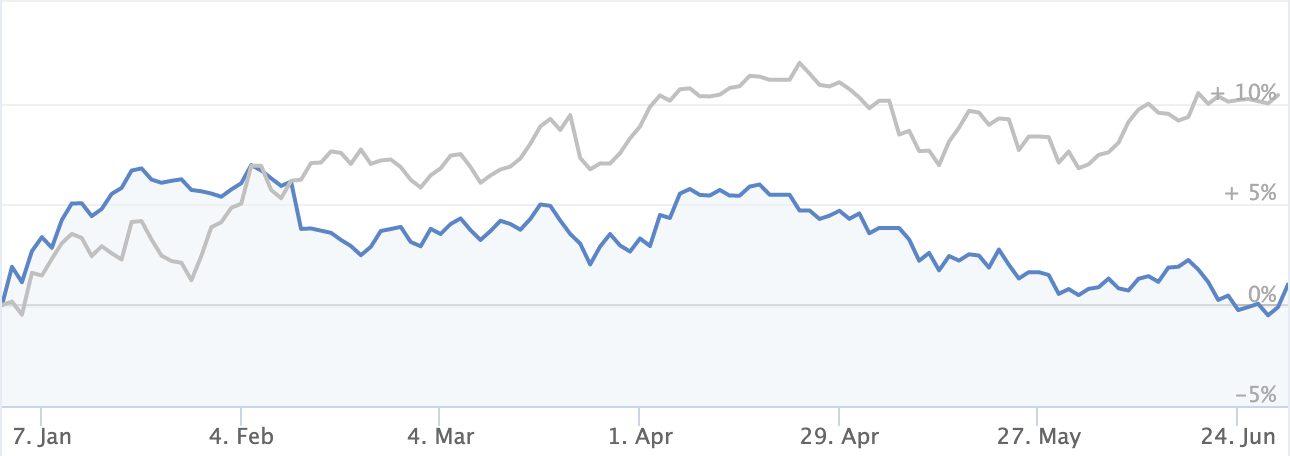
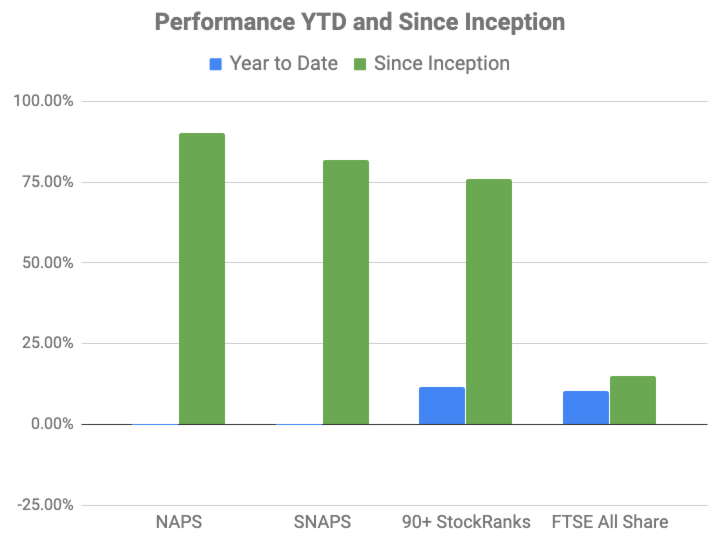
So the first half of 2019 has been a bit of a shocker for the NAPS (my 'no-admin-portfolio-system'). While the major market indices have bounced from the end of year lows, the NAPS portfolio has languished. The NAPS year to date have generated a -0.1% capital return against a FTSE All Share return of +10.4%.
As a headline figure that's very poor, especially as the 90+ StockRank set of shares from which the NAPS are selected have returned 11.3% slightly ahead of the market. This puzzling show has drained some of the outperformance from the long term results. Nonetheless, excluding dividends, the NAPS have generated a return of 90% over the last 4.5 years versus only 14% for the FTSE All Share. Given the lion's share of the outperformance has all been generated in years 1-3 the question that will be on everyone's lips is - have the NAPS stopped working?
Performance Review
As you can see in the chart below, the NAPS (in blue) has significantly lagged the FTSE All Share (in grey) year to date.
Although the picture is far healthier since inception in January 2015.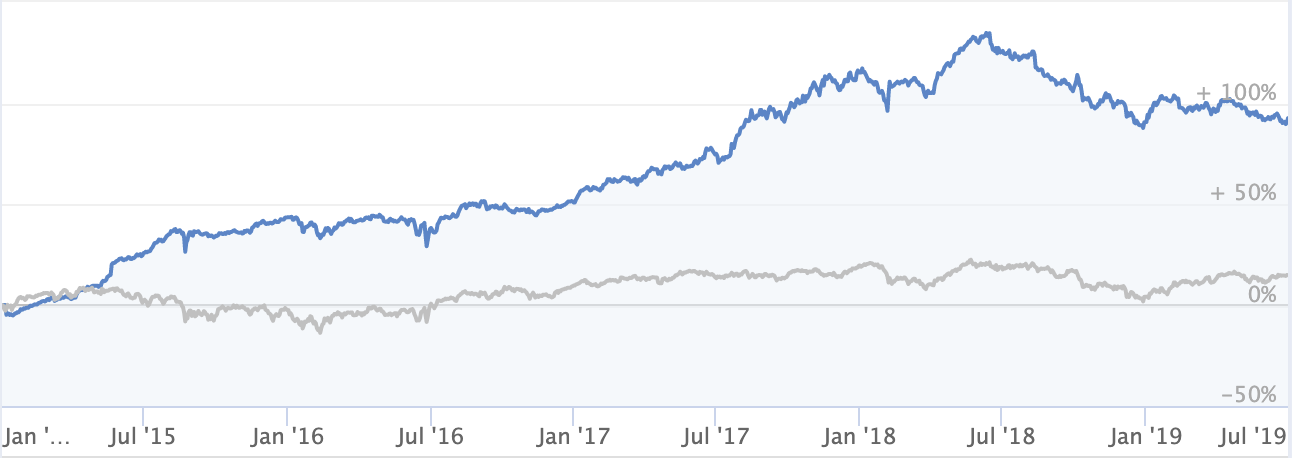
The SNAPS Portfolio, which is the semi-year rebalanced version of the NAPS, is lagging a bit further behind... with an 82% return since inception. You can see the overall numbers, year to date and since inception in the chart below.
Winners & Losers year to date
The top winners year to date have been D4T4 Solutions, Evraz and Emis, but they've been offset by a larger than usual mix of losers. The big loser for the year is Plus500. Down by 58%. After gaining 53% in 2018 this is of course disappointing. A gain of 53% followed by a loss of 58% should equate to an overall 36% loss of the starting capital invested in Plus, but the magic of rebalancing has actually brought the total loss on Plus 500 to only 0.2% over the 18 month period.
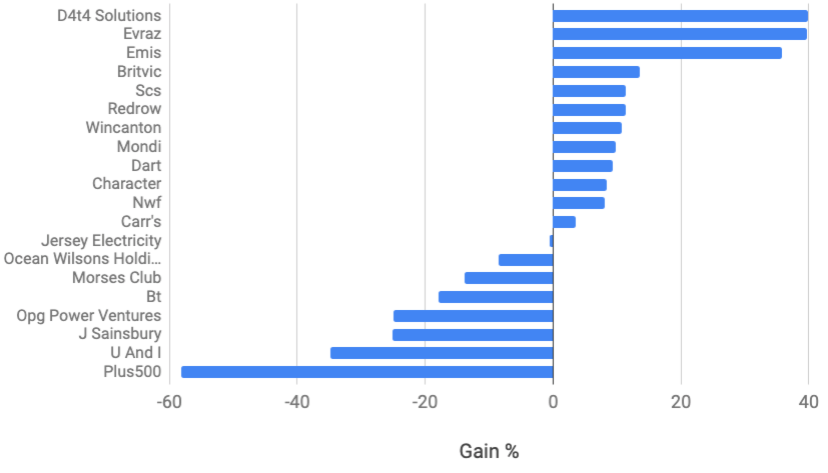
Plus 500 can only explain 3% of the underperformance year to date - but the whole portfolio has dragged. As you can see above the portfolio has generated 12 winners and 8 losers. That's a 60% hit rate of selecting winners - which is ok, but I've a feeling that's significantly worse than the hit rate of the overall 90+ StockRank set. So that sparked my curiosity. Is this an unlucky set?
Are this year's NAPS a representative sample?
The whole idea of the NAPS process is to create a well diversified sample from the 90-100 StockRanks to generate a portfolio that is well exposed to the Quality, Value and Momentum Ranks (or factors). This sample should replicate the overall performance of the 90+ StockRank set quite nicely - a set of stocks that have generated very handsome returns in almost all global markets.
As we saw above, the NAPS have outperformed the 90-100 ranked shares over almost 5 years. I'd love them to outperform every year but that appears to be beyond the laws of luck and randomness - especially if your portfolio construction only takes 1 hour per year.
I ran an analysis of the hit rate of all the StockRank deciles year to date, from 0-10, to 90-100. You can see the 90-100 set had a 75% hit rate of picking winners year to date.
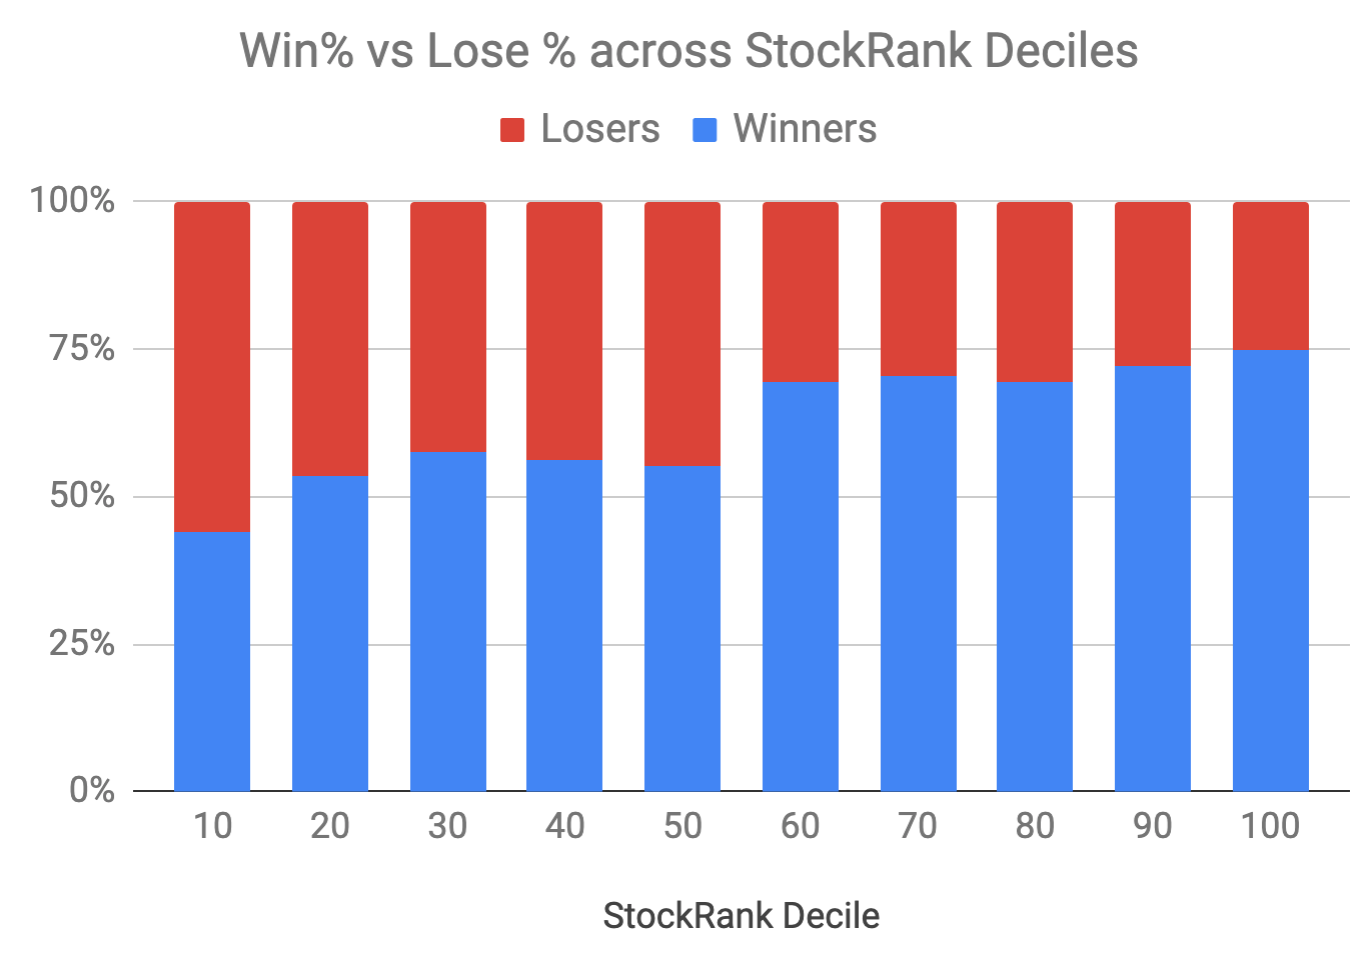
With only a 60% hit rate for the NAPS year to date, it seems the NAPS haven't sampled the 90-100 set very accurately. And that's the key issue driving the underperformance.
How many stocks are enough?
If I wanted to guarantee the same return as the 90-100 StockRank set - I'd need to own a lot of shares. There are 140 or so shares in the UK 90+ Ranked set above a market cap of £10m, and you just can't own all of them. If you are selecting a portfolio as a sample there's some chance that you might pick a great set, but some risk that you might not. In some previous years, especially in the first year of the NAPS when there was a 95% win rate, we got lucky. But this year, we appear to be unlucky.
So how many shares are enough to ensure you get the return of an index like the 90+ StockRanks. Well there's lots of good academic research on this topic that I've written about before in the article "How Many Stocks Should You Own in Your Portfolio?" - but I thought I'd create my own study.
Every blue dot in each of the 5 graphics below represents a randomly generated portfolio of 90+ StockRank shares held from the start of the year to today. The vertical axis shows the Hit Rate (what percentage of stocks were winners over this period) and the horizontal axis shows the % Return year to date for the portfolio. The top chart shows 10 stock portfolios, the bottom chart 50 stock portfolios.
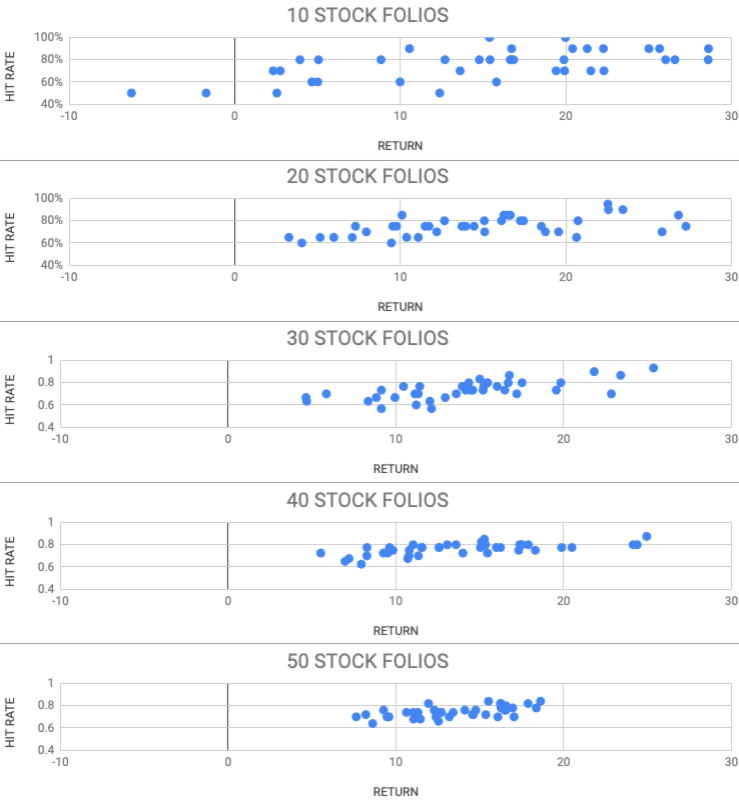
As you can see - as the number of stocks in a portfolio rises, the probability of outcome starts to cluster. You are less likely to smash the market, but less likely to underperform.
Of course, running a 50 stock portfolio can get expensive. The rebalancing costs rise and you need a lot of capital. So one has to make a practical trade-off. Somewhere around the 20-30 portfolio size is about the Goldilocks portfolio. Not too big that it's boring, but not too small that you are likely to be hit by a bad year.
Unfortunately this year's NAPS performance is at the far end of the 20 stock distribution - a real outlier. From my analysis of the distribution, it's actually more than 2 standard deviations below the average return of 20 stock portfolios - that puts it in the bottom few percentiles of randomly generated high StockRank portfolios for the last 6 months.
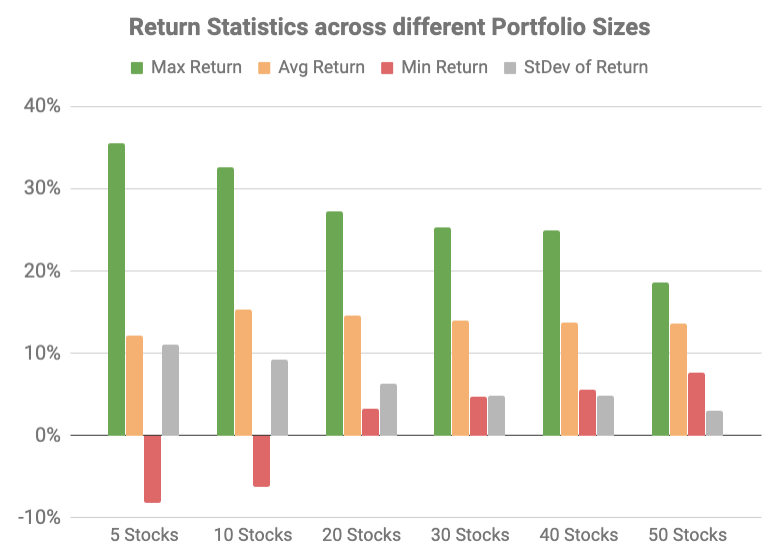
The chart above shows the range of outcomes over the last 6 months for different portfolio sizes. It shows the max return (green), min return (red), average return (orange) and standard deviation (grey for the geeks). It's another nice visualisation that the more stocks owned, the less diverse the outcome.
Are the NAPS over-diversified?
The NAPS aims to own stocks in every sector to ensure diversification. But this means the portfolio may be skewed towards sectors that can lag - (e.g. Utilities). I've also added more constraints to the portfolio - adding in some size buckets and volatility buckets. Perhaps I've added too many constraints and the portfolio got a bit stiff.
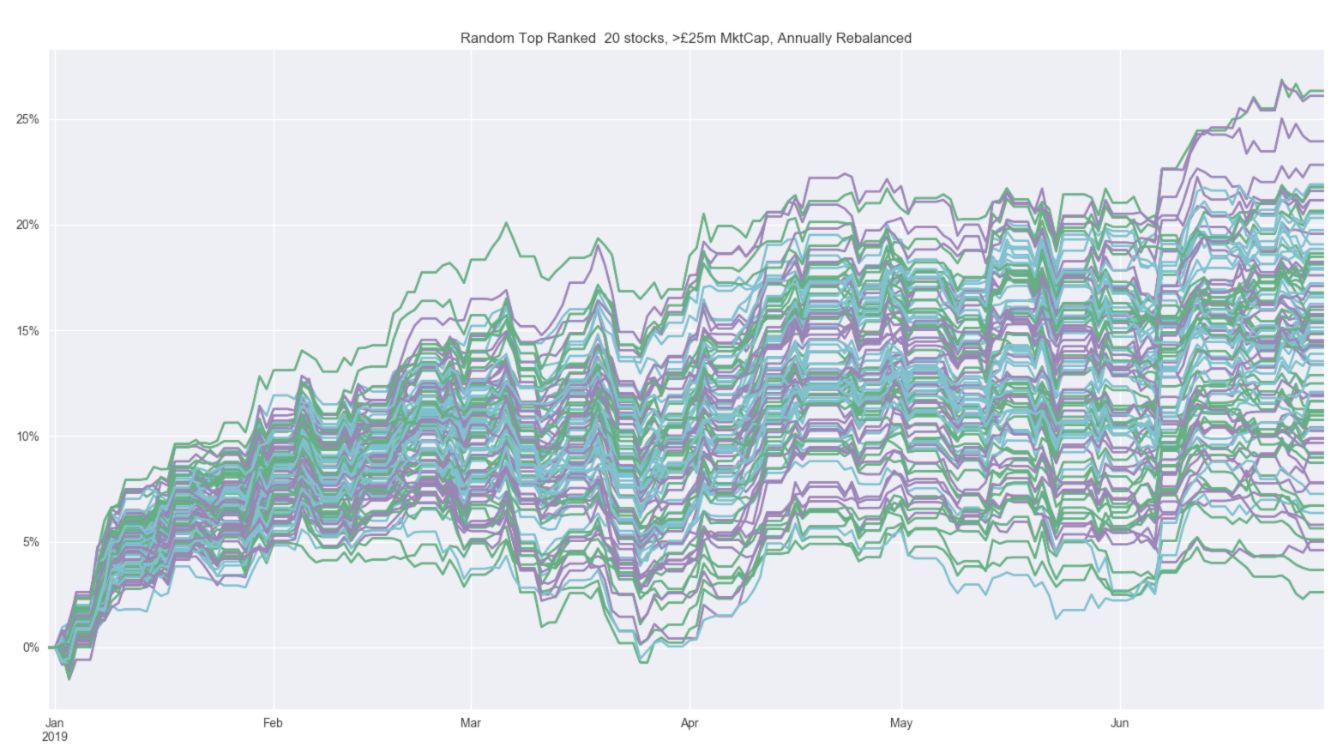
Below is a more visual representation of 20 random, non-diversified portfolios since the start of the year in 90+ ranked stocks. This year, there have clearly been benefits to not stressing too much about diversification - although that's easy to say when the market is rising.
What to do now?
Of course, if you do end up holding a duff set that's not performed as expected... the question is what do you do next? Do you chase returns? Do you rebalance now? Long term readers will know that this wouldn't be the no-admin-portfolio-system if I was going to create a lot of admin. So the NAPS will remain as they are for the rest of the year come what may. But there are plenty of reasons to propose a more active approach. Stop loss techniques - either based on price or rank movements through the year can help reduce risk and free up capital for new opportunities as they arise.
As you can see below, the ranks of the NAPS have significantly drifted over the first six months of the year. 7 of the stocks now have a StockRank of under 80... and that's not the factor exposure I personally like in my portfolio - and therein lies the opportunity for those that wish to take a more active approach to rebalancing.
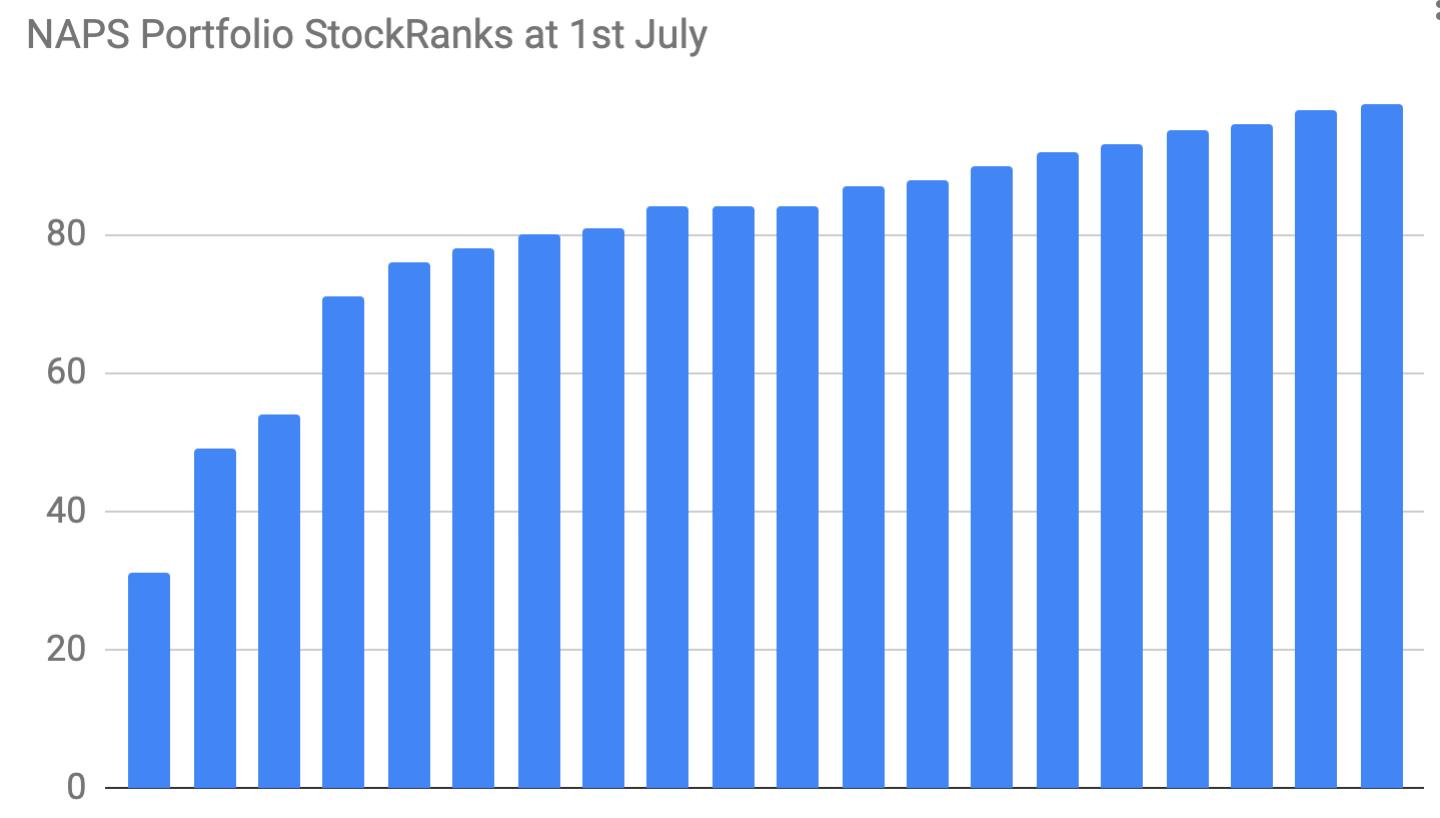
More active investors may be keen to keep their portfolios more heavily exposed to the QVM factors on a more regular basis. Of course this comes at the added cost of transaction expenses.
Conclusion
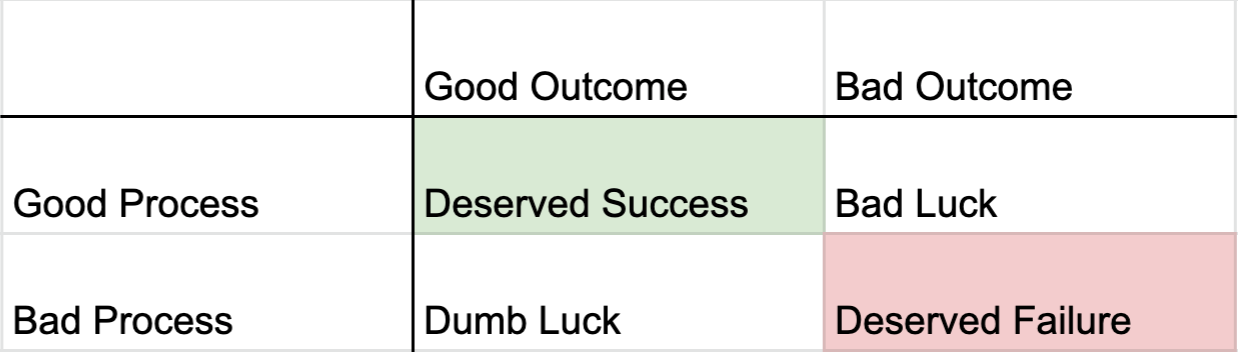
In assessing these results I'm taken back to this matrix that I published after the first year's performance - courtesy of the investing legend Michael Mauboussin.
I like to believe that the NAPS is a good process. It's founded on decades of academic research into what works in investing and ensures reasonable risk management through diversification. While there may be buy-and-hold detractors that believe systematic investing generates too many trades, many NAPS stocks end up owned over multiple years. The annual rebalancing cycle can be thought of as gardening - reaping, weeding, pruning and sowing once per season.
Looking at the matrix, and given the strong returns of the overall 90+ Ranked set of stocks in 2019, I would like to classify the first 6 months of 2019 as "Bad Luck" for the NAPS, rather than "Deserved Failure", but I'm very open to hearing your thoughts.
As mentioned at the start of the year, I have been considering calling a pause to my NAPS musings at the end of the year.... but this challenge is encouraging me to continue. We shall see what form the portfolio takes next year... but one thing is assured, it won't be pure QVM, and it won't have as many diversification constraints. A portfolio needs roots and wings.
Company Write-Ups
I'm now going to hand over to Jack and Ben for the company write ups of the half year SNAPS Portfolio.
I should have added that this time around, I've dropped the market cap constraint back down to £25m - there's a little more spice in the portfolio as a result.
Berkeley
- Sector: Consumer Cyclicals / Homebuilding & Construction
- Market Cap: £4.81bn
- StockRank: 99
- Style / RiskRating: Balanced, Large Cap, Super Stock
When it comes to the housebuilders, we might as well have thrown darts. Redrow, Persimmon, Taylor Wimpey - all boast a 90+ StockRank and qualify for various screens. But it is Berkeley that comes out on top this time, with a QualityRank of 93, a ValueRank of 80, and a MomentumRank of 96.
Berkeley principally focuses its activities around London, Birmingham, and the South East - markets that have led the charge in terms of house price appreciation over the years, but that have also recently been showing signs of softening. While many might think that the best of this housebuilding cycle is in the rearview mirror, some 19 brokers have been busily nudging up their earnings forecasts for Berkeley for FY20/21.
Looking to the future, CEO Rob Perrins comments: “Berkeley starts the coming year from a position of strength, with net cash of £975.0 million, forward sales of £1.8 billion and an estimated £6.2 billion of gross profit in our land holdings, and this means we can look beyond the current period of uncertainty with confidence.”
SCS
- Sector: Consumer Cyclicals / Specialty Retailers
- Market Cap: £88.8 million
- Stock Rank: 99
- Style / RiskRating: Adventurous, Small Cap, Super Stock
SCS is one of those permanently high StockRank stocks. At 222.68p, its shares trade just 10% higher than when the group floated four and a half years ago, meaning they are priced at 8.6 times forecast earnings and are set to pay out a 7.63% dividend to shareholders.
This nationwide vendor of furniture and flooring is consistently cash-generative, and its ability to push up sales, profit, and dividends suggest it is being unfairly dismissed by the market. Although forecasts point to a slight decline in earnings going forward, SCS is gaining a reputation for defying the naysayers.
Group CEO David Knight said in March: “The retail market continues to suffer in the midst of the uncertain economic and political environment. We therefore expect the trading environment to continue to remain challenging in the short to medium term, although the Board is confident that the Group is well positioned to maximise opportunities as they arise."
Mission Marketing
- Sector: Consumer Cyclicals / Media & Publishing
- Market Cap: £79.8 million
- Stock Rank: 99
- Style / RiskRating: Adventurous, Small Cap, Super Stock
It’s all change at Mission Marketing: a cursory glance at the RNS shows a flurry of board changes, director shareholding notifications, disposals, and equity issues. Whatever’s going on, it seems to be working for this “technology-embraced marketing communications and advertising group”.
Quite what “technology-embraced” means is a question for another day, but what can be said for sure is that TMMG shares have been on a tear in 2019, up 88% since the start of the year (from 50p to 93.9p).
Executive Chairman David Morgan said in the group’s final results in April: “We have increased our revenues and profit for the eighth year running and seen our bank debt tumble whilst continuing to increase the reward to our shareholders. There's an energy within the Group that gives me the confidence to believe that 2019 will see this momentum continue."
Go-Ahead Group
- Sector: Industrials / Customer Transportation Services
- Market Cap: £857.4 million
- StockRank: 99
- Style / RiskRating: Adventurous, Mid Cap, Super Stock
Shares in bus and rail services operator Go-Ahead have risen by 32 percent since the start of the year. That easily outpaces our new year NAPS industrials selections of Wincanton, Dart and Ocean Wilsons. But can Go-Ahead keep motoring?
A trading update in June saw the company sound the horn on rising revenues across its divisions, with expectations ratcheted up for the full year numbers (due in early September). With a ValueRank of 77, this stock appears to be on a reasonable valuation, and 90-plus scores for quality and momentum suggest it’s a high quality stock and the market likes what it sees.
David Brown, the chief executive of Go-Ahead Group, said in June: “I'm pleased to report that we have delivered revenue growth in all three of our business divisions. This performance is driven by our commitment to continually improving services for our bus and rail customers and I'm delighted with our recent results in reliability and satisfaction levels.”
Hydrogen
- Sector: Industrials / Professional & Commercial Services
- Market Cap: £26.4 million
- Stock Rank: 99
- Style / RiskRating: Speculative, Micro Cap, Super Stock
Congratulations to holders who picked up this recruiter twelve months ago, because Hydrogen currently boasts a one-year relative strength of 133%. This micro-cap trades on just 0.19 times sales and its broker expects revenue growth over the next two years. Admittedly, holding onto Hydrogen shares is not the smoothest ride on the market but that’s why we create a diversified portfolio of 20 stocks, right?
Chairman Stephen Puckett’s comments at Hydrogen’s AGM statement in May further suggests we should buckle up: “The Group continues to grow and trade in line with management's expectations. The Group has experienced continued strong growth in the US. This has been partially offset by weaker trading conditions in parts of the Group's APAC operations. In EMEA, trading has been stable with the UK, which is the main contributor, impacted by Brexit related uncertainty dampening demand for certain skill sets.”
Solid State
- Sector: Industrials / Machinery, Equipment & Components
- Market Cap: £37.8 million
- StockRank: 98
- Style / RiskRating: Speculative, Micro Cap, Super Stock
Shares in this electronic components specialist went on a huge run through 2014 and 2015, but then crashed spectacularly on a profit warning. Things seem to have stabilised since, and the price has had some solid momentum behind it in 2019. But does the market trust it?
Despite record revenues and profits in its 2019 results released this week, the hint of softer sales in the first quarter of its new year was enough to send tremors through the share price. A combination of high quality and momentum look to be the key factors here.
Tony Frere, Chairman of Solid State said in July: “The financial year ended 31 March 2019 has seen the Group deliver its best ever performance in terms of both revenue and profit from the core business and make significant progress against its strategic objectives.”
Evraz
- Sector: Basic Materials / Metals & Mining
- Market Cap: £9.73bn
- Stock Rank: 99
- Style / RiskRating: Speculative, Large Cap, Super Stock
A 38 percent gain in six months added £2.7 billion to the market cap of Russian mining group Evraz - making it one of the top performing NAPS picks this year. But while the gains have been great, the ride has been bumpy. Evraz is a volatile stock and we’ve seen some wild swings over the past few months.
Despite the price rise, Evraz’s valuation isn’t stretched - likely because the market is wary of its cyclical nature and volatility. The high quality and momentum cement its position in the half-year portfolio.
Alexander Frolov, the chief executive of Evraz, said in February: “In 2018, Evraz delivered robust growth due to favourable market conditions and ongoing efficiency and cost initiatives... Evraz believes that its low net debt and superior cost base will help to withstand any market downturns, thereby helping the business to develop sustainably.”
RHI Magnesita
- Sector: Basic Materials / Construction Materials
- Market Cap: £2.41bn
- Stock Rank: 97
- Style / RiskRating: Adventurous, Mid Cap, Super Stock
RHI Magnesita is an Austrian company with a full London Stock Exchange listing, with a quote on the FTSE 250. It mines, makes and sells refractory products that are used in very high temperature environments in industries like cement, glass and chemicals.
RHI and Magnesita merged during the 2017/18 financial year, which has rippled through the financials of the combined group. Mergers can be a double-edged sword for investors, but so far this deal seems to have gone down well. Again, high quality and momentum are the two biggest factors at play.
In an update in May, the company said: Whilst macroeconomic uncertainties remain at an unusually high level, RHI Magnesita expects to continue to realise the benefits from its integrated model and its growth and cost savings initiatives. Consequently, the Board’s expectations for full year 2019 operating results remain unchanged.
James Latham
- Sector: Basic Materials / Paper & Forest Products
- Market Cap: £167.9m
- Stock Rank: 96
- Style / RiskRating: Balanced, Small Cap, Super Stock
This importer and distributor of timber and panel products has been in and out of the NAPS portfolio right from the start. It had a super run between 2014 and 2017, but last year was one to forget. Its price came under sustained pressure as a result of concerns about declining margins and slow growth.
This year the price has seen a sustained pick up and the most recent results were upbeat. James Latham has proved to be very consistent in its results, if not spectacular. The stock offers a modest two percent yield, but the company has a very long track record of well-covered dividend growth over the years.
Nick Latham, the chairman of James Latham said in June: “Despite the strong start to the year, there is still uncertainty surrounding the economic outlook, but we remain confident that we are in a strong position to continue to grow the business.”
Nichols
- Sector: Consumer Defensives / Beverages
- Market Cap: £618.1m
- Stock Rank: 86
- Style / RiskRating: Balanced, Mid Cap, High Flyer
Nichols is behind a range of soft drinks brands including Vimto, Sunkist, Levi Roots and Feel Good Drinks. Its shares have risen by 580 percent over the past ten years as the market has been won over by impressive returns, high margins and excellent cash generation.
Understandably, the valuation is now high - with a ValueRank of 20 - but top tier quality and relentless momentum make this a classic High Flyer in the StockRank Styles framework - so we’re hoping there is more to come.
John Nichols, the chairman of Nichols, said in February: "Nichols plc delivered a strong performance in 2018, achieving growth in revenue, profit and earnings per share, resulting in a 14.5% increase in the final dividend… As a result of the Group's diversified business model, strong portfolio of brands and successful track record, the Board remains confident of delivering continued profitable growth."
Unilever
- Sector: Consumer Defensives / Personal & Household Products & Services
- Market Cap: £128.55bn
- Stock Rank: 85
- Style / RiskRating: Conservative, Large Cap, High Flyer
When it comes to iconic blue chip stocks, you’d be hard pressed to find one that has been quite as impressive than Unilever over the past 20 years. Not only has its price momentum been relentless, but the group has kept its high returns and high margins intact.
FMCG giants are often associated will well protected brand ‘moats’. But at a time when consumer are gravitating towards more specialist, natural and environmentally friendly products, some of these groups are suffering - just look at Kraft Heinz. For the time being though, Unilever is more than holding its own. The price is high but the quality and momentum are phenomenal.
Alan Jope, Unilever’s chief executive, said in April: "We have delivered a solid start that keeps us on track for our full year expectations. Growth was led by emerging markets and was balanced between volume and price. Accelerating growth is our number one priority. It requires both great execution and a continued strategic shift into faster growth segments and channels.”
Tate & Lyle
- Sector: Consumer Defensives / Food & Tobacco
- Market Cap: £3.49bn
- Stock Rank: 89
- Style / RiskRating: Balanced, Large Cap, Style Neutral
Food ingredients group Tate & Lyle slipped from Super Stock to Style Neutral eight months ago but its ranking position has been creeping higher in recent weeks. Its full year results in May signalled some improvements in quality and the momentum has also been showing signs of building.
Nick Hampton, the chief executive of Tate & Lyle, said in May: “I am encouraged by our progress over the past year. The group delivered solid financial results and we are starting to see real momentum from the three priorities I set out last year to sharpen the focus on our customers, accelerate portfolio development and simplify our business.”
Smith & Nephew
- Sector: Healthcare / Healthcare Equipment & Supplies
- Market Cap: £15.03bn
- Stock Rank: 83
- Style / RiskRating: Conservative, Large Cap, High Flyer
Smith & Nephew has been on an acquisition spree in recent months, and that swashbuckling M&A activity is driving its share price higher. The company has been intent on buying up additional growth drivers and the new deals have been coming thick and fast.
In May the company said it was increasingly confident of revenues coming in at the upper end of expectations this year. The valuation looks high but the quality and momentum in the business are supporting it for now.
Namal Nawana, the chief executive of Smith & Nephew, said in May: “It’s been a good start to 2019 across the whole of Smith & Nephew. All three global franchises delivered improved organic growth as we continued to improve execution; important confirmation that each has the potential to perform sustainably at or above their markets.”
Vitec
- Sector: Technology / Computers, Phones & Household Electronics
- Market Cap: £516.3m
- Stock Rank: 90
- Style / RiskRating: Balanced, Mid Cap, Style Neutral
Vitec is a stock that caught Paul’s eye recently. It makes and supplies camera products and accessories - and does it very profitably. A QualityRank of 90 points to the signs of a solid business that generates a lot of cash but also carries some debt. It pays a reliable, well-covered dividend. The share price has come under pressure over the past 18 months, but over three years has risen very strongly.
Stephen Bird, the chief executive of Vitec, said in May: "Whilst we remain mindful of geopolitical challenges, we are pleased to confirm that our outlook for the current year is unchanged, and H2 weighted as highlighted at the Full Year results. We expect a strong 2020, given the summer Olympics, US Presidential elections and the targeted growth initiatives already implemented."
RM
- Sector: Technology / Software & IT Services
- Market Cap: £197.7 million
- Stock Rank: 98
- Style / RiskRating: Adventurous, Small Cap, Super Stock
RM provides software and services to schools and colleges. It is a technology company in a growing space with recurring revenues, rising earnings, and a well-covered dividend. At 9.1 times forecast earnings, is this one the market has missed?
The group has some fantastic profitability metrics. Its QualityRank of 99 is backed up by enviable returns on equity (31.8%) and returns on capital employed (39.9%), while its operating margin of 10.2% is also not to be sniffed at. This type of company usually commands more of a premium.
The group’s chairman said in RM’s most recent trading statement: "The trading outlook for the Group remains in line with the Board's expectations, taking into account the usual seasonal pattern of demand and increasing pressure on UK school budgets.”
Polar Capital Holdings
- Sector: Financials / Investment Banking & Investment Services
- Market Cap: £578.8 million
- Stock Rank: 98
- Style / RiskRating: Speculative, Micro Cap, Super Stock
Polar Capital Holdings is an investment management company that came unstuck (along with the rest of the market) in the second half of 2018. Its share price plunged from 732p to c.470p but has since recovered to 600p. This share price volatility is not reflected in what appears to be a broadly stable operating performance over the past five years. What’s more, Polar is forecast to pay out a 5.59% dividend to shareholders.
In the group’s full-year results statement in June, CEO Gavin Rochussen said: "The financial year to 31 March 2019 was a year of two distinct halves for the Company. The first six months to September 2018 was a period of rising markets accompanied by global demand for risk assets. The market correction in October, followed by a significant sell-off in December, resulted in redemptions globally of assets. Despite this volatility, our funds posted a record year for performance fees.”
Property Franchise
- Sector: Financials / Real Estate Operations
- Market Cap: £42.2 million
- Stock Rank: 99
- Style / RiskRating: Balanced, Micro Cap, Super Stock
The Property Franchise Group is a UK-focused residential property business that operates a franchise model of residential lettings and property management services. Its brands include Martin & Co, Xperience, Ellis & Co, CJ Hole, Parkers and Whitegates. While many other estate agents have a catastrophic couple of years, Property Franchise has so far remained not just unscathed but with an enviable track record of profitable growth intact.
The group’s 99 StockRank is made up of a balanced combination of factors, with a QualityRank of 99, a ValueRank of 62, and a MomentumRank of 95. What’s more, the shares boast a forecast dividend yield of 5.26% that is covered 1.6 times by forecast earnings.
Ian Wilson, CEO, said in the group’s final results in April: “We entered 2019 with a significant improvement in our positive net cash position and the highest level of recurring revenues in the Group's history... The Board is confident about the prospects for 2019 and envisage that the loss of tenant fee revenue and continued regulatory intervention in our sector will create opportunities for further consolidation and growth."
Real Estate Investors
- Sector: Financials / Residential & Commercial REITs
- Market Cap: £102.5 million
- Stock Rank: 89
- Style / RiskRating: Balanced, Small Cap, Super Stock
As you would expect from a real estate investment trust, Real Estate Investors pays out an attractive 7.07% forecast dividend yield covered by just over 1x earnings. This REIT focuses on retail, office, and residential properties in central Birmingham and the Midlands. What’s more, you get all of this at 0.8 times tangible book value. The group’s net asset value per share was recently valued at 69.5p, comparing favourably to today’s share price of 55p.
It has a range of occupiers from national and regional multiple retailers to government and corporate office occupiers. No surprises, then, that this steady stock has a Balanced RiskRating. What’s more, with £25m of cash lying around, RLE is looking to expand.
Paul Bassi, CEO, said of Real Estate’s outlook: “We anticipate seeing off-market opportunities on the back of the current financial and political volatility. We welcome these periods of uncertainty, as they often bring mis-priced assets to the market which, with our local expertise and financial strength, we can move quickly to capitalise on.”
Volga Gas
- Sector: Energy / Oil & Gas
- Market Cap: £56 million
- Stock Rank: 99
- Style / RiskRating: Adventurous, Small Cap, Super Stock
Volga Gas has a few things going against it in the popularity stakes: an oil & gas explorer that is listed in the UK but situated in Russia, with a small capitalisation and a small float (just 20%). But it is exactly these kinds of characteristics that can be discounted too severely by the market, leaving opportunities for people willing to take the risk.
The group holds an interest in approximately four license areas in the Saratov and Volgograd regions of Russia and management expects to produce an average of 5,900 boe (barrels of oil equivalent) per day in 2019.
Currently, the group’s shares boast a ValueRank of 91 and the company paid out some 16% of its current share price in dividends in FY18. In an operational update in May, CEO Andrey Zozulya commented: “I am pleased to report that during this period, the Company has had a strong performance operationally and financially… The Company is looking forward to delivering further improvements to the Group's financial performance and to continuing distributions to shareholders, which will be considered by the Board in September along with the 2019 Interim Results.”
Pennon
- Sector: Utilities / Multiline Utilities
- Market Cap: £3.1bn
- Stock Rank: 90
- Style / RiskRating: Balanced, Large Cap, Super Stock
Pennon is an environmental infrastructure company whose operating subsidiaries include South West Water Limited, Bournemouth Water Limited and Viridor Limited. The company's segments include Water and Waste management.
The group is forecast to pay out a useful 6.02% dividend, although this is only covered 1.33 times by forecast earnings, and our Z-Score test raises an amber flag. That said, the group’s shares display favourable volatility characteristics, and recycling isn’t about to go away anytime soon.
In fact, as mentioned in the group’s full year results, business is currently booming with a little help from David Attenborough: “Market dynamics continue to be favourable with the 'Blue Planet' effect spurring action, while the Government's recent Resources & Waste Strategy will encourage positive reform. Today we are announcing the first part of Viridor's next growth phase… adding much-needed recycling capabilities to the UK market.”
Disclaimer
This is not financial advice. Our content is intended to be used and must be used for information and education purposes only. Please read our disclaimer and terms and conditions to understand our obligations.

42 comments
Maybe there are already good ETF or IT products out there to get a similar benefit to the Stockopedia high stock rank performance.
I happened to notice that Scottish Mortgage Investment Trust (LON:SMT) for example seems to perform in a very similar way to high stock ranks, with possibly a slightly higher beta. That is still primarily an active fund though. So possibly find an existing "smart beta" ETF with exposure to the factors you care about, which is an approach I am considering. But I haven't found a UK equity multi-factor ETF so far.
Good point. I can see the Stockopedia people saying, "well what we do is help investors do it for themselves....we're focused on self-directed investors". I think there is a group that possibly exists between just handing over to a black box fund manager and doing it all for oneself....the Stockranks info can give us reassurance about what is inside the black box and give such self directed investors an opportunity to achieve what they want with less effort AND more cost efficiently AND with reduced variability of outcomes by not selecting subsets of Stockranks.
The problem is that as soon as a company launches an ETF or a fund to exploit a factor that has worked very well in the past, that factor often stops working as well as it used to. The same thing might happen with an ETF based on StockRanks.
To get around the issue of variability of outcomes from choosing a subset of stocks within any particular rank, it is really necessary to buy all stocks within than particular subset. But the costs and work for individual investors would be prohibitive.
It would be great if you could launch an ETF to do it all for us that contains e.g. the top 10% of stocks by Stockrank or whatever other selection as time goes on.
Mebane Faber did a similar thing with his 'solution'.
Thanks for the article Ed, please keep them coming. I prefer the QM approach to that of SR but one needs to be wary of a market change to Value investing. I also use a limited version of Technical Analysis & moving stop losses which follows the price action....It works when i concentrate.... but that is not in line with your Naps objective.
All the filters in place, and suggested, take us further away from the low input, automatic selection principle. So, would a 90-100 decile ETF be feasible?
Hi purpleski & ian (& indeed laurie) - [the 'reply' button is not appearing on my screen at the moment - it seems to go AWOL sometimes is that just me - so just to be clear I'm answering on the debt question.]
I haven't had the chance to drill down much further yet (but am minded to look for patterns amongst high SR stocks that fail generically whether in NAPs or not).
One point of note though is that whereas the Robbie Burns rule that ian refered to was net debt : profit (of whichever flavour).
However Laurie referred to total (ie gross) debt - certainly most of the 'fails' would have passed the net debt test.
For example J Sainsbury (LON:SBRY) in FY 18
(Maybe not the best example as I suspect debt didn't really have much to do with the price declines of the last few months).
Gross Debt : £2.5 Bn
Net Debt : £0.6 Bn
With Operating profits of £0.5 Bn
The net debt ratio was a comfortable 1.2 x
Whereas the Gross debt ratio was a more worrisome 5x.
Which begs the question, should we pay more attention to Gross or Net debt? Most investors seem to focus on net debt, but the puzzle for me is always : If the company has debt and a significant cash-pile, then does it in fact imply that the cash is actually encumbered (ie already promised to someone else - particularly if the company 'window dresses' their balance sheet as most I believe do).
If the gross debt was actually called in - could they really use this cash to repay some of it?
I don't know the answers there - just thinking out loud.
Laurie/Gromley
“I like to add a debt filter to my selections. It picks up cash flow issues, provides a margin of safety, etc. If you had, for example, total debt must be less than 3xs op profit, the three biggest winners would still be included, but 5 of the 7 biggest losers would have been excluded. Britvic was the only company excluded by the suggested filter that beat the All Share.”
I read Robbie’s (Naked Trader) a long time a go and his 3 x profits rule just chimed with me (having been in a lot of debt in my 20’s I am debt adverse myself) and his 3 x debt rule is my starting criteria in any screen and the first thing I look at when a stock comes on my radar.
So if I was to construct a NAPS the first rule would be a 3 x profit debt rule.
I have followed Ed’s NAPS articles since inception but have not implemented a strategy like it for two reasons, both of which could be erroneous:
- So far (five years) I have out performed the market and the NAPS and am happy to put the time in. I am retired after all, so I have got to something with my time!!
- If it was that easy (over the long term 10 years +) then we would all be doing it and there would be an awful lot of people out of a job.
We will see and I do hope that if Ed moves on to writing about other stuff, somebody at Stockopedia takes over the NAPS column.
If you operate a 10% stop loss limit and reinvest the remainder in the top performing stock and continue the process by investing the residual from the next loser in the 2nd best performing stock and so on down to the 5th best performer then start again at number 1, this would have improved performance significantly for last year and i suspect for all previous years.
I accept this would produce a more concentrated portfolio, but at least it would be concentrated in winners.
daverawc, I have tried stop losses in a LTBH portfolio and found them very unrewarding. You often get taken out on a downspike - some of them are quite vicious - only to see the price recover in fairly short order. OK, 10% may allow for it but those spikes will still come along and take you out when you are around the 8-9% region. In reality you have to accept this if you are going to use a stop loss and not just use a warning price level followed by your own judgement which is even more difficult in practice.
That is an interesting idea however stop losses would have taken you out of some big winners in previous years. Problem is if the market falls in January/February time you could lose quite a few shares, some of these will be the winners. Of top performing after a few months may well become a loser, it would be an interesting study to do. I know stop losses have taken me out of some that would have been huge winners, Ab Dynamics (LON:ABDP) went up x15 and IG Design (LON:IGR) x2 soon after I sold. This year Morses Club (LON:MCL), Plus500 (LON:PLUS), Mondi (LON:MNDI) were all early winners that turned a bit sour. In 2018 Indivior (LON:INDV) did quite well in the first 5 months up about 20% but then crashed. Griffin Mining (LON:GFM) was similar, MHP SE (LON:MHPC) went up 25% in the first month but then drifted down to finish the year about -15%. Premier Oil (LON:PMO) early winner up 25% but ended the year about 30% down and about 45% down from peak. So I'm not convinced that this will work with NAPS.
There's nothing to stop you buying back in to a share you've been stopped out of, you could have a re-entry criteria such as the share making a new high. I've found a trailing 3xATR (average true range) stop to be reasonably effective for liquid shares rather than a set percentage which takes no account of volatility.
Yes it has. There have been five NAPS so far and INDV is one of a handful which have appeared three times.
For the curious here's a table of the number of appearances for each stock in NAPS to date.
That's a good point Herbie on Indivior (LON:INDV). I think the QR and VR are skewed by old data. The incredibly high ROCE will push the QR. The value rank doesn't make sense to me - I think it is based on ultra low historic P/E, which isn't the case going forward. So I would say those two ranks are misleading for Indivior (LON:INDV).
Talking of Robbie and number of shares, he seems to have about 50 different shares currently.
I would exclude companies with high debt and "foreign" companies, many of those seem to go wrong, there have been several Israeli companies, Chinese of course, Russian I would consider high risk.
Has Indivior (LON:INDV) appeared the most times in NAPs? It is still quite highly rated even though it has fallen almost 90% in just over a year, why is it so highly rated?
Laurie and Gromley. The Debt filter of: Net Debt < 3 * Op Profit, is one of the Naked Trader Esque Guru rules for excluding companies with excessive debt. Robbie now uses uses Net Debt < 3 * Pretax Profit as the guideline, but hey ho.
I don't know where Robbie derived his debt metric, (but I am pretty sure it was not from backtesting), but I have a hunch it was from one of Buffett's guidelines of 2-5 years earnings to remove debt, in order to build in a margin of safety during recession.
High quality companies tend to not need to borrow heavily (because they have higher Return Ratios), so it makes a lot of sense to me not to invest in over-geared companies. By adding an additional debt max filter you are effectively pushing the mixed ratio Q + M + V score towards a selection of companies with a probability of higher Quality, (and probably away from Value). Ian
laurie - that is a fascinating and potentially very powerful stat if true (No disrespect intended by adding that rider, but it is not something I have personally validated and I always exercise scepticism until I have the evidence)
One would need to consider of course whether the same improvement would have been achieved on the earlier iterations of NAPS - a lot of hard work to test that of course, but if it could substantiate the case you make it would be work very well spent.
It would also be useful of course if one could find a clear link between the levels of debt and the price declines of the worst fallers in this years NAPS. I am not sufficiently up to speed on all of them to really be able to say for sure , but off the top of my head I'm don't think that debt levels have been a recent price affecting issue.
In fact I used to work for one of the companies cited and I can recall that the relative debt was much higher in the past, but at the time of peak market comment on the debt levels I was being told that there was so much investment capital available to the business that if I was strongly encouraged to bid for Capital to support growth capex or acquisitions. Stepping back from the situation although I would say that I am quite financially conservative, I have to say that the encouragement to invest was right (so far) despite the apparently high debt levels.
Anyway, "in other news" I started to look at the cadre of potential candidates for this years NAPS and I think I have to support Ed's view that 2019-NAPS were "unlucky".
I happen to have a sample of SR data from 23-Dec-18 and another for 14-Jun-19 which gives a close comparative to the NAPS review.
SR >=90 and Mcap >= £10m gave me 127 qualifers of which 76% were "winners" by mid June delivering an average return of 12% (not stellar in the context of the wider market, but okay).
However, there were 9 (out of 127 = 7%) of those stocks that fell by more 25%. Ed's unfortunate NAPS folio managed to select FOUR of these (therefore 20% of the 20 stock folio).
I cannot immediately find any systemic failings in the NAPS selections so for the time being I'd still back Ed's view that NAPs' has just been unlucky in 2019.
Given though the NAPS namings relation to one of the earlier attempts to unify Europe, I cannot help but recall Napoleon's preference for "Lucky Generals" - just as well that Ed I think has reached "Field Marshall" status by this stage.
Dear Ed,
I like to add a debt filter to my selections. It picks up cash flow issues, provides a margin of safety, etc. If you had, for example, total debt must be less than 3xs op profit, the three biggest winners would still be included, but 5 of the 7 biggest losers would have been excluded. Britvic was the only company excluded by the suggested filter that beat the All Share.
For your interest, and assuming the historical information I have is correct, the following shares would have been excluded: Britvic, Dart, Carr's, OCN, BT, OPG, SBRY, U and I.
Thanks for the review Ed. I find it strangely reassuring to see that even the best strategies will have periods of underperformance. Gives hope for us mere mortals. Like Gromley, I wonder why you are considering a move away from Value. Although it has certainly not been a good strategy over the last 6 or more years is it really time to retire it altogether (even if only in NAPS)? Jack has published an article in the last couple of days highlighting the guru screens that have worked best in the last 6 months and bizarrely the bargain/value ones have outperformed. Although they are mostly rammed with stocks I wouldn't consider, it may be an indication that things are turning back towards value? On a slightly separate issue I would be keen to see a Fantasy fund set up to mirror the NAPS and SNAPS portfolios. And finally I would love to see a Fantasy fund/performance rating system for the guru screens that recognises both bid offer spread and dividends. You've mentioned dividend automation is one of the earlier enhancements on the new system - so perhaps this might be possible?
Gromley wrote: "What would be interesting however, and something I aim my sights on, would be to see if there are any common factors amongst superstocks that fail to shine."
I suggest excluding any overseas-domiciled stocks from a NAPS portfolio, unless they are domiciled in countries in which one has a lot of confidence. That might cause one to miss some profitable opportunities but would also probably save one from investing in some stocks that turn out later to have had fraudulent accounts.
I notice that Citywire are also boosting REI. I had a look the website and viewed their properties ( very helpfully shown). Having lived in the Midlands for many years I know a number of these and have reservations on the quality of several. I also see a lot of retail and short leases. So to me the two combined are something of a red flag. I think you could easily attribute a 20% decline in retail values so this is a clear avoid. Would think discount to ‘ stated ‘ NAV needs to be closer to 30%
Cracking article as ever Ed and some great comments too. Such a rich vein for further thought.
QM vs QVMTwo things in particular have grabbed my immediate attention.
You (Ed) hint at taking a more QM oriented approach going forwards and I am curious as to the reasoning.
Variability of performance amongst the highest StockRanks.A quick look at the SR performance charts suggest that over the 6 and a bit years of SR history QVM has narrowly outperformed QM (although in fact it is so narrow that dependent on how you set the filters you can draw the opposite conclusion).
Over the past two years, however, QM has a more convincing lead of QVM (although the absolute performance of both doesn’t look too stellar – although better than a ‘market’ that is only up fractionally in the last 2 years).
So, are you allowing recency bias to influence you here? Or is there more to it than that?
As I suggested recently on another thread; perhaps the time when everyone is thinking of dumping ‘value’ is precisely the time to be embracing it?
A second area of interest here is the interesting find from Nick Ray that for the higher stock ranks the variability of performance is significantly increased.
This puts me in mind of the very highest yielding shares, where you can find some real gems but also a fair share of dogs.
Is there some sense that the very highest StockRanks include a fair share of stocks that are “too good to be true”, alongside a larger number that really are true?
Other posters have in the past suggested that a more qualitative view of quality might provide a useful additional “filter”. I am somewhat sceptical on this point, but it is fair to point out that such an approach would probably have saved one from last year’s dog Indivior (LON:INDV) and this year’s Plus500 (LON:PLUS) . Also though it would have likely to have kept you out of last years star Plus500 (LON:PLUS) again and probably EVRAZ (LON:EVR) (These were just the ones that seemed most ‘obvious’ to me so it’s hardly scientific).
What would be interesting however, and something I aim my sights on, would be to see if there are any common factors amongst superstocks that fail to shine.
Most interesting article
When I drew up my 2019 portfolio, I was rather disheartened at the comparative lack of high SR shares which were of interest to me in the UK market. Further, last year I explored the Australia/NZ markets with singular lack of success and so I changed my subscription to European shares. Following the principle of minimum effort I picked out 5 stocks with SRs 95+in sectors in which I could not come up with a home grown selection. So far three have repaid my investment royally, one is pretty much unchanged and the worst is minus 12.6%. Bearing in mind these purchases were stupidly made at the time of a quickly falling pound I am very pleased and now at re-balancing time, I shall endeavour to pursue this strategy further.
Hi Ed, thanks for an interesting update as ever. As someone who runs a monthly screened income portfolio based on a quantitative process & as a full time investor who use that & the stock ranks to run real life portfolios I thought I'd add a few observations from my experiences with those.
Obviously a monthly screening or even quarterly for that matter is a lot more admin than you have with the NAPS, but does help to keep exposure to the factors higher over time, which if they are out performing factors is obviously desirable. So far in the 4 years or so that I've been running that 20-30 stock portfolio it has generally delivered market beating returns, although it did have one year of significant under performance in 2016. That's even after allowing for the higher trading costs from monthly re-balancing, although on occasions I have skipped trades in a few quiet months over the summer / Christmas etc. or when there is no need to trade due to the Scores etc.
As for Stock Rank based portfolios run on a more manual / relaxed basis I have found that using a 50-60 Score as a cut off point to review stocks in addition to monitoring news flow and acting accordingly works quite well for some masterful inactivity and also keep costs and admin down to a minimum in a larger more diversified, sleep at night, longer term full time portfolio.
This is generally constructed from the more conservative outperforming styles too in the main which also helps. I think the most important thing though is to try and avoid the losers by not holding stocks in the bottom two quintiles unless you have a very good reason to & avoiding the losing styles like Sucker stocks unless you are that way inclined. See the graph from the performance of the RANKS below which bears this out. It also shows that the 50-60 decile has actual outperformed the 60-70 & 70-80 deciles & they have all outperformed the markets, although by less than the top 2 deciles which is probably what you should focus on if you are really chasing performance & don't mind more volatility.
It seems to me that the Ranks do wax and wane as one subscriber posted about recently, but I've found that quite often stocks bounce around in the 50 to 90 range depending on how the momentum tends to move, although of course you need to pay attention to the reasons behind the deterioration and as ever you always have to make a judgement call which you can never get away from.
Hope this might help people trying to use the Ranks in their own way, I know they help me - so thanks for your service.
Regards
Jamie
Webite: Compound Income
Twitter: Jamie@CompoundIncome
Very interesting article and coincidentally I had been looking at precisely this issue recently.
it seems even holding 30 shares can lead to returns wildly different to the underlying group you have selected from. In one of your charts it show max return of around 25% and as low as 5%. But of course if you were really lucky or unlucky it could vary a lot more than that. This is problematic if you're hoping to more or less replicate the top decile of 90+ shares because the chances of doing in any one year is quite low.
Also the volatility of the underlying market and the subsequent variation of returns of the individual shares in the 90+ group will affect your chances of approximating it. And as someone already pointed out it would interesting to see how selecting from low volatility shares could affect the result.
ps I tried to calculate the performance of the 90+ decile for the first 6 months of the year from the performance chart and came up with about 9% which is different to the 11% mentioned in the article. I'm wondering if the 11% includes dividends ?
I was also curious to see in the graphic the returns appear to be clustered more around a 13-14% return instead of 11% I wonder why that is.
I would rebalance based on risk-on risk-off or recovery/expansion/deceleration/recession rather than using a calendar year.
I quite like the idea of a semi/slightly-active approach, as suggested by Pete - do a brief monthly/bi-monthly summary of the stocks in the portfolio, and replace only those whose price has dropped more than 20% due purely to trading/outlook warnings and replace them with whichever is next in the top-20/30 that didn't make it in the original selection. I don't think it would take much admin to identify these warnings.
Ed,
Great analysis. I am with you on your QM comment, because it's a style I like myself:
...I've considered moving to a pure QM strategy which tends to highlight some more dynamic names.
I am curious whether this is because you relate for example to other QM Guru screens such as William O'Neil CAN-SLIM and Richard Driehaus Momentum, and/or whether it is because Value per-se (in QVM) has struggled in recent years? Perhaps room for both approaches (and maybe more of the 4 winning styles), as model portfolios? Suggest the 4 winning styles /annum, created at the start of each quarter and tracked for 12 months. Ian
Hi Ed,
Please do not stop writing and managing NAPS. I use it on a European portfolio and this year hasn't been great either. It's done a bit better and some stocks have been there since 2015. I'm unsure about losses because I did have positions in my QVM portfolio that retraced their steps. In my experience the Brexit result would have stopped me out of a lot of positions. Also some quality stocks would have had no wriggle room with a stop loss. In addition in the small cap space many companies are acquired and restructured and the stock price shoots up when such events occur so holding them for less than a year can be counterproductive. In one interview the legendary Greenblatt mentioned that it can take up to 3 years for a company to gather strength so discarding a strategy after a year or two of under performance may again be too rash. I believe even O'Shaughnessy spoke about this in a recent interview.
Hi Ed,
Thanks for the very informative article.
I think it would be interesting if you repeated your analysis of the variability of returns from randomly selected 90+ StockRank portfolios of different sizes, but this time restricting the selection to stocks with low volatility, e.g. ones labelled 'conservative' by Stockopedia. I suspect that the variability of returns from portfolios with any particular number of stocks would be greatly reduced, without much effect on the average returns. If that turns out to be the case, it would be a way of producing more consistency in annual returns.
For the next NAPS, you could always increase the number of selections to 30 and see what happens.......
Dear Ed,
Thank you, this is interesting. I see you state:
"Nonetheless, excluding dividends, the NAPS have generated a return of 90% over the last 4.5 years versus only 14% for the FTSE All Share.I would be most interested if the comparisons included dividends."
Over four and half years the contribution of dividends may be substantial, I imagine. So it would be most useful if we could see the comparable data with dividends reinvested.
I think keeping track of returns including dividend reinvestment was on the list of potential improvements several years ago. I vaguely remember that it was on the cards but complex to do. I wonder is it still on the agenda?
@Armorduck - yes there's been about a 3% average dividend yield each year - so it's very significant.
Regarding the portfolios & dividend automation - we've completely rebuilt our portfolio system, and have a rollout of new and improved features coming soon. First up will be an improved charting & performance system, then dividend automation. Good things coming there.
Why would you stop doing the NAPS Ed? It is excellent to follow, read and learn from as well as always being thought provoking.
Hi @Crazycoops - my interests are moving to a more semi-active approach (i.e. overlaying trend following & stop losses on a high ranking portfolio), and for the last few years I've considered moving to a pure QM strategy which tends to highlight some more dynamic names.
Nonetheless, I've stuck with QVM and iterated on diversification & portfolio construction approaches to date - it's obviously an approach that's done well and I've learned a lot.
The NAPS will continue - even if only as a model portfolio and I'm not going to stop writing - in fact I want to write a lot more.... but my writing focus might shift to other areas.
I think a more semi-active approach would be very popular to readers
Very interesting and it chimes in with a slightly anecdotal observation that I have noticed.
If you have a screen which you believe finds good stocks (e.g. Stock Rank > 90) but it returns too many, there is a temptation to add a few additional rules to reduce the number of matches to your target portfolio size. You tend to rationalise that if the extra rules seem to make sense then they can't actually do any harm and maybe they will help.
But it is possible that the extra selectivity reduces the potential of the screen instead of improving it, and you would be better off using a pure random selector from your original set rather than trying to prune by adding rules.
It is definitely a real effect and something that I have started to become rather wary of.
There is also another factor at play with very high stock ranks. If you set your cut-off at about 70 then you select stocks with good performance and reasonable standard deviation around the mean. But as you push up towards 90 the standard deviation increases faster than the mean returns which makes subsetting become trickier - especially if you start adding other rules which might interact with the SR>90 rule in unknown and unexpected ways.
hi Nick,
Can you explain what you mean by this. I think I do understand but not 100%.
“But as you push up towards 90 the standard deviation increases faster than the mean returns which makes subsetting become trickier”
thanks
Hi bugsy,
Nick would no doubt explain this better than me, but I think he is away, so let me try to help in the interim.
What Nick had found was that at the very highest SRs you tend to get more extreme outperforms and more under-performers.
So whereas you expect any selection method to give some form of a 'bell curve' of performance; at the extremely high SRs both ends of that graph were higher than you would expect.
In terms of what you have been talking about on your thread I think it strengthens the case you make to buy the entire basket, rather than a subset that might be luckier than average or maybe unluckier.
Bear in mind my comment was in reference to the analysis which Ed had done in his article looking to see how representative a 20-stock portfolio was of all possible 20-stock portfolios with Stock Rank over 90.
Ed's approach was to choose random 20-stock portfolios and look at how wide the range of performance can be. I looked at the mean and standard deviation of the annual returns of all the stocks with StockRank>=90 as a way to characterise the same idea without running random simulations.
Now that is a slightly more stable analysis and a bit quicker to do, so I can look at other cutoffs and see how things change as we put the squeeze on.
Here's a worked example as of 26-July-2020 with a column (Number) showing how many stocks meet the rule StockRank >= x, and the resulting mean and sd for that set.
It is clear that for this particular point in time, until you get to SR >= 98 you will have to subset your portfolio using extra rules (even if it is random choice) to get down to a 20-stock portfolio. But the higher the 'sd' the wider the likely range of results you can get if you choose your portfolio randomly. (And if you apply extra rules you really have no guarantee that your rules are making things better unless you prove it by back-testing.)
Squeezing too hard (e.g. requiring SR >= 97) can give better results but it also can give worse results more often than for a lower SR limit (and really we should look at how this performs over multiple years of doing this to form a fuller opinion.)
These days I tend to concentrate much more on how to reduce standard deviation of returns. (i.e. to reduce the volatility of my portfolio taken as a whole.) I have found that using longer periods (five year RS or five-year ROCE, etc) is a useful approach. And as I mentioned in a later comment in this same thread, the Investment Trusts with good five year records and lowish volatility ( < 40%) (e.g. Scottish Mortgage Investment Trust (LON:SMT) Polar Capital Technology Trust (LON:PCT) Allianz Technology Trust (LON:ATT) Edinburgh Worldwide Investment Trust (LON:EWI) and others) perform very well when compared against high StockRank portfolios.
Unfortunately very few ITs show up in normal screens, even if you only screen for Price Change and Volatility (which are known for all ITs - but ITs without stock rank data never quality for a screen.) But you can look at them all from the Browse Sector web pages and sort on various columns.
A quick mea culpa. The table in previous comment uses stock ranks at the end of the period instead of stock ranks at the beginning of the period, which gives a rather misleading impression! (I blame answering comments at 1 o'clock in the morning!)
Anyway, the true picture is quite complicated because for example, Stock Ranks have performed quite poorly over the last year with COVID etc. So I won't try to fix up one table with another dubious one from a cherry-picked year. The principle is basically right but the picture is very untidy from year-to-year.