SIF Income Portfolio Q3 review: my rules cost me two takeover offers!

It’s been a good year so far for my rules-based SIF folio, but it’s been a good year for the wider UK market too. This means that so far in 2025, SIF has been pretty much level-pegging the FTSE All Share index.
Even so, with a total return of around 17% for the first nine months of this year, I’m quite happy with the outcome to date. Maintaining this result through to the year end would make 2025 the portfolio’s third-best year since its inception in 2016.
In this review I’ll provide a run-down of performance in Q3 and review the unusually small number of trades I made during the quarter.
I’ll also provide a snapshot of the portfolio as it was on 30 September – and an update on my position sizing.
How the SIF folio works: as a quick reminder, here is a summary of the rules I use to run this portfolio:
I select shares to buy from my buying stock screen in a weekly review, adding new shares when possible, while taking into account diversification by sector and the number of existing holdings;
Shares are held for a minimum of nine months. However, if they issue a profit warning or fall by more than 25% below the portfolio’s cost price, they’re sold at the next weekly review;
After nine months, I test shares against my selling stock screen. If they pass they remain in the portfolio subject to a rolling monthly review. If they fail, they’re sold.
SIF Q3 2025 Performance Review
(For some background on Q3 performance, you can find my 2025 half-year review here.)
The SIF portfolio delivered a total return of 7% during the third quarter, including dividend income. This was broadly in line with the total return from the FTSE All Share (note that the chart below only shows the index’s price return, not including dividends):
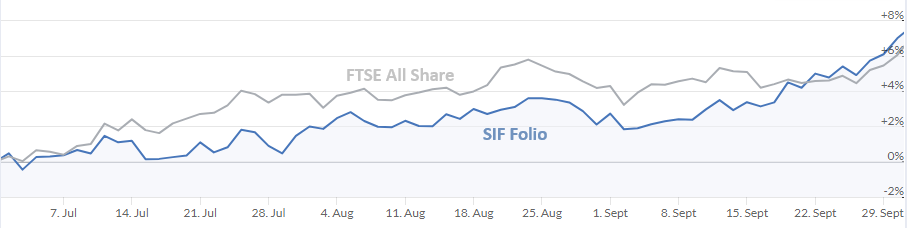
Here’s how this breaks down into a split between dividends and share price gains for both SIF and its FTSE All-Share benchmark:
Q3 2025 | Price Return | Income | Total Return |
SIF Folio | 6.3% | 0.7% | 7.0% |
FTSE All-Share | 6.1% | 0.8% | 6.9% |
9M 2025 | |||
SIF Folio | 13.7% | 3.3% | 17.0% |
FTSE All-Share | 13.3% | 3.3% | 16.6% |
Taking a longer view, here’s how SIF has performed since inception in April 2016:
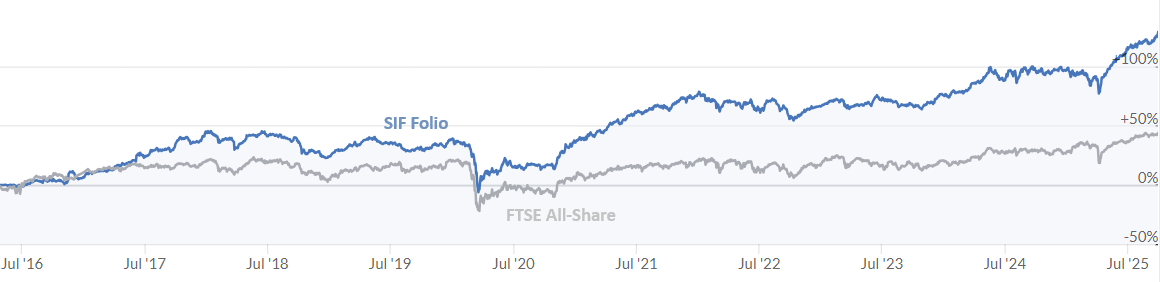
This is equivalent to a gain of 131% since April 2016, or 9.2% annualised (including dividends from 2025 only).
The FTSE All Share index has risen by 45% over the same period, giving an annualised return of 4.0%.
SIF Portfolio Review
The third quarter was notably quieter for trading activity in the portfolio. This was due to two factors. In terms of buying, the number of shares in my screening results fell, and most of those that did remain were already in the portfolio.
For selling, I found that many of the stocks that reached their nine-month review date still passed my screening rules and so have been able to remain in the portfolio. The average holding time of my positions seems to be creeping higher, but it’s too soon to say if this is a lasting change resulting from my income tilt or just a short-term variation from the norm.
The end result was that I added two new shares and sold three shares during Q3, leaving the portfolio with an unchanged 20 holdings. That’s in line with my target size for SIF.
After running a little low during Q2, the portfolio’s cash weighting recovered somewhat during the third quarter thanks to a couple of profitable sales and some dividends:
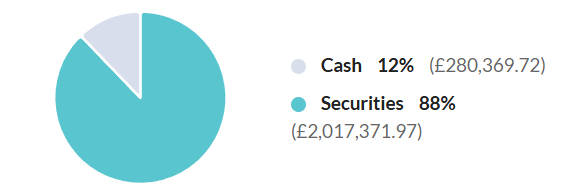
This has given me sufficient headroom to review SIF’s standard position size and increase it to £90,000 for the third quarter, from £80,000 previously. As a reminder, I calculate position size by deducting 20% from the value of the portfolio and then dividing by 20.
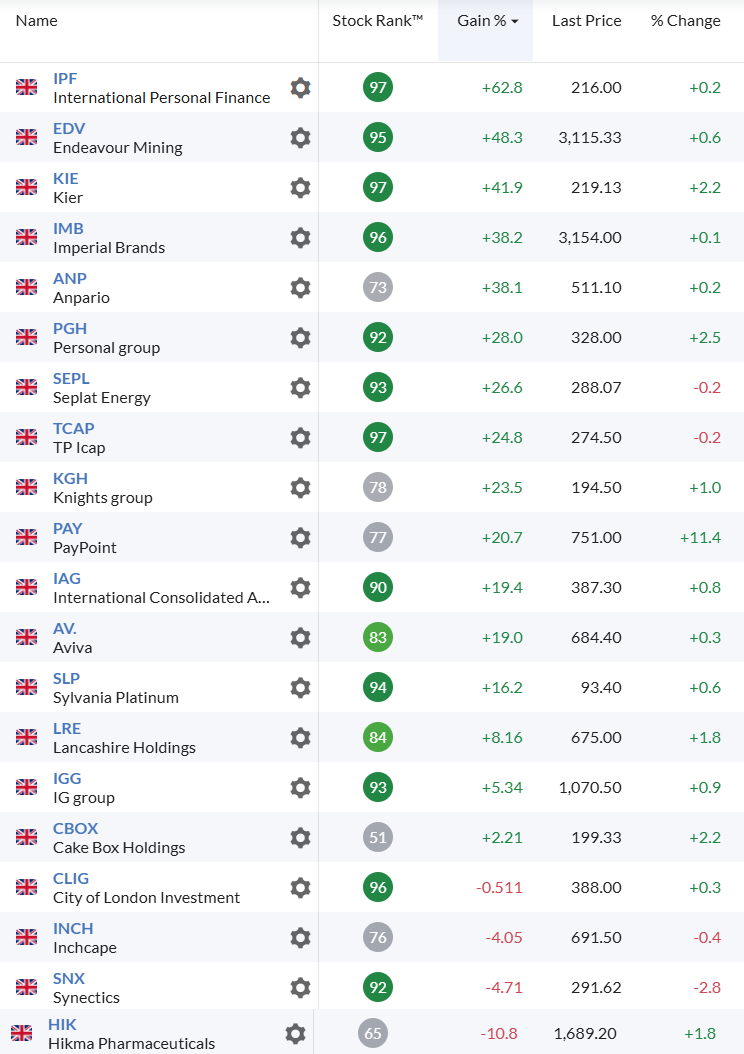
Here’s a snapshot of the SIF portfolio as it stood on 1 October 2025, prior to any month-end sales:
Portfolio metrics
At the start of this year, I introduced a new reporting measure I’m using to track the overall valuation of the portfolio. I find the table below is a useful way of checking for any drift in style and monitoring whether the portfolio is getting cheaper or more expensive.
As was the case in Q2, the portfolio got slightly more expensive on a P/E and dividend yield basis in Q3. However, the fall in the portfolio’s PEG ratio arguably means it became a little cheaper, when adjusted for expected earnings growth.
In either case, I’m quite happy with these metrics. Notably, the portfolio’s average dividend yield is now nearly 50% higher than the wider market average of 3.3%, giving me confidence that I’m meeting SIF’s income mandate:
Period | P/E rolling 1y | Div yield rolling 1y | PEG rolling | Cash weighting |
Q1 2025 | 9.7 | 5.3% | 1.0 | 13% |
Q2 2025 | 10.2 | 5.0% | 1.9 | 5% |
Q3 2025 | 10.3 | 4.8% | 0.8 | 13% |
In the remainder of this article I’ll review the portfolio’s trading activity during the third quarter.
SIF portfolio changes in Q3
Stocks sold in Q3
Three stocks were sold during the third quarter. Happily all three turned a profit for the portfolio, with two delivering a 20%+ total return.
Unhappily, two of these three received takeover/take-private offers shortly after I sold! I think that must be some kind of record for me, albeit not one I want to repeat.
Epwin (LON:EPWN)
This UPVC door and window specialist caused me no anxiety and delivered a respectable 21% total return, including a useful 6% income yield.
I sold Epwin on a technicality after 11 months because the stock failed to of my momentum screening rules:
Unfortunately, the market had the last laugh. On 7 August – just one week after I sold – Epwin received a cash takeover offer at 120p. Staying put for another week would have added another 23% to my overall return!
Bought: 85p on 13 Aug 24
Sold: 97.3p on 29 Jul 24
Income return: 6.0%
Total return: +20.5%
Yu (LON:YU.)
This business utility supplier has remained stubbornly cheap despite impressive quality metrics, on a P/E of 6.
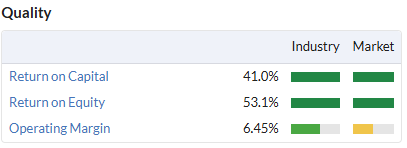
In its H1 trading update on 22 July 2025, the company said lower wholesale power prices had increased competitive pressure and resulted (understandably) in lower revenue. I commented that the update didn’t split out the impact of volume and price on revenue, but my feeling was growth may have slowed in H1.
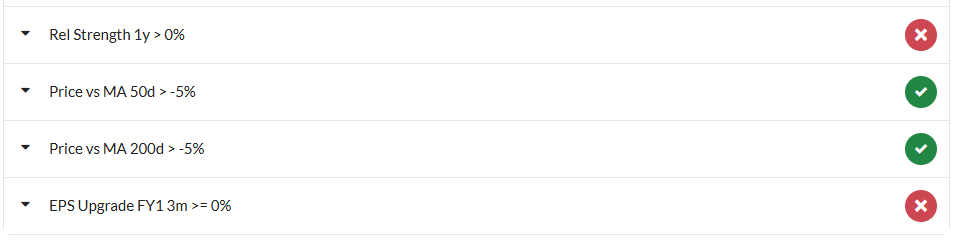
One week later when I reviewed SIF’s holding at the end of its nine-month holding period, I found that it failed three of my momentum rules – perhaps suggesting other investors were also pulling back slightly:

September’s interim results showed H1 earnings up by 2% – well below the 11% rise reported for FY24. Management left full-year guidance unchanged, but reiterated their comments about competitive pressures.
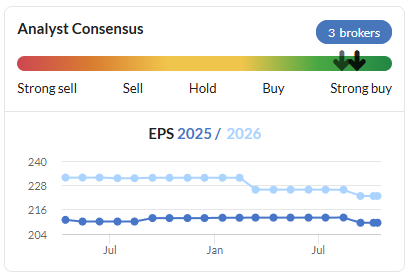
Broker Cavendish left forecasts unchanged on the day, but the Analyst Consensus trend chart on the StockReport suggests at least one other broker may have trimmed its forecasts:
The algorithms remain positive, awarding Yu Super Stock styling and a StockRank of 94.
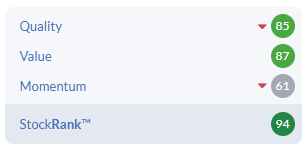
Certainly the shares still look very affordable to me, so perhaps this will reward further patience.
Bought: 1,535p on 2 Oct 24
Sold: 1,530p on 29 Jul 25
Income return: 2.7%
Total return: +2.3%
Petershill Partners (LON:PHLL)
This private equity-focused investment trust made a strong contribution to SIF’s income mandate during its holding period. SIF’s Petershill shares generated an impressive 14.7% income return thanks to two generous special dividends that were paid following asset sales.
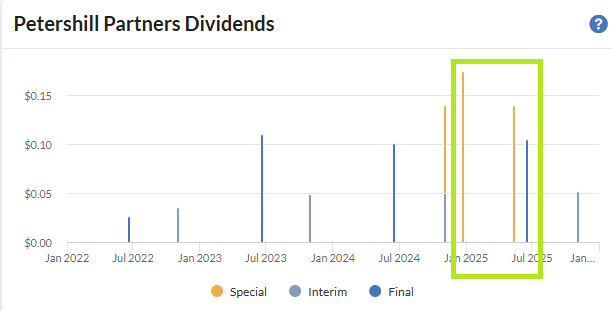
Unfortunately it seems that Petershill’s board (and majority shareholders) subsequently ran out of patience with the stock’s discounted valuation and decided to delist the remaining minority of shares.
I sold on 29 July at 234.5p, but if I’d held on until 25 September, I would have been able to sell for over 300p following the company’s proposal to provide a return of capital of $4.15 (c.309p) to holders of the soon-to-be delisted shares.
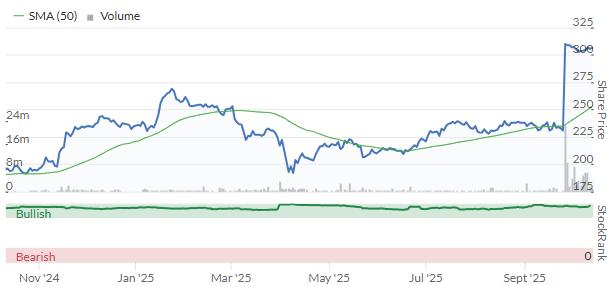
Bought: 219p on 22 Oct 24
Sold: 234.5p on 29 Jul 25
Income return: 14.7%
Total return: +21.3%
New stocks added in Q3
Here’s a list of the new stocks I added to SIF (and my personal holdings) during the third quarter.
Name | Date | Price paid | Comment / recent DSMR commentary |
Lancashire Holdings (LON:LRE) | 12 Aug 25 | 624p | This specialist insurer is a complicated business to analyse, but recent results showed a resilient H1 performance despite the impact of January’s California wildfires. Management has reiterated guidance for a double-digit return on equity for the full year. The exceptional 12% forecast yield is dependent on a special dividend, but credible given similar payments in some previous years. |
Sylvania Platinum (LON:SLP) | 16 Sept 25 | 80.4p |
I'll be back early in the New Year with my 2025 review of the portfolio. In the meantime, if you have any thoughts or questions on SIF, please drop them in the comments below and I'll do my best to address them.
Disclosure: Roland owns all of the shares listed in the SIF portfolio.
Disclaimer
This is not financial advice. Our content is intended to be used and must be used for information and education purposes only. Please read our disclaimer and terms and conditions to understand our obligations.

8 comments
A good read, thanks.
Curious though how you managed to sell Epwin before you had bought them?
Hi Roland,what is the reasoning behind deducting 20% from value of SIF portfolio & dividing the sum by 20 to decide on weighting to each stock?In my experience &in retrospect if I had known which holdings would outperform massively my allocations to some stocks would have been different
Hi monday55,
For clarity, I give each stock an equal weighting. I don't know which will outperform - and I don't try and guess.
The formula I use (subtract 20% from the portfolio value and divide by 20) is used to calculate the standard position size. I use this size for every holding.
The logic behind this approach is to try and ensure that the portfolio never runs out of cash to be able to open new positions. Even if I have to sell a string of stocks at a loss in a market crash or similar, I should have enough cash left to open new full size positions.
This approach has worked for nearly 10 years, so it's either a) sensible or b) too conservative!
I hope this helps, please do let me know if it's not clear.
Roland
Hi Roland,
What would be the rule if a company issues a profit warning, it’s sold, and in the next weekly review appears at the top of the buy list? Would this be a special case where rules would be overridden?
Hi Abel,
This type of issue has rarely arisen, because a profit warning usually leads to a cut to earnings forecasts and some negative share price momentum. For these reasons, stocks tend to disappear from my screen after a profit warning as they no longer pass my momentum rules.
Having said that, this has happened occasionally over the years. When it has done, I have usually exercised some discretion and chosen not to buy the stock.
While I don't mind owning shares more than once, I tend to leave a decent interval between holdings -- typically enough time for a fresh set of accounts and broker forecasts to be published.
Roland
Thanks, I found your research very helpful.
Over the past couple of weeks, aside from Lancashire Holdings and Sylvana Platinum, the Buy in Focus rule has also highlighted Rank. Is there a particular reason why it hasn’t been included in the list of stocks to add?
Hi Giuseppe,
Thanks for your comment. I did actually add Rank (LON:RNK) to the portfolio earlier this month (7 Oct), but as that was a Q4 trade, it isn't included in today's article, which covered Q3 only.
Roland
Disclosure: I hold Rank
Thanks a lot Roland.
In addition to your comprehensive quarterly reviews, I would find it interesting to hear of the changes you make, shortly after you make them; not in a long article, but just in the form of a few notes, if possible. A list of what's in and when it was added would be good.