
Good morning!
Today we have:
- CMC Markets (LON:CMCX)
- Allied Minds (LON:ALM)
- Judges Scientific (LON:JDG)
- Naked Wines (LON:WINE)
- Knights Group (LON:KGH)
- HSS Hire (LON:HSS)
- Manolete Partners (LON:MANO)
Finished around 5.30pm.
CMC Markets (LON:CMCX)
- Share price: 136.7p (+8%)
- No. of shares: 289 million
- Market cap: £395 million
These are terrific results.
I bought a few of these shares at around 87p in February, but didn't have the conviction to hold on to them, and don't currently have a position. I remain heavily long IG Group (LON:IGG).
But wow, what a performance from CMC.
It has taken me a few minutes to figure out how they did it. Here's the answer, in a table:
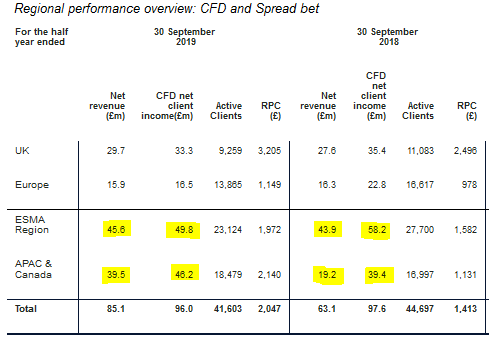
Let me explain what's happening here!
Definitions:
- Net client income is the trading income for CMC from client activity: spreads, financing charges and the like.
- Net revenue is trading income minus introducing partners commissions and betting levies.
Now let's see what happened:
- In H1 last year, ESMA trading income was £58.2 million (you'll find that number in the table above).
- We also know that ESMA trading income fell to £54.6 million in H2 last year.
- And we know that ESMA trading income fell again in H1 this year, to £49.8 million (also shown in the table above).
Clients (particularly retail clients) are trading much less than they used to, thanks to ESMA's leverage restrictions and other rules.
With client activity falling, you would expect ESMA revenue to fall, too.
But this is not exactly the case!
- H1 2019 ESMA net revenue: £43.9 million (shown above)
- H2 2019 ESMA net revenue: £30.5 million
- H1 2020 ESMA net revenue: £45.6 million (shown above)
If you remember the definition, net revenue is trading income minus introducer commissions and betting levies.
In the last six-month period, CMC has figured out a way to spend many millions of pounds less on CFD introducer commissions, without revenue falling off a cliff.
As you might expect, the number of clients isn't growing (minus 1% for the ESMA region versus H2 2019). And trading income per client is down, too. But revenue per client, thanks to the savings on introducer commissions, is up by a massive 51% compared to H2 2019!
The commentary talks about "a focus on user experience".
"...we have also been improving user experience, particularly on mobile, which is leading to better retention of existing clients."
Additionally, the company talks about "adjustments" to the risk management strategy, with less hedging activity taking place - it sounds like the exposure to client P&L might have ticked up a notch. This sentence stands out to me:
"Even with reduced hedging activity, a significant amount of net client exposure continues to be hedged with our prime brokers."
I'd be interested to know whether increased internal hedging has fully offset the reduced external hedging.
More positively, the company talks about its focus on "acquiring and retaining higher value, sophisticated clients". I believe that IG has led the industry when it comes to this strategy, but the numbers would suggest that CMC is also now very good at it.
APAC & Canada: if you scroll back to the table above, you'll see that there was also a huge (£20 million) increase in net revenue from the APAC & Canada region. Of this increase, only £7 million was from increased trading income.
Commodity trading is said to have picked up in this region. And in the absence of ESMA rules, client numbers are still growing. And with introducer commissions falling, the end result was a blistering increase in profitability from this region.
Stockbroking: this segment is doing very well indeed. Revenue is up £17 million to over £26 million, and net revenue nearly trebles to £14.5 million.
Operating expenses increased by 13% compared to H1 2018. Marketing expenses were down slightly, but staff were rewarded well for the company's financial success.
Final result: With net revenues from CFDs and stockbroking growing much faster than operating expenses, we get terrific operating leverage (the sort of thing that I was hoping for from CRL yesterday, to be frank). H1 pre-tax profit quadruples to £30 million.
Outlook: positive and excited. Net operating income expected to come in at more than £180 million for the full year, so the H2 result will be at least 80% of H1's. This can be a volatile business.
My view: the company has exceeded my expectations.
Note that if H2 net operating income is only around £80 million, as suggested by the outlook, and if expenses are flat, then operating profit for H2 will fall back to £10 million - operational leverage in reverse. But full-year operating profit would still be around £40 million, or c. £32 million after applying a normal tax rate.
IG currently trades at 16x forward earnings. If you put CMC at 14x, then maybe a "fair" market cap would be around £450 million.
As today's results demonstrate, however, the company has the potential to significantly outperform these earnings estimates. And if the stockbroking product continues to grow, and CFD revenues are stable or growing from the current levels, then profitability over the next few years could be a major positive surprise and justify a significantly higher market cap.
I continue to be a big fan of this company, and am tempted to buy back in. But it's comforting to continue holding shares in its larger rival.
Allied Minds (LON:ALM)
- Share price: 50.1p (+1%)
- No. of shares: 241 million
- Market cap: £121 million
Crystal Amber requisitions GM of Allied Minds Plc
Allied Minds is an old friend of mine. I identified it as a sell when the share price was around 720p and the market cap was over £1.5 billion, back in 2015.
Those were the days when everything that Neil Woodford touched was considered to be golden. People chased up his shares for no particular reason other than that he owned it. Allied Minds made it into the FTSE-350 index, so that even respectable funds and conservative investors were forced to consider its merits for their UK portfolios.
Those days are long gone, of course. Now, Allied Minds is a tasty carcass for scavengers such as Richard Bernstein at Crystal Amber.
But it's proving troublesome to digest. Unlocking what remains of its cash for the benefit of shareholders is going to take some doing.
It starts with a letter. Crystal Amber wants a meeting to turf out the entire Board, except for the senior independent director.
According to Crystal Amber, ALM has ongoing costs of $7.5 million p.a. at headquarters, despite the fact that this VC investment vehicle is in wind-down mode, and will not be making any new investments.
The cash burn at ALM has always looked completely crazy to me, so I am happy to endorse the Crystal Amber view on this.
I would be interested to know what they think the HQ costs at ALM should be. Their proposed substitutes were able to reduce administrative costs at a similar business down to $1.4 million p.a. - that would be far more reasonable.
ALM could make for an interesting "value" play, but only if Crystal Amber wins this boardroom battle.
Judges Scientific (LON:JDG)
- Share price: £50.70 (+1%)
- No. of shares: 6 million
- Market cap: £314 million
This dividend is worth more than £12 million.
The Board has assessed the Group's cash resources, its robust cash generation and the Group's ability to borrow for acquisitions, which result from a sustained period of strong performance. The special dividend will absorb a modest proportion of the resources available to conduct acquisitions and the Board is therefore confident that this special dividend will not interfere with the execution of Judges' unchanged buy-and-build strategy.
At the most recent interim results, Judges announced that its cash balances had increased to over £20 million, though it also had bank debt of over £13 million.
Some investors will interpret the news of this dividend positively, as a sign of the company's shareholder focus. If I put my sceptical hat on, however, I would ask if perhaps this is a sign that the company has reached its maximum size?
I can see no record of it having previously paid a special dividend. If it now prefers to send surplus cash back to shareholders, on the basis that it doesn't need it to execute the strategy, then what else can we realistically conclude?
It says to me that it's not possible to deploy any more cash in this strategy, at least without diluting returns. It could be a sign that the days of extremely strong compounding returns are mostly behind us.
Perhaps Judges will become a dividend-paying cash cow for shareholders, rather than a compounding machine?
Naked Wines (LON:WINE)
- Share price: 258p (-2%)
- No. of shares: 73 million
- Market cap: £187 million
This was formerly "Majestic Wines".
Continuing operations (online wine retailing) show a little top-line growth, but the company remains loss-making even on an "adjusted EBIT" level.
Overall trading is not great; it sounds like a small miss against expectations. Things are sluggish (management also use the word "lacklustre") in the UK and Australia
Trading has been broadly on track in the first half. Naked's US business is well up on the key measures of investment, payback and sales. Consistent with our disciplined approach to investment we will slow the rate of increase of investment in new customers in the second half, due to sluggish performance in the UK and Australian markets.
Despite this, management are very excited for prospects in the US, where they claim to have "an established leadership position in a large and growing market". A new CEO will take them forward - an internal hire who has been COO of the US business.
Balance sheet - the company will have cash of £50 million after making disposals.
My view - I'm warming to this company, as they have very helpfully broken down the contribution of new vs. existing customers.
New customers made a profit contribution of minus £10 million, due to customer recruitment costs. But the company thinks there is strongly positive payback over multiple years, from this recruitment activity.
The contribution from repeat customers was plus £19 million, which is more than enough to cover fixed costs.
I haven't studied it in sufficient detail to understand whether their strategy of building an online community of wine drinkers and winemakers is truly disruptive, but I like what I've read so far!
Knights Group (LON:KGH)
- Share price: 329p (-0.6%)
- No. of shares: 73.8 million
- Market cap: £243 million
Knights, one of the UK's fastest growing legal and professional services businesses, today provides a trading update for the half year ended 31 October 2019.
This update is in line with expectations. There is plenty of recruitment taking plae, and new larger offices in Manchester have been rented.
Stocko is neutral, giving it a rating of 46/100, and I am, too.
HSS Hire (LON:HSS)
- Share price: 38p (+9.5%)
- No. of shares: 170 million
- Market cap: £65 million
I've been a bear on this one for a long time, but the market liked this update. Trading is in line with expectations.
The financial highlights table gives us adjusted EBITDA and adjusted EBITA numbers, and provides a ROCE figure based on EBITA.
EBITDA is plainly a nonsense figure for an equipment hire business. Depreciation is a major ongoing expense! For example, EBITDA was £18 million in H1. So there is little point in looking at a pre-depreciation measurement of profit, in my view.
Amortisation (the A in EBITDA and EBITA) can also be significant. In H1, the amortisation charge was £3 million, charged mostly to customer relationships and software. Excluding goodwill, there are nearly £37 million of intangible assets on the HSS balance sheet, which need to be amortised.
So I'm not entirely relaxed about leaving out amortisation, either.
Leaving these concerns aside, there is no doubt that this is a promising update: adjusted EBITA improves from £11.5 million to £19.2 million, for a 39-week period (three quarters of the year).
The debt pile has reduced, but net debt/adjusted EBITDA is still sitting at 2.9x.
I remain extremely wary of this company, based on its track record, leverage and the presentation of its results, but I must reluctantly concede that it could justify the current market cap over the next few years, if it hits forecasts.
Forecasts are:
- 2019 EPS 1.1p
- 2020 EPS 2.6p
- 2021 EPS 4.0p
So the PER goes falls to single digits at the current share price, if it performs as expected. Not something I'd want to bet on, but others may differ!
Manolete Partners (LON:MANO)
- Share price: 470p (-8%)
- No. of shares: 43.6 million
- Market cap: £205 million
I'm going to outsource this analysis to abtan, who wrote a detailed comment in the thread below. Thank you, abtan!
It's tough covering lots of different companies - I couldn't do it properly without the feedback I get from you all. Cheers.
Thoughts from abtan, who is long MANO:
Initial results looked good until one realises that a rather large chunk (75%) of the reported revenue is unrealised.
This was worrying at first, but I was somewhat reassured after digging into some of the numbers:
- 18 completed cases in the period generated £1,904k of realised revenue.
- The unrealised revenue previously included in the accounts for these cases was £1,109k.
- So there was actually an understatement of £795k for the 18 cases ie an average revenue understatement per case of c£44k
- This implies there was no over-exaggeration in previous financial statements
- This hopefully implies that any other unrealised gains being recognised right now are also not being overstated.
Some more points:
- I note that Manolete Partners (LON:MANO) bought a London property in order to allow creditors to be paid for one of its cases. The property is now actually being sold for a small profit < 1 year later, however, I found this unusual, especially as £50k was also spent on refurbishing the property. I'm personally not happy that the company is involved in this sort of arrangement.
- On a similar note I noticed that the company had extended a loan of £500k to FH Gilman (albeit on a high 10%+ interest rate) secured against land in Lincolnshire valued at £2.4m This too is off putting, despite the apparently favourable terms.
- 2016 Vintage (which have all concluded) Total Invested figure has changed from £1,833k to £1,895k - WHY? This is actually my biggest concern from today's report. I'm never fan of numbers changing for no reason, especially in this case where all 2016 cases were concluded a long time ago.
Re. point 3, this was the company's response, which I just received:
"The 2016 Vintage was closed in FY19 but we incurred £60k of legal costs in FY20 in enforcing a settlement on one case for £1.9m, which was agreed in April 2018.
This settlement has now been paid in full and we received an extra £179k in interest and legal costs recoveries in the first half of FY20, after spending this additional £60k of legal costs."
Kudos for the prompt response and positive outcome, however, it has raised a few questions about when cash is actually received.
I know Burford Capital (LON:BUR) were accused of not providing enough detail on cash collection in the recent short attack, and perhaps Manolete Partners (LON:MANO) should be more thorough going forward too. That aside, a re-assuring response.
Graham here. Hanging up my pen for today. Cheers!
See what our investor community has to say
Enjoying the free article? Unlock access to all subscriber comments and dive deeper into discussions from our experienced community of private investors. Don't miss out on valuable insights. Start your free trial today!
Start your free trialWe require a payment card to verify your account, but you can cancel anytime with a single click and won’t be charged.