"Speculative, Super Stocks" - love them or hate them, you can't beat them

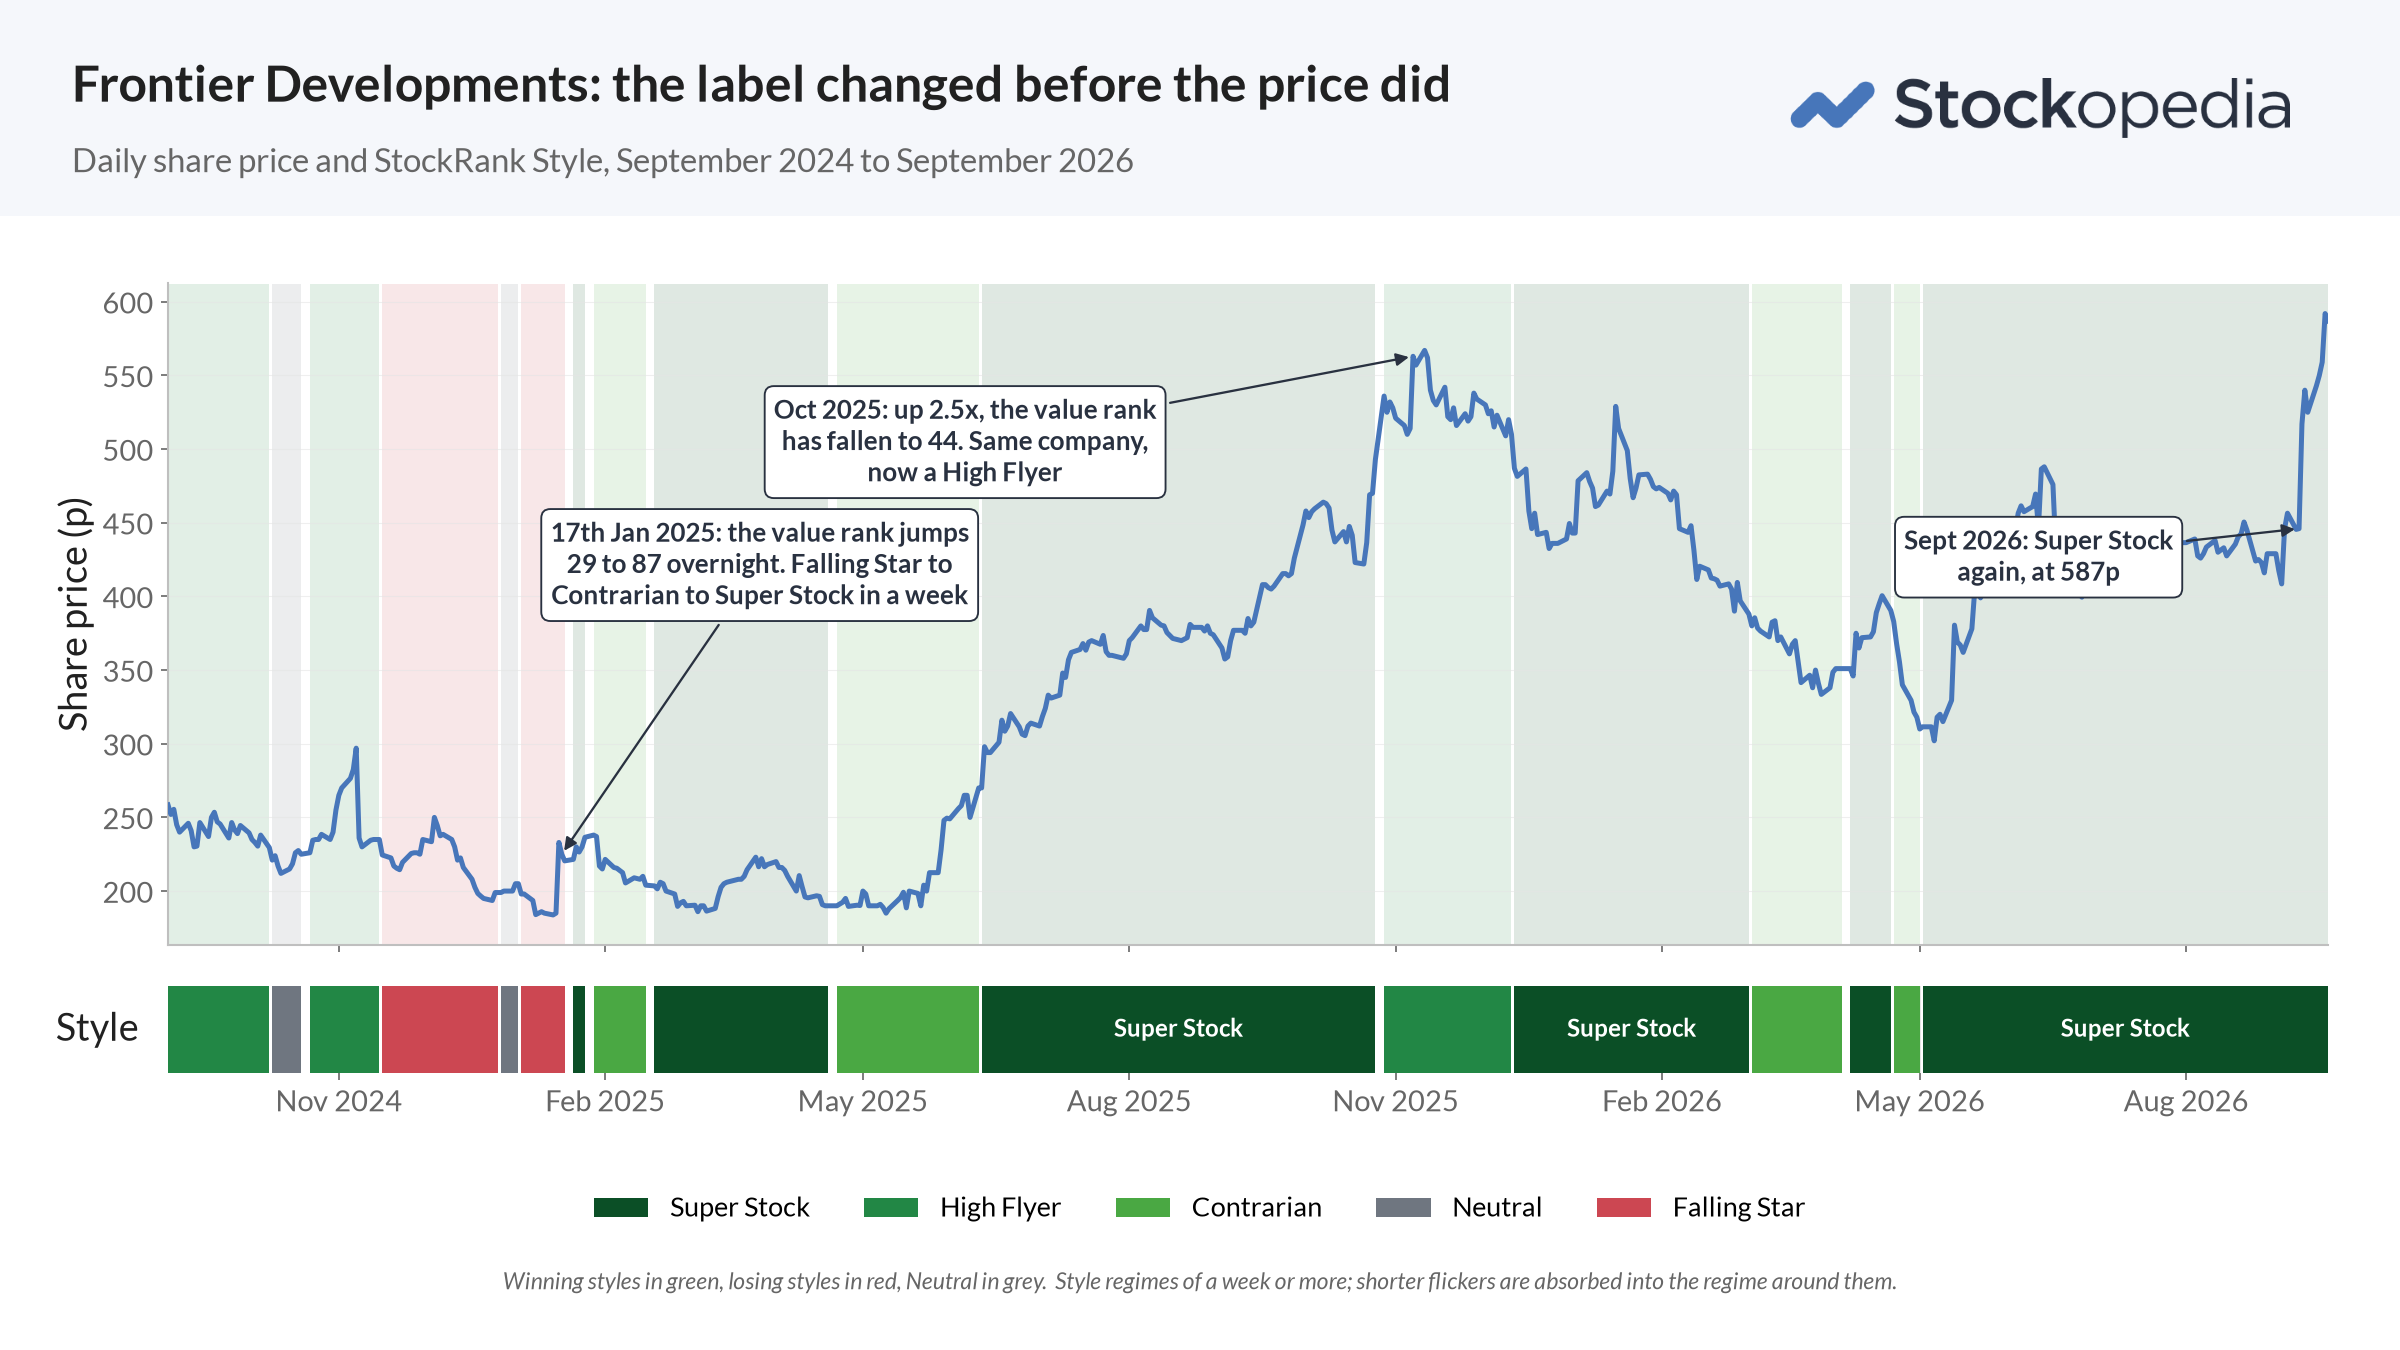
In last week’s newsletter, I mentioned Frontier Development’s stunning recovery over the last eighteen months. Back in 2024 Frontier’s share price had slumped more than 90% from its peak but was still classified as a Falling Star with a Value Rank in the 30s. But by early 2025, after strong interims showed its new strategy was working, its StockRank jumped from 54 to 95. That marked the bottom, setting the scene for an eventual tripling of the share price.
What’s more - the ranks and style classifications at the top of the StockReport began changing several months before the share price moved. The Value Rank rose from 24 in November to 89 in January (indicating the shares had become cheap), while the StockRank Style shifted from Falling Star to Neutral to Contrarian to Super Stock.
I’m always asked about the value of these StockRank Styles - and which are the most powerful. So in this article, and next month’s webinar - I hope to answer these questions.
What the classifications mean
In the header of every StockReport we publish several classifications.
- A Risk Rating (Conservative, Balanced, Adventurous, Speculative, Highly Speculative)
- A Size Group (Large, Mid, Small, Micro Cap)
- A StockRank Style (9 classifications from Super Stocks to Sucker Stocks)
If you put them together, they make a phrase. It’s often far more understandable than a page of data - “Highly Speculative, Small Cap, Super Stock” tells you a lot. That’s what Frontier is classified as today.
I won’t do a full explainer here - (you can learn more in the Academy) - but there are nine Styles, built from the share’s unique combination of Quality, Value and Momentum. The four winning styles are exposed to at least two of the three QVM factors. The four losing styles are exposed to at most one. Neutral is everything in between, and it makes up about a third of the market.
Frontier went on a journey from being a High Flyer (high quality and momentum, expensive valuation), to a Falling Star (profitable, still expensive but negative momentum), to a Contrarian (now cheap, but still no momentum) to a Super Stock (regaining its full mojo). The odds improved through this journey.
How the StockRank Styles have performed
We’ve been bringing the performance of our StockRank Style charts up to date using a new backtesting engine over our archive data. We’ve modelled the performance of each Style by creating equal weight portfolio, rebalanced once a year, with and without dividends, from April 2013 to September 2026.
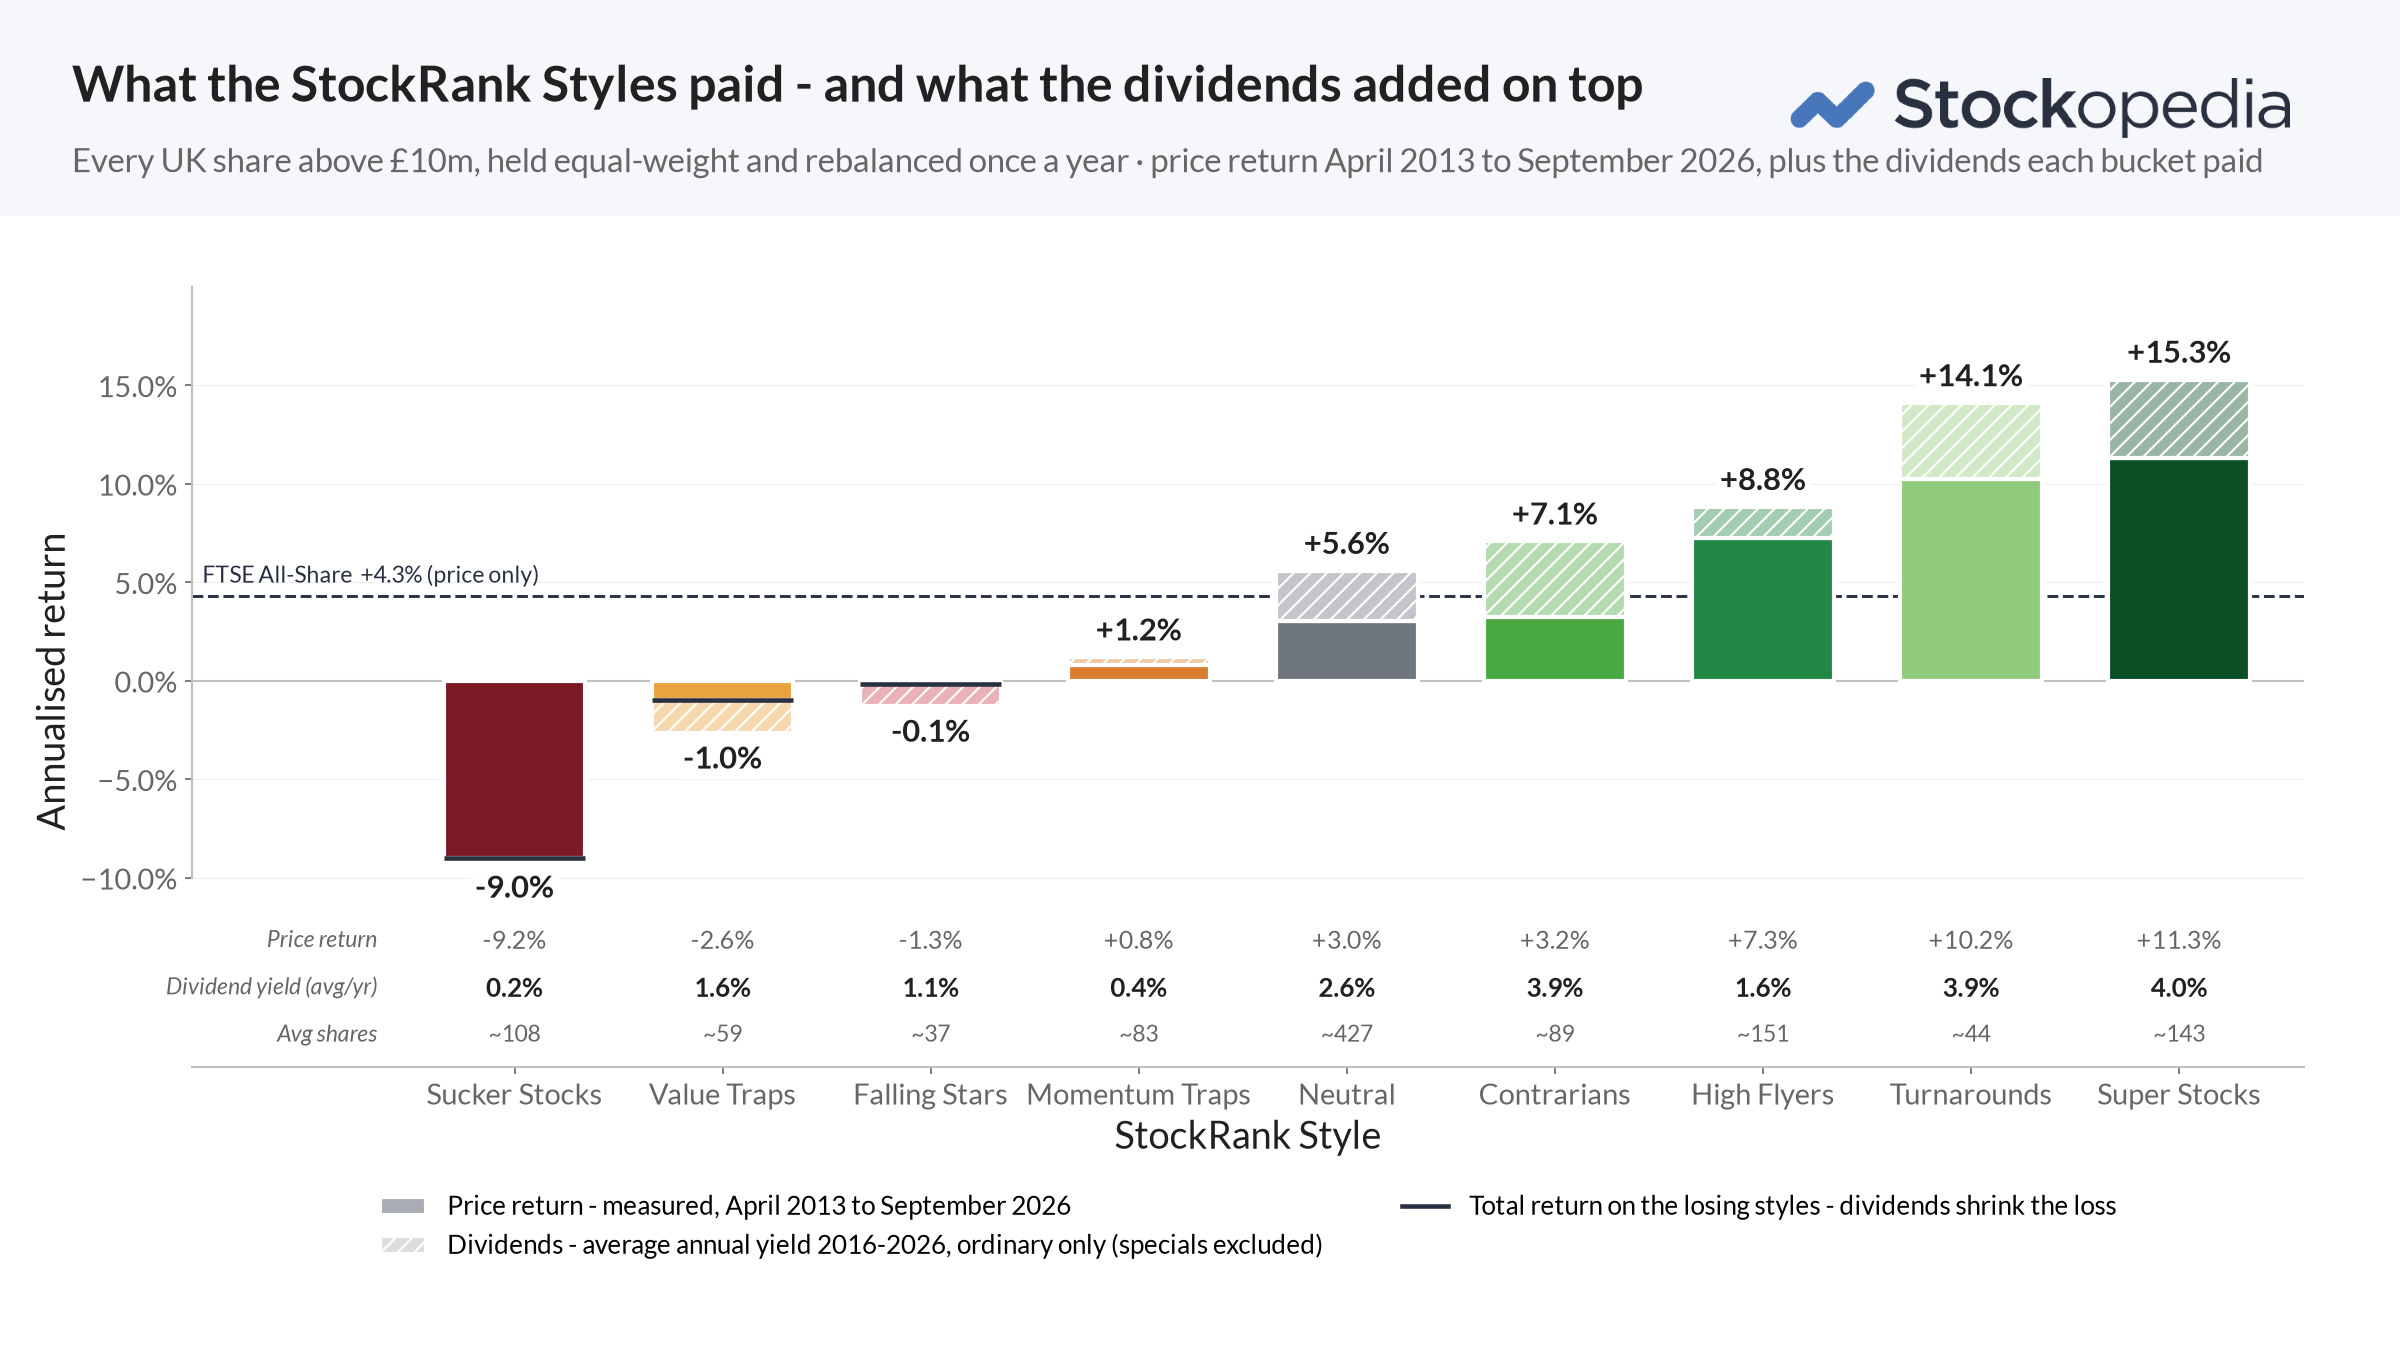
The solid bars are the price return. The hatched bands on top add the average dividend yield over the backtest periods. Super Stocks compounded at over 15% a year. Turnarounds at 14%. Sucker Stocks lost 9% a year.
The dividend layer is insightful. Super Stocks paid 4.0% a year and Turnarounds 3.9% - both styles contain cheaper shares, and generally in the UK cheaper shares pay dividends with higher yields. High Flyers paid only 1.6% in dividends - a lower yield from premium growthier names. Sucker Stocks paid only 0.2% - junk stocks do not pay dividends!
What if we cross the Styles with the Risk Ratings?
We publish five Risk Ratings based on each share’s price volatility - if we cross them with the 9 Styles - we can make 45 squares, every a unique portfolio. You may want to open the image below in a new tab (right click) so you can zoom in.
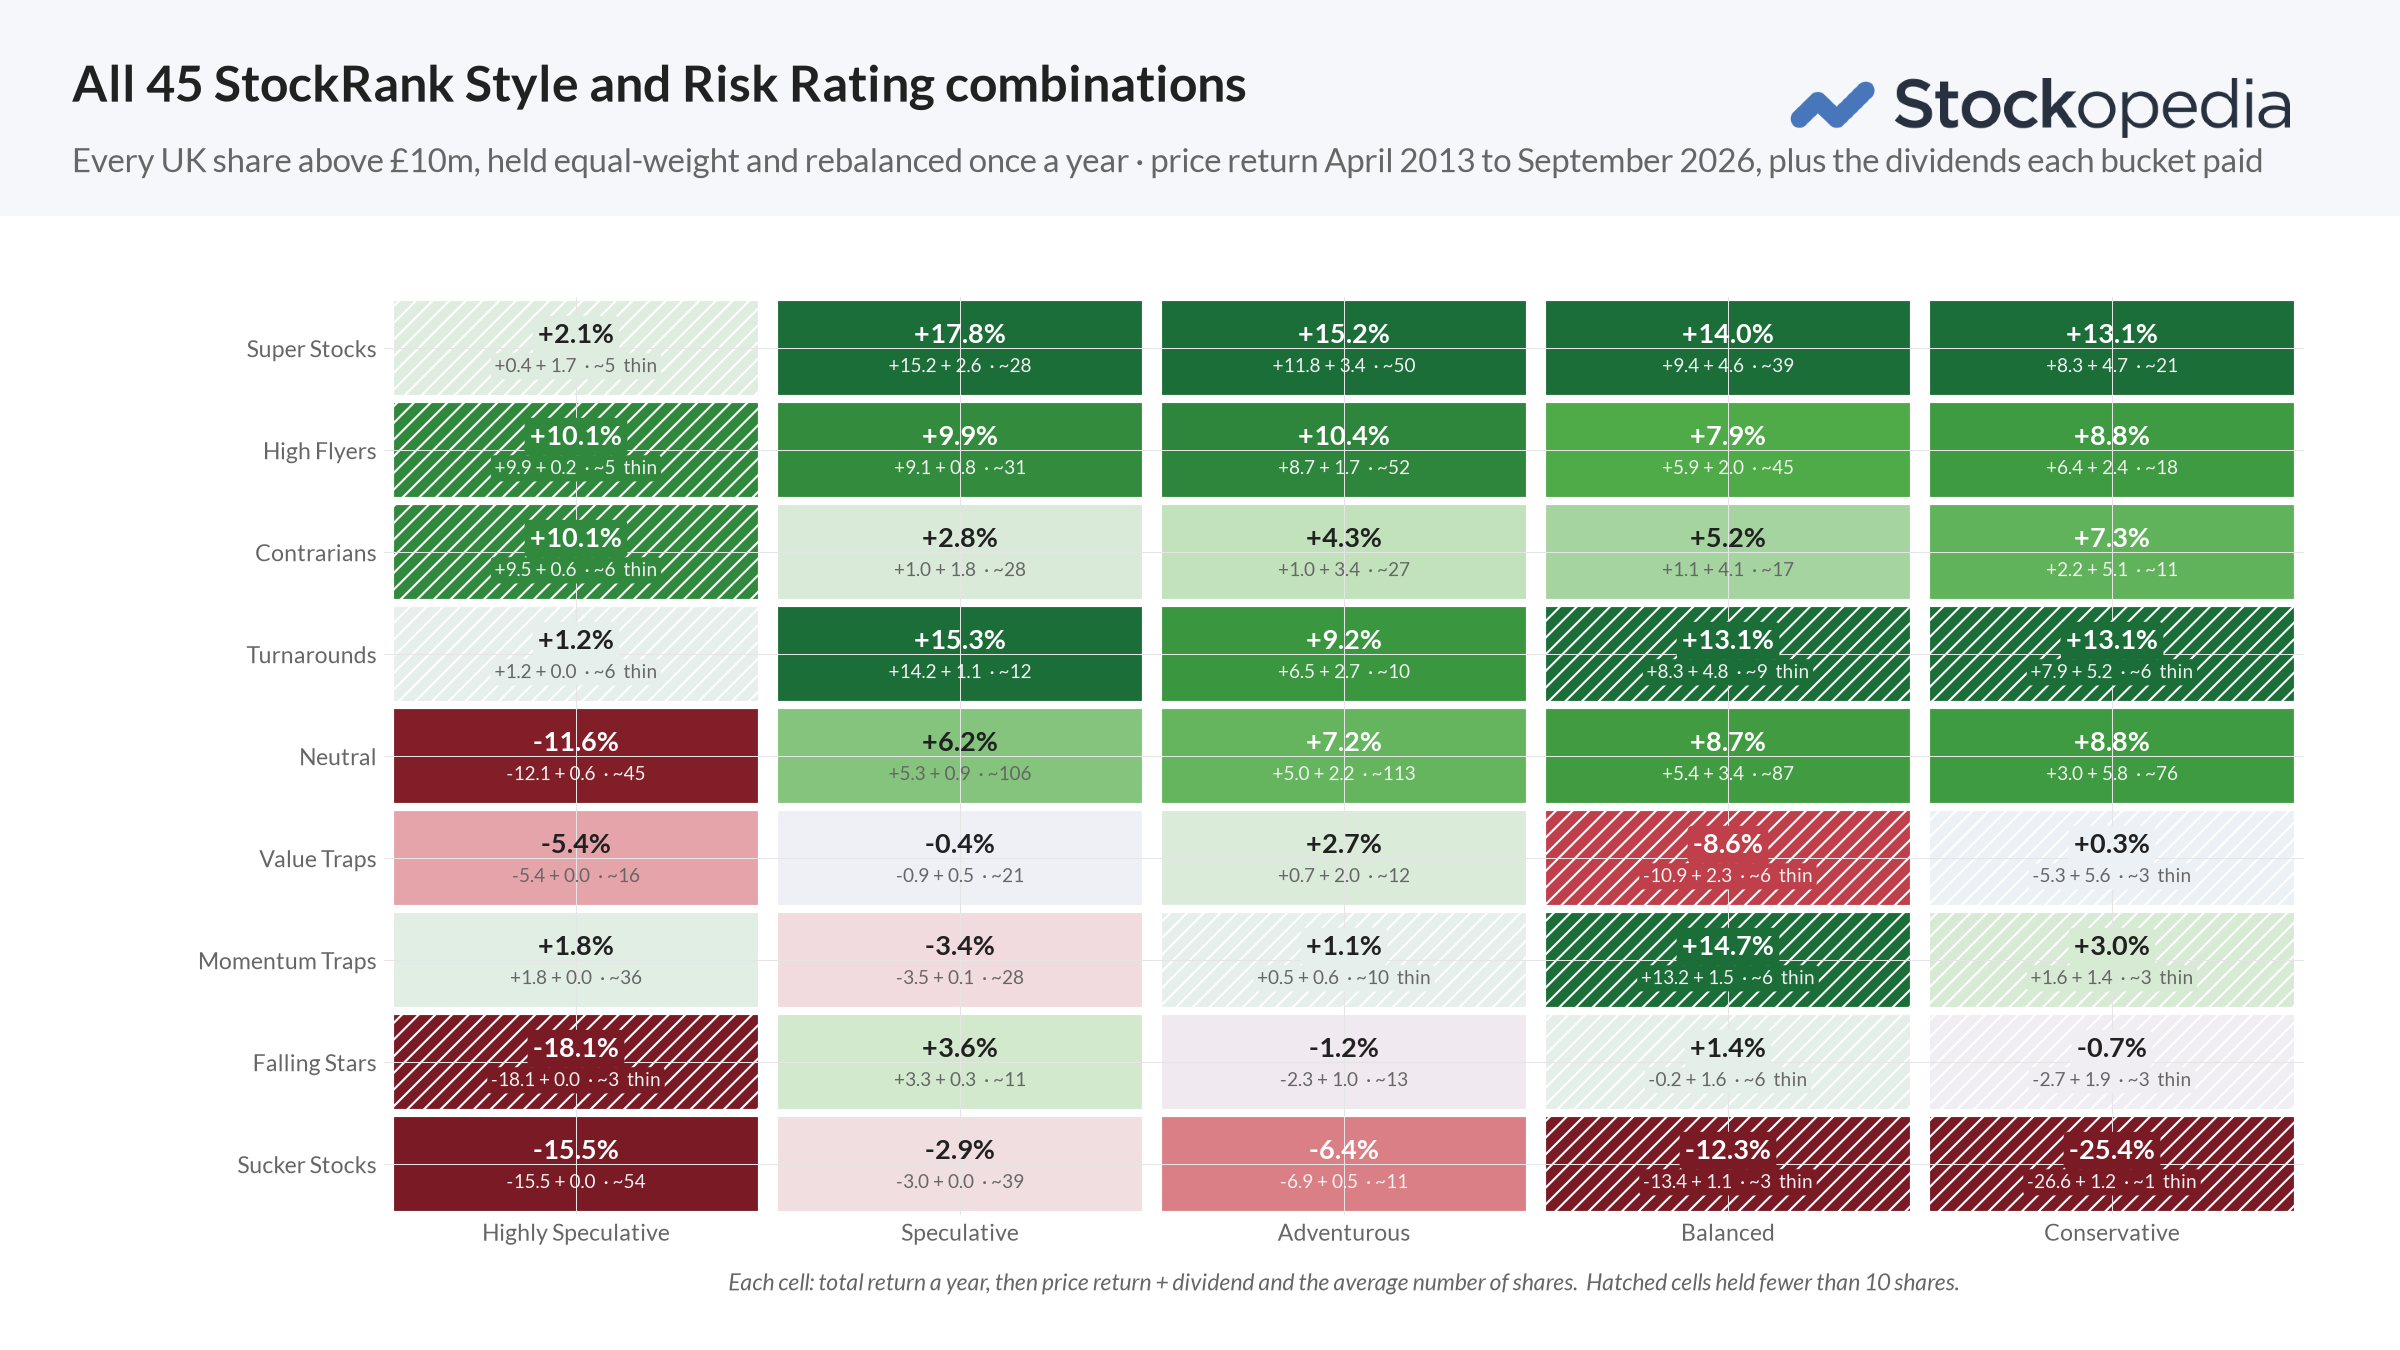
The columns read from Highly Speculative (on the left) to Conservative (on the right). The rows are Styles - you can see that Super Stocks beat High Flyers beat Neutral beat Sucker Stocks in almost every single risk band.
If you read across a row - you can see that risk is not always a reward. Yes it can be a multiplier on stocks that have good fundamentals. Among Super Stocks the riskier bands paid more, 17.8% a year for the Speculative ones against 13.1% for the Conservative. But Highly Speculative shares are generally a very bad bet - Neutral Highly Speculative stocks lost 12% a year, and Highly Speculative Sucker Stocks -15%. Taking risk when the fundamentals are against you is the most expensive thing you can do in investing.
Of course, my eyes only see one cell - Speculative Super Stocks returning 17.8% a year. That’s 15.2% of price return plus 2.6% of income, across an average portfolio size of 28 shares. In a cost-less world, that would turn £100 into £676 over the study period. Realistically, there’s a couple of percent of annual cost - so the return moderates - but it’s eye-opening.
How does a portfolio of Speculative Super Stocks perform?
For fun I ran a little ladder - how does a portfolio perform of the top 30, top 20 and top 10 Speculative Super Stocks by StockRank?
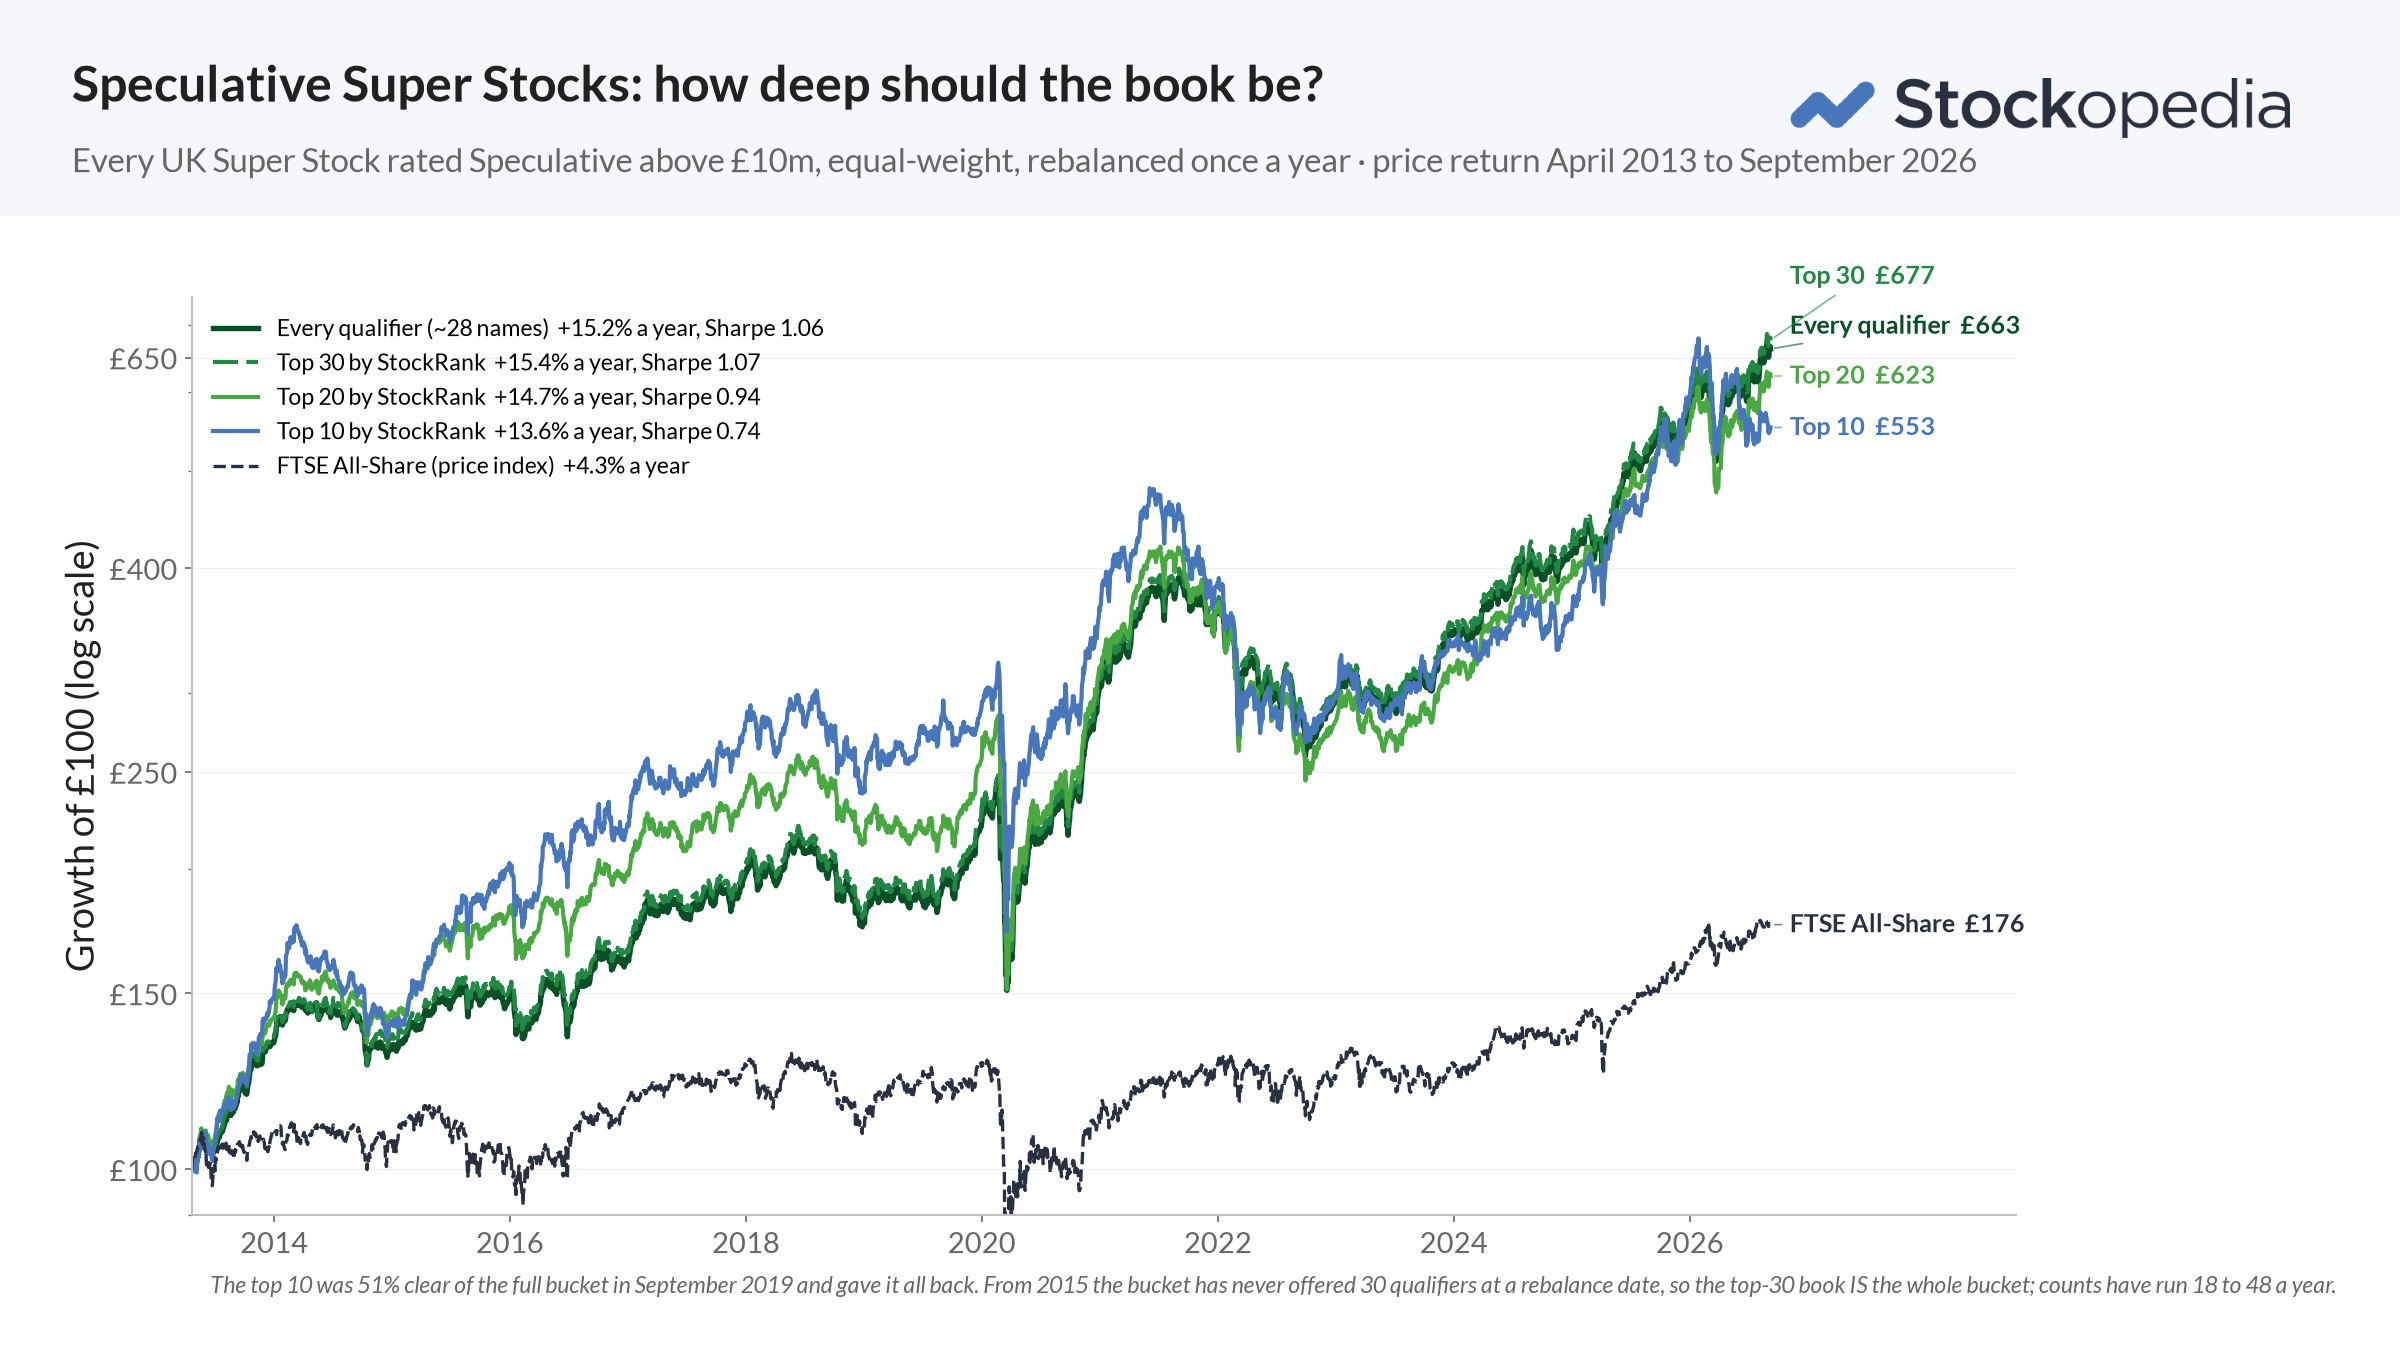
The record is a bit messy, but instructive. Till the pandemic the more concentrated portfolios (10 stock, 20 stock) outperformed. By September 2019 the top 10 was 51% clear of the full bucket. Then they gave all that outperformance back. The broader 30 stock portfolios eventually outperformed - and they did it with less volatility. The 10 stock portfolio had a 47% maximum drawdown versus 36% for 30 stocks.
I’ve outlined this point before in the StockRanks Ebook, but whether a share ranks 99 or 90 doesn’t really make much difference - there’s no need to overweight a ranks precision. If a share is a Speculative Super Stock - it’s a good bucket - owning the bucket often pays better than picking from it!
Which are the highest ranked, Speculative Super Stocks today?
If you screen the UK market for Super Stocks rated Speculative you find 33 shares with a median Market Cap of £143m. Speculative doesn’t mean small - Ithaca Energy is £4.9bn and JD Sports is £3.5bn - both are rated Speculative because their shares have been volatile. There are 23 dividend payers, and currently there’s an average yield of about 2.7%.
Here are the 20 highest-ranked of the set:
| # | SHARE | SIZE | STOCKRANK | Q / V / M | YIELD | 1YR |
|---|---|---|---|---|---|---|
| 1 | Steppe Cement (STCM) | Small | 100 | 98 / 96 / 92 | 6.6% | +86% |
| 2 | Watches of Switzerland (WOSG) | Mid | 99 | 94 / 68 / 97 | 0% | +87% |
| 3 | Shoe Zone (SHOE) | Micro | 98 | 77 / 92 / 83 | 0% | +1% |
| 4 | Yü Group (YU.) | Small | 98 | 89 / 79 / 80 | 3.8% | +12% |
| 5 | Ultimate Products (ULTP) | Micro | 97 | 93 / 98 / 57 | 6.4% | −23% |
| 6 | Diales (DIAL) | Micro | 96 | 78 / 79 / 87 | 4.3% | +89% |
| 7 | EnQuest (ENQ) | Mid | 96 | 58 / 89 / 98 | 3.0% | +129% |
| 8 | The Works (WRKS) | Small | 96 | 59 / 90 / 95 | 0% | +86% |
| 9 | Kistos (KIST) | Small | 96 | 72 / 79 / 91 | 0% | +86% |
| 10 | Churchill China (CHH) | Micro | 96 | 87 / 96 / 58 | 5.8% | −13% |
| 11 | Harbour Energy (HBR) | Large | 95 | 70 / 95 / 73 | 4.3% | +30% |
| 12 | Goldplat (GDP) | Micro | 95 | 82 / 77 / 80 | 1.8% | +147% |
| 13 | Severfield (SFR) | Small | 95 | 53 / 88 / 96 | 0% | +19% |
| 14 | Currys (CURY) | Mid | 94 | 76 / 98 / 61 | 0% | +6% |
| 15 | Dr. Martens (DOCS) | Mid | 94 | 97 / 74 / 64 | 3.8% | −28% |
| 16 | Robert Walters (RWA) | Small | 93 | 75 / 67 / 92 | 0% | −9% |
| 17 | JD Sports Fashion (JD.) | Large | 93 | 94 / 86 / 52 | 0.4% | −20% |
| 18 | RWS Holdings (RWS) | Mid | 92 | 71 / 66 / 95 | 4.9% | +44% |
| 19 | Gattaca (GATC) | Micro | 92 | 83 / 58 / 89 | 2.2% | +60% |
| 20 | ECO Animal Health (EAH) | Small | 91 | 95 / 65 / 66 | 0% | +12% |
What the 33 have in common
Here are a few themes I’ve spotted across the broader set:
The North Sea trade. There are five oil and gas names on the list, and they are giving good dividends - Ithaca on 7.7%, Harbour Energy on 4.3%, EnQuest on 3.0%, plus Kistos and Capricorn (currently bid for). Many of these are naming the oil price as real tailwind this year. Roland noted that EnQuest’s Malaysian acquisition in June (an independent buying mature production from a major), has been a model that’s been very cash-generative for smaller operators - its shares are up 129% over twelve months.
The UK consumer may well recover? There are nine consumer exposed names in the screen: JD Sports, Currys, Watches of Switzerland, Dr. Martens, Shoe Zone, The Works, Ultimate Products, Churchill China and Warpaint London. Many of these stocks have been saying that UK consumer confidence and spending has been a headwind this year. But this is investing - and it makes the deal on offer here. The reason these profitable,decent-quality retailers are cheap is because everyone can see the environment isn’t great. JD Sports shows the risk - it profit warned in August and fell 14% on the day.
People businesses looking for a turn? Robert Walters, Gattaca, Knights, Christie and Next 15. Cyclical consultants, recruiters and advisers after a tough few years - some are showing positives. Gattaca is in the NAPS and raised guidance by a third in May and a small beat in August.
Engineers and specialists with a tailwind. Macro tailwinds always help - Severfield has been mentioning data-centre build-out, MTI Wireless Edge has benefited from defence spending, RWS at enterprise adoption of AI.
And there’s always an idiosyncratic tail where unique companies are up to something interesting, and the fundamentals are turning. If you own any of these shares of have insights for others - please do say so below.
Anyway always remember the averages…
The last time I checked, over 2 year holding periods, 63% of 90+ ranked shares had been winners against one in four of the lowest ranked - and that means 37% of 90+ names fall in any typical year. That makes a strong argument for thinking about your portfolio as a group rather than as a set of individual picks.
Speculative Super Stocks have been the best square on the “Style” board over the last thirteen years. But just picking from the list has often been a crapshoot. I know picking the shares is where the fun lies - but always remember your odds.
Anyway - I’ll dig more into this in next months webinar - we’ll share the date and details soon. Please do comment below!
Disclaimer
This is not financial advice. Our content is intended to be used and must be used for information and education purposes only. Please read our disclaimer and terms and conditions to understand our obligations.
29 comments
Very interesting- thanks Ed. Are there any plans to add the Ranks as an indicator or overlay to charts? It would be really useful to be able to see historic movements of individual Ranks over time for a stock (like you do with StockRanks on the main StockReport)? Better still … access to historic data so that we can use it backtesting?
Thank you Doctor Dave and Gwigglesdarton. I had included disposals of some Steppe Cement (LON:STCM) shares as part of a share cull and transfer to short term gilts in view of the Middle East conflict and oil shortages potential effect on share prices soon. On an overall portfolio basis I feel the need to err on the side of being prudent at the present time.
Hi Ed,
Clearly you have much better access to the data you produce than I do but I've been attempting to analyse this type of data too. I can analyse returns by Ranking Style, StockRankStyle and RiskRating but what I can't do is analyse the interscections between these categories as you have in the article, e.g. Adventurous HighFlyers.
Any plans to give us a way to examine that ourselves?
Keep up the good work
Phil
P.S. All of my screens and strategies have their genesis in the mechanical Stockopedia portfolios built around Rank. I've said several times in my videos that they are a Gold Mine for subscribers but you need to give us the tools to mine the data as I'm interested not just in the UK but the other regions too.
Phil - hopefully we are doing another webinar soon. Send me lots of studies you want done and I'll get you answers.
In essence - we have a blazing fast prototype that can run backtests in seconds. Really fun to explore the strategy search space.
Keen to get it in more hands but it's not production ready - and a few things in front of it. Am running hundreds/thousands of backtests daily now - game changing.
Hi Ed
I'm sure there's plenty to talk about, it's been a heck of a year.
Here's a few ideas of the top of my head that I'd like to know:
1) Which market generates the most multi-baggers per ratio of stocks for the market and are there any common themes that can be captured (across the board or for particular markets)?
2) I'd love to see the same breakdown you did with stock rank / styles on other markets
3) And I'd also like to see it with VM Rank (I'm coming to recognise that the Stocko data is compelling wrt to VM Rank and it would add a good foil to a QM strategy)
My own analysis of the data available from the 7 regions appears to suggest at present:
- Momentum is THE engine
- Value earns its place in blends across several regions (VM/QVM)
- Quality alone is a brake rather than an engine (the weakest rank according the data I've crunched) but it does seem to limit drawdowns across all regions
- Growth adds nothing - Adding Growth to StockRank, i.e. QVGM lowered returns across the 7 regions
High M stocks, e.g. High VM selections tend to have strong 6m Relative Strength scores but some of the High SuperStock (QVM) selections might lean more towards QV factors. So does filtering SuperStocks for stocks that have strong or simply positive 6m Relative Strength improve returns?
I'm sure there's loads more. Typically I have selected stocks that are trending (the view being that if they are trending the institutional investors are on board) but I'm increasingly open to the idea (especially after the performance of my NAPS inspired passive Light Touch VM approach) that a stock that has pulled back prior to purchase can kick on again.
The quarterly rebalanced LightTouch VM UK portfolio is currently up ~18%
Phil,
- Momentum is THE engine
- Value earns its place in blends across several regions (VM/QVM)
- Quality alone is a brake rather than an engine….. but it does seem to limit drawdowns across all regions
My Rank importance observations chime with your conclusions whereby Momentum is the key, but it is weak on its own. High M needs to be teamed up with high Q or high V.
Pair M with Q and it's consistent with improving fundamentals being real. Pair M with V and you get a cheap candidate with a floor price.
But the 13 years of UK back tested Risk rating complicates this picture: The High Flyer's QM edge is indeed stability rather than magnitude — it holds a 7.9–10.4% band across every risk level, while Turnaround's VM (and Superstocks QVM) advantage evaporates at the extreme Highly Speculative end (VM +15.3% Speculative → +1.2% Highly Spec).
My conclusion: Avoid Highly Speculative stocks, unless they are high QM!
I think that might have answered my question about backtesting? Can you tell us more about your plans?
Well you did ask Ed, Would love answers to the following regarding rank jumps as currently running multiple portfolios using jumps in Q. V, M, S, QV, QM, VM….
My priority list
- StockRank
- Quality Rank
- Value Rank
- Momentum Rank
- QualityValue
- QualityMomentum
- ValueMomentum.
What to do when all 20 slots are occupiedCompare:
- Ignore every new signal until a slot becomes free.
- Replace the holding with the lowest current rank.
- Replace the worst-performing holding.
- Replace the holding with the weakest Momentum Rank..
Jumps caused by falling pricesELIX is a perfect example: its QualityValue Rank rose after a 12% price fall following disappointing results.
Divide Value and QualityValue jumps by the share’s accompanying previous weekly return. This would show whether a Value-related jump created by a collapsing share price is a genuine opportunity or a value trap
- Below -10%
- -10% to 0%
- 0% to +10%
- Above +10%
Multiple simultaneous rank jumpsTest whether a share appearing on several screens at once performs better. This would help decide whether shares such as SLP, which qualified for several portfolios, deserve a larger position—or whether duplication merely increases concentration risk.
Keen to get it in more hands but it's not production ready - and a few things in front of it. Am running hundreds/thousands of backtests daily now - game changing.
It sounds fantastic. To make this work on a practical level you will need to significantly increase the portfolio limit as people will want to test their findings.
I'm wondering how to square looking for high Trending Clarity with volatile stocks. Perhaps both approaches can work?
Doing this from my phone - so excuse brevity - basically speculative / highly speculative trend clarity doesn't do as well as adventurous ... and oddly enough lower risk ratings do worse!
Highly speculative does drag returns down. Speculative does 10.8% cagr - so ok... but not near adventurous at 17%
For smooth trends you want some vol, but not too much it seems.
Below ignores StockRanks.
Re previous post - I should have linked Steppe CementSteppe Cement (LON:STCM) to the StockReport!
A very interesting article. In respect of Steppe Cement their interim results were posted on September 9th and there has been a dramatic increase in the share price since then. The trades taking place are all R type and there is a massive difference between the buy and sell prices. Does anyone have any insight into this?
My insight is only that I was royally p***ed off that the share price didn't budge at all after the results, at which point I reluctantly sold having been watching the bowl for a while, and then two weeks later for no apparent reason the price takes off by nearly 80% over a few days!!! Investing is enough to drive you mad sometimes!! And I too would be happy to hear any insights to assuage my grief!!
I'm not sure this will do a lot to assuage your grief, and although not caught by this one I can certainly empathise with selling a share just before it takes off (e.g. out of the blue takeover offer the day after I sold).
I think this is almost a case study of post result drift combined with a sparsely covered stock and a lot of people not seeing the results initially. The results were very good and a big turnaround from a company that has been under pressure the last year or two, but they were published at 9am so a lot of people missed them initially and, probably partly down to that, they were then not reported on much. They did move a little in the first few days, but then gathered pace. Whether this was down to people catching on to the news or just jumping on the bandwagon of a moving share I don't know.
I'm sure, like me, a lot of people rely on looking at the news before the market opens, so it is a real pain when companies issue market sensitive news when the market is already open.
When you look at the Speculative style on the Risk Ratings screen it is shown as the risk rating with the worst performance at -27.07%, Highly Speculative is slightly better at -26.02%.
The Super Stocks influence is significant turning this into a winning outcome.
This is fantastic analysis and insight, thanks Ed. My slight doubt / question is how the results hold up if you were to push that start date forward to start of 2014. It just feels to me that the date that has been chosen results in a very steep £50 gain right at the start of the sample period, which I expect compounded quite nicely thereafter.
Great post thank you but I wonder whether you could help me with the style definitions and how they tie up to the stock ranks. For example, the superstock rating is defined as the strongest exposure to Q, V & M so logically I would expect a stock rank of say 90 +. What I am trying to understand is why for example, Knights Group is a superstock but doesn’t match my logic with the following ranks
Q -59
V - 76
M - 63
SR - 76
There must be another factor to bring it upto superstock status and wonder what I am missing?
We actually model a 3D space with quality, value, and momentum along each of the X, Y, and Z axes.
The styles are essentially a strange shape in that space, defined by proximity to each of the eight vertices of the cube. There is a space in between them all, which has about a third of stocks in it, which we call style neutral.
It's not unusual to find higher-ranked stocks in style neutral than some of the stocks in Superstock. It's really defined by how the shapes work.
Oddly enough, when we were designing this, we actually started the old-fashioned way by creating some 3D models in the real world! There were some quite entertaining scenes in the office.
I own 7 of these..
I recently visited several different TheWorks (LON:WRKS) stores and were all quite busy, great prices and well laid out.
Good morning Ed, we hold 4 shares in your list but, full disclosure, they were bought pre Stockopedia and should have been sold when they started to fall years ago. A mix of loyalty and stuborness kept us holding. They are Steppe Cement, Diales, Severfield and RWS. I've learned on here to run winners so we'll continue to hold and watch them closely for further news. Getech is another of ours which has attracted individual investor attention, as The Boon Fund pointed out yesterday. Our biggest loser is Watkin Jones which we hold and continue to add too hoping one day a bigger company might think it's worth bidding for. I currently have high confidence in Mincon, Capital, Eurocell and Springfield Properties which we hold, I'm forever looking for Ed's bowls.
This is a friendly post JASVFS, as I admire your passion about the markets.
I noticed from your daily posts that you hold a significant number of shares.
Having worked in the industry for 3 decades and managed thousands of portfolios, my biggest takeaway has been that money management is far more critical to long term stock market success than individual stock picking.
Agree on Getech (LON:GTC). Any small caps that start generating cash (especially when nobody talks about them!) should never be discounted. Clean balance sheet here with an obvious operational leverage.
All the best
Is the risk premium of 4.7% between conservative super stocks and speculative super stocks enough though to compensate for the sleepless nights and probable volatility (not arguing over the returns over the timeframe). Fascinating table - many thanks
Well it's a good question - if I have time today I'll circle back with some Sharpes.
I’m loving the style band on the first image- is there a way of implementing that in the stock report charts?
ditto
And me