Stock in Focus - is Dart Group running out of Drivers ?

Dart Group has long been a favourite of Stockopedia subscribers and it’s a stock I currently hold a small position in. A few days ago the company updated the market with some rather positive full year figures. Paul Scott gave his opinion on the headline numbers in his typically timely fashion and I thought, now that the numbers have been digested by the Stockopedia engine perhaps I should give mine.
Taking a NAP…
This year I named Dart (rather reluctantly) as one of my top 10 New Year NAPS. It had had such a good multi-year run already that my biases screamed for me to avoid it. But I took a deep breath and yielded to the will of my selection criteria. It has now stormed to an additional 50% return in less than 7 months.
The move began with a positive trading announcement in March. Dart spiked up a huge 18% on the day to 360p, prompting much dialogue and head scratching between subscribers on the boards about what to do next.
The disagreement prompted me to write a piece in favour of continuing to hold. After all, there is a tendency for stocks to continue to rise after an unexpected earnings announcement. This phenomenon is known as PEAD - the post-earnings-announcement-drift. It is well documented in the academic journals and as a student of the momentum effect, I wanted to remain exposed to this key return driver. If in doubt it’s best to do nothing.
But the stock has not just drifted, it’s surged by another 23% in barely another 4 months, with the latest move maturing on the company’s full year numbers released last week.
Notably though, the moves have become less powerful on each announcement. 18.5% on the March announcement versus 4.5% on the July announcement. Is Dart Group running out of steam ? Or is it running out of something else ?
A quiver full of arrows

Dart Group's numbers have now been properly digested by the Stockopedia engine after last week’s update. Our blended measure of the stock’s Quality, Value and Momentum - the StockRank - has fallen by 13 points almost overnight (down to 83 from 97). Having seen Dart at the top of the ranking charts for such a long time it's gratifying to see the algorithm becoming more discerning in Dart’s case. But let’s take a closer look at why…
Quality - reading between the lines
The new numbers have provoked an especially large drop in Dart’s Quality Rank from 96 to 53. While headline earnings per share rocketed 29%, underlying the figures seems to be a a concerning pullback in profitability and a larger drop in the F-Score - the 9 point checklist of fundamental health and momentum. While a score of 5/9 is no cause for concern, it does flag that Dart is no longer benefiting from the accelerating fundamental improvement it has seen in recent years.
Where has the rest of the dip come from? If we read between the lines we can see that the Quality Rank is dependent on Operating Margin stability. The headline operating profit fell dramatically this year for Dart due to a £17m provision against a Supreme Court ruling on 31st October which went against the company. Stripping out this exceptional provision, operating profit actually increased to around £50m. Much better than is figured into our numbers.
Another factor going against the Quality Rank is the fact the company has only announced preliminary results, and has yet to report its detailed Gross Profits for the year. As a result we can’t calculate Gross Profitability - which Robert Novy Marx found to be the most powerful of all the measures of quality in predicting future stock returns. Dart normally scores extremely well on Gross Profitability so we may expect the Quality Rank to bounce back a little when the fully audited numbers are released in time.
Now I’m not one to second guess the StockRanks as I defer to the Quant. But for stock pickers who like to research fundamentals in detail the above points of note are certainly worth considering when skeptically questioning the Quality Rank.
Value - it’s not such a steal now
What can be less argued with is the fact the stock no longer looks cheap. The ValueRank has fallen to 57, down at least 10 points on this latest update.
Looking at standard valuation multiples the stock is nudging up towards parity with the market. The forecast P/E is 14x, while the Price to Free Cashflow is 16x. Both numbers aren’t far away from the market average. On an Earnings Yield or Price to Sales basis the stock still looks a steal, but from a Dividend Yield or Price to Book basis it doesn’t. Taken as a whole one can understand why the ValueRank is… well… average.
Why is this important ? Well Ben Graham taught us that over time the stock market is a weighing machine. It finds undervalued or overvalued shares and brings their valuations back to normal. This process is driven by a fundamental force of the universe known as ‘mean reversion’ - the tendency for things to return to average. Just as cold winters are often followed by warmer winters, extreme valuations are often followed by average valuations.
As an investor, this is a crucial concept to understand. This force of valuation mean reversion is a massive tail wind in a shareholding’s sails. Some of the best value investors, like David Dreman, will buy shares when they are undervalued and clinically sell them when they return to average valuations.
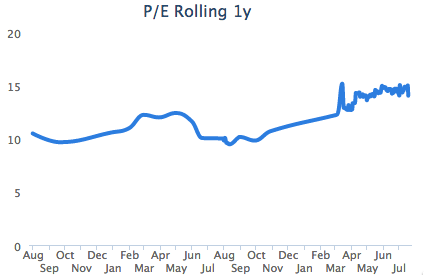
The following two charts do tell a story around Dart Group’s Valuation. The P/E ratio has risen from under 10x to almost 15x (the market median)…
While the blended Value Rank has fallen from above 90 to its current 57 today….
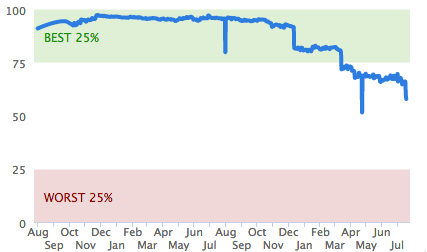
Yes Dart Group may continue to rise, perhaps even to a premium valuation, but that rise won’t be powered by the Value effect any longer. Make no mistake, if you are buying Dart Group today, the investors selling to you will be investors like David Dreman. Value Investors who have had their fill of the Value opportunity here already and are rotating out of Dart into cheaper opportunities elsewhere.
Momentum - it’s still on target
This stock is now all about Momentum - its Momentum Rank is 100. The brokers keep having to hike their numbers and the stock keeps going up.
Most investors are skeptical of momentum, they just can’t take it seriously. Not for them the idea that you should buy a stock just because it’s hitting new highs or beating broker numbers. They’d much rather use proper investment metrics like valuation ratios and profitability numbers to make their decisions. But they’d be missing a trick.
Would you stand in front of a vehicle blindfolded just because you knew a car had no engine ? I would hope you’d ask whether the car was moving before you did ! Momentum is a force of nature. The tendency for bodies in motion to continue moving. In the stock market it’s an even stronger force than the Value effect.
There’s strong momentum across the board for Dart Group. Not only is the share price moving, but the earnings per share forecasts keep getting hiked. This has the impact of lowering the bottom half of the P/E ratio and keeping the valuation multiples low. The rise in the P/E ratio over the last 2 years can only explain half of Dart Group’s share price doubling, the rest has been driven by a 50% increase in earnings per share.
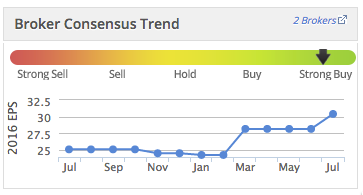
But the brokers are forecasting far more moderate increases for the future and one has to question whether the momentum can be sustained. Academics agree that the Momentum effect on share prices is most powerful for 6 months to 1 year and tends to revert after three to five years. Dart Group has been a stunning share for the last 5 years… can it really get any better ?
Dart - high flyer or glamour trap ?
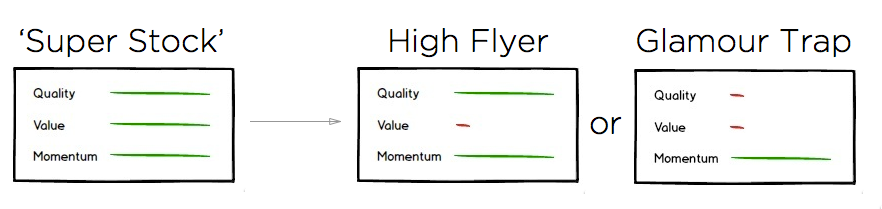
One of my more popular posts at Stockopedia has been on what I termed the Taxonomy of Stock Market Winners. In it I described how, as time goes by, stocks move across a spectrum of classifications depending on their exposures to the three big QVM drivers. For context for the following paragraphs I do recommend a refresher.
We’ve certainly had the benefit of hindsight with Dart Group, and there is no doubting that it was a “Super Stock” for a long time. Its high rankings across quality, value and momentum for the last few years gave it a 99+ StockRank for much of that time and the returns have been stellar. It’s been a classic case study.
But as the stock is no longer cheap, its classification has shifted. We’ve seen that we can query the level of the Quality Rank, but the Value Rank being average is incontrovertible. While the ‘taxonomy’ is based on archetypes, it gives us some useful rules of thumb. Personally I like to see my stocks exposed to at least 2 of the 3 Quality, Value and Momentum drivers. Dart is still exposed to Momentum so depending on whether we trust the Quality Rank or not it’s now moving towards High Flyer (sic) or a Glamour Trap status.
Sticking to your investment philosophy
It’s too early to be unduly concerned with Dart Group as it doesn’t seem overpriced, and it seems to be still knocking it out of the park on the earnings front. But investors should be asking themselves whether the stock is still aligned with their investment philosophy. We shouldn’t kid ourselves that we are value investors in holding Dart Group any longer. It’s now becoming a consensus trade, mostly driven by momentum.
There are many different strategies in investing, and all can make money while seeming to be at odds with each other. I’ve often published Venn Diagrams showing the intersection between the QVM drivers and the kinds of investors who invest in the opportunities at those intersections. It’s very notable that all these investors are disciplined and stick very firmly to their preferred domain. Neil Woodford invests in Quality Value stocks, while James O’Shaughnessy is a Value and Momentum investor. The danger in investing is falling in love with the stocks owned, and not having the discipline to let them go when they no longer fit your original criteria.
Value investors should probably be thinking long and hard about whether Dart Group is for them any more, Momentum investors may be willing to wait a while longer.
Disclaimer: At the point of writing Ed Croft holds a position in Dart Group.
Disclaimer
This is not financial advice. Our content is intended to be used and must be used for information and education purposes only. Please read our disclaimer and terms and conditions to understand our obligations.

12 comments
Yes there's only Indivior right now. You can easily screen for Triple 90's like so - http://www.stockopedia.com/screens/triple-90s-64318/
Edward, Thanks but I meant as a screen as in Guru screens, so we can see the performance, say add when share has 3x 90 and then drop when SR drops below 90? It would also be useful if we want to look back as now its hard to see what had 3x90 going back, eg was Air Partner (LON:AIR) ever a triple 90?
Herbie - there are so few stocks that qualify for those rules that I don't think it's practical to track. There's only 1 in Europe, only 1 in UK and only 5 in the US+Europe edition.
We are working on a backtester so it won't be too long (at least it won't be a decade ;-) ) before you can test these things yourself in the application.
Edward, OK fair enough, I will wait for the backtester. Thanks.
Hi Ed,
Thank you for the write up. I have noticed a number of large winners that started out from a ~90, 90, 90 QVM pattern. Dart and Character both had this pattern in Nov 2014 before launching on impressive SP runs. Now obviously I can't see all the shares that were triple 90s that did not embark on such an impressive run, but I would be interested to know how many shares have had a triple 90 pattern and what their average 6/12 month return is (and dispersion of results).
As an experiment I purchased a lump of Agfa Gevaert NV last week, this is the only 3x 90+ currently cropping up in my investable universe right now.
Its a good question about triple 90s, I can only find one at the moment thats Indivior (LON:INDV). Air Partner (LON:AIR) maybe has been recently?
Edward would it be possible to have a screen for this?
There's a very thought-provoking article just out from Richard Beddard, really well worth the read in the light of this essentially figures-based discussion thread:
http://www.iii.co.uk/news-opinion/richard-beddard/dart%3A-bums-seats
Ed, great post and this made me think a lot about potential value traps.
I have owned shares in DART for a couple of years now and although I have never been a fan of running any type of stop losses (being of the belief that a lower price provides better value etc), I am considering that maybe this is now a case where it is worth having a moving profit taking band at some level (say 10% below the market high). Presumably if the price were to fall say 10%, then your momentum score would also fall bringing the share further down your stockranks. The trouble with this is, that as someone who believes in fundamental valuation, a) I don't feel this share is particularly overvalued compared to the market at the moment and b) the news / director speak coming out from DART seems to be positive rather than neutral / negative.
Without negative news coming out, and unless you take the view that any negative share price movement will be leading negative newsflow, it is hard for me to justify to myself the reason for selling the share either at the moment or of course at lower levels.
Slightly more "stimulating" to my thought process (due to the fact that I have a much larger long position) is that your metrics indicate that Provident Financial PFG is a strong value trap. Momentum 86, Value 23, Quality 25. Ouch!
I have held this share for many years and it is by far one of my best performing and most consistent shares. For much of the time, it was one of the most shorted stocks in the market - I could never see why. Newsflow has pretty much been positive the whole time, earnings growth has been consistently good and it throws out decent dividends and dividend growth. It seems to be an almost perfect share (famous last words), but it falls neatly into your value trap category. I would appreciate any thoughts you have on this - or should the stockrank figures be taken with a pinch of salt in this case due to PFG being a financial / bank.
Thanks
Chris
Another excellent post for sure. Digging into the reasons why the ranking numbers have changed is extremely useful as are the comments on what sort of lag we might expect between audited/unaudited results appearing and the ranks actually reflecting these changes. It might be useful to have some sort of indicator which shows how up-to-date the ranking numbers are? Then it would be clear whether recently published numbers are being fully reflected in the metrics?
Damian
Yes I agree Damian. We should be flagging when numbers are just based on prelims or based on fully audited finals. There's always more detail in the finals than in the prelims.
Regarding the lag it really depends on the company. Sometimes it's weeks, sometimes it's months. Definitely worth checking the RNS history to get a handle on it. We'll be setting up RNS alerts pretty soon so this should be easier to track.
I'm making a development card on this - we're going to be completely rebuilding our financial statements browser later in the year. We've got all this data kicking around - just need to make it more visible on the main StockReports.
Sounds good Ed. On the lag front I was thinking about the time delay between the results being published by a company (whether audited/unaudited) and the new numbers being fully reflected in Stockopedia. Does it take longer for this to happen with the audited finals (given the need to transcribe a larger amount of detail) or do you receive all updates within a reasonably similar time (from your data provider)?
Ed - an excellent explanation as to what has driven the change in the stockranks. Thanks.