Stock in Focus portfolio: the first 10 years + Q1 update

On 19 April 2026, the Stock in Focus portfolio will be 10 years old. This rules-based portfolio was conceived during a casual chat with Ed in 2016. I wondered if I could create a set of screening rules to help me build a portfolio that would beat the market.
The strategy I adopted was influenced by notable guru investors including Jim Slater and Joel Greenblatt. I also added momentum metrics and a minimum holding period, after which stocks are reviewed for potential sale (and many are sold).
Dividends were always a requirement, but I upped my yield requirement last year to reflect the portfolio’s tilt towards an income strategy.
While SIF is a model portfolio, I’ve invested a part of my own portfolio in this strategy since 2017, so I’ve always had skin in the game.
Here’s a brief overview of how the strategy works:
I select new shares from my SIF stock-buying screen in a weekly review, adding new shares when possible, while taking into account diversification by sector and the number of existing holdings;
Shares are held for a minimum of nine months. However, if a stock issues a profit warning or falls by more than 25% below the portfolio’s cost price, it’s sold at the next weekly review;
After nine months, I test shares against my SIF stock-selling screen. If they pass all the rules, they remain in the portfolio subject to a rolling monthly review. If they fail, they’re sold.
SIF: 10-year performance
Barring market armageddon in the next couple of days, here’s how the portfolio has performed during its first decade:
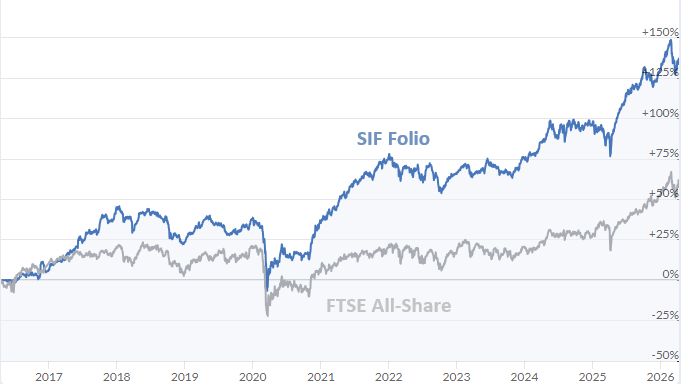
Note: SIF portfolio dividends are included from 2025 onwards. The All-Share index excludes dividends.
In total, the SIF portfolio has delivered a gain of 139% since April 2016, or 9% annualised (including dividends since January 2025).
The FTSE All-Share index has risen by 70% on an equivalent basis over the same period, giving an annualised return of 5.5%.
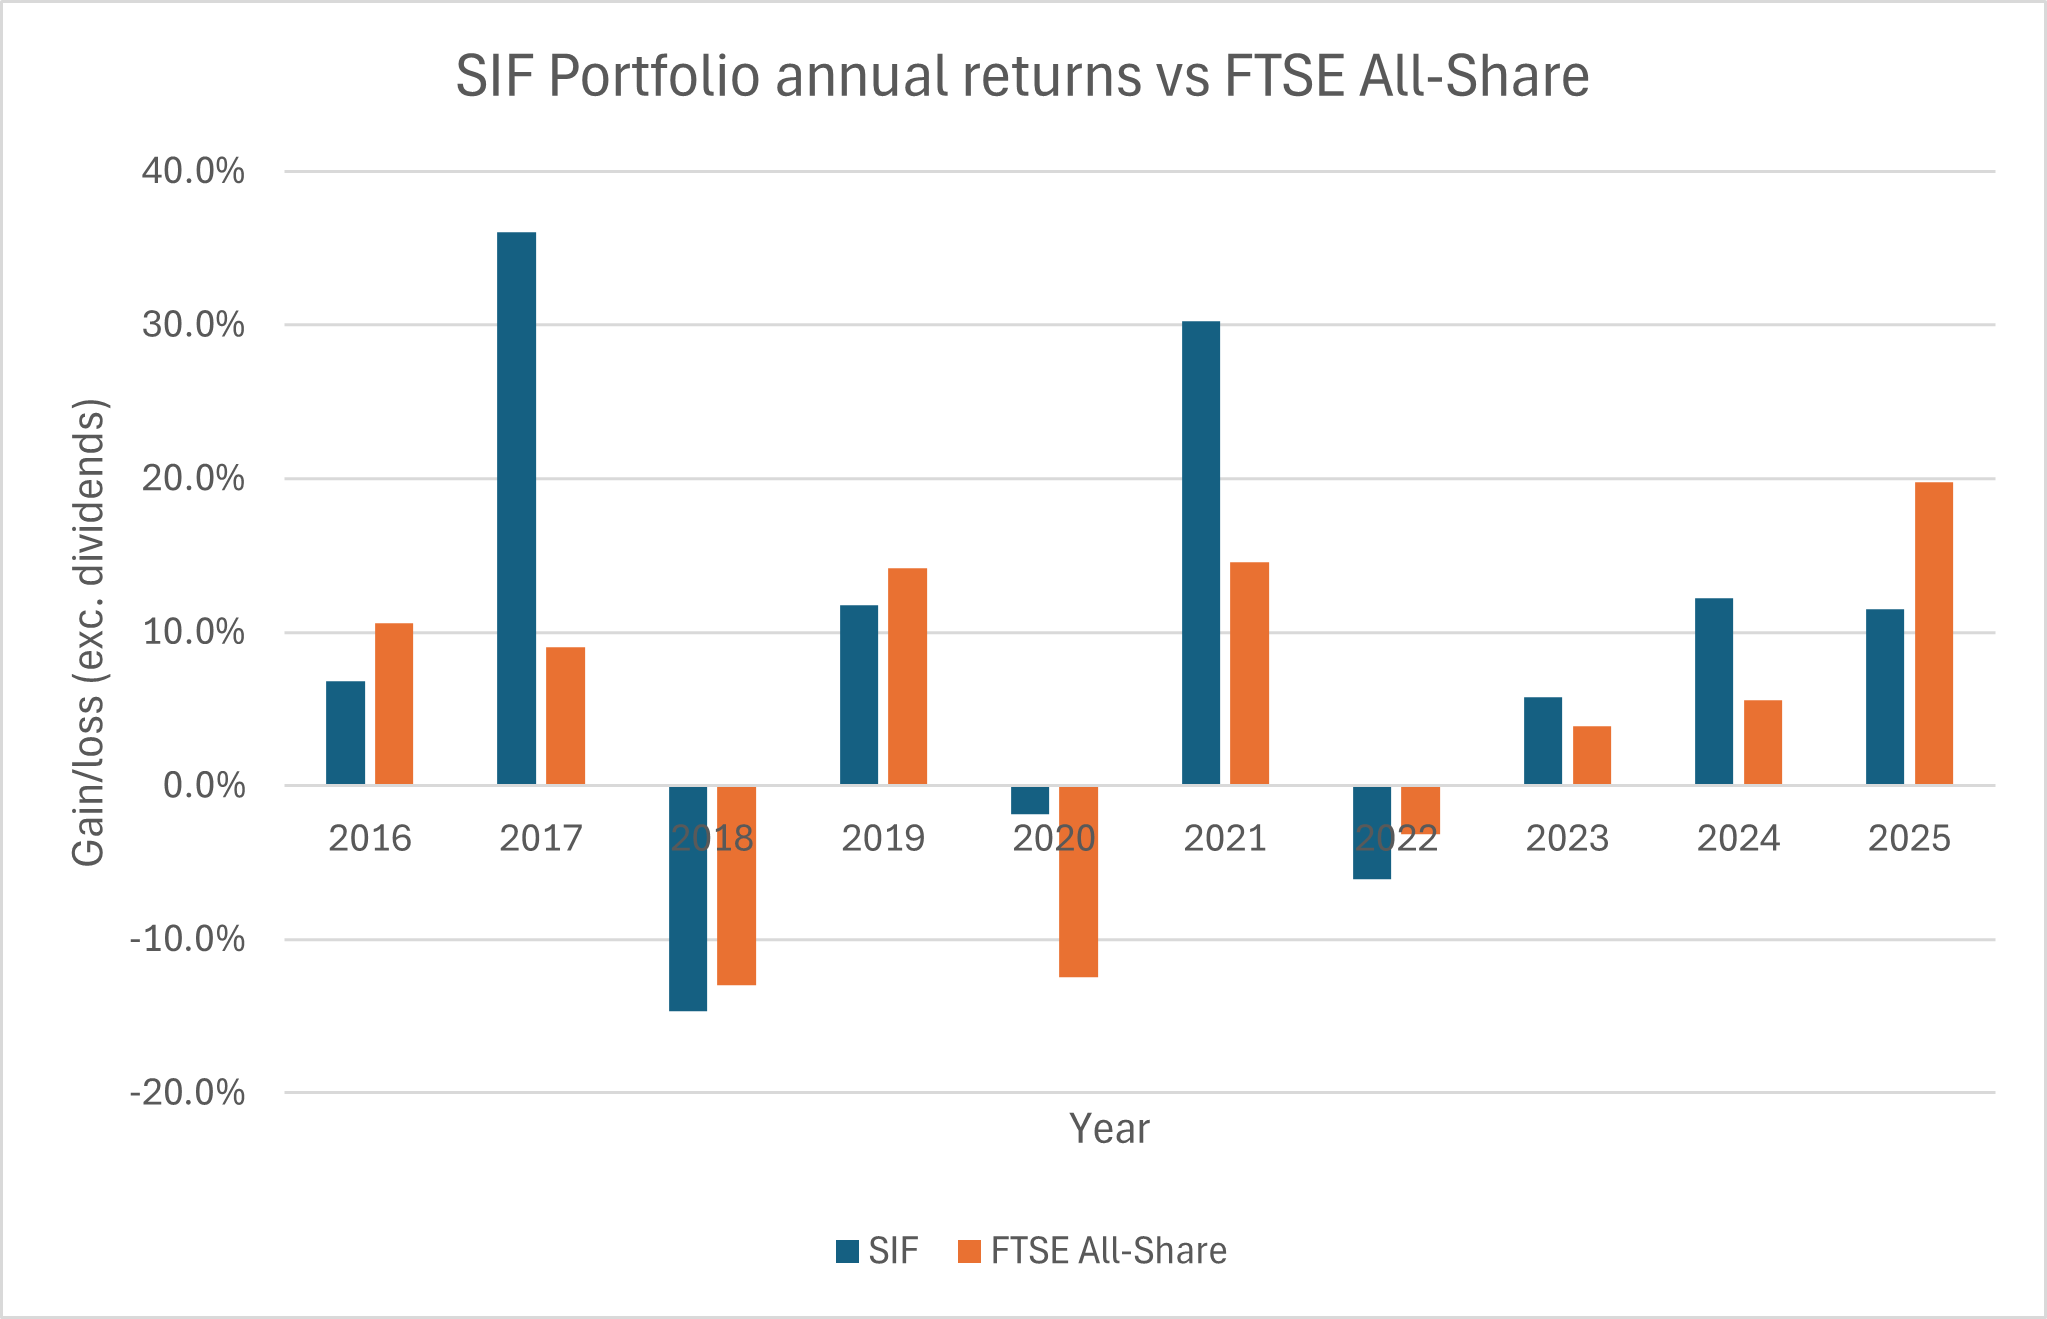
A quick look at the chart above suggests that the portfolio has only outperformed in some years. Annual performance data confirm this. SIF has only outperformed the All-Share index in five of the last 10 years:
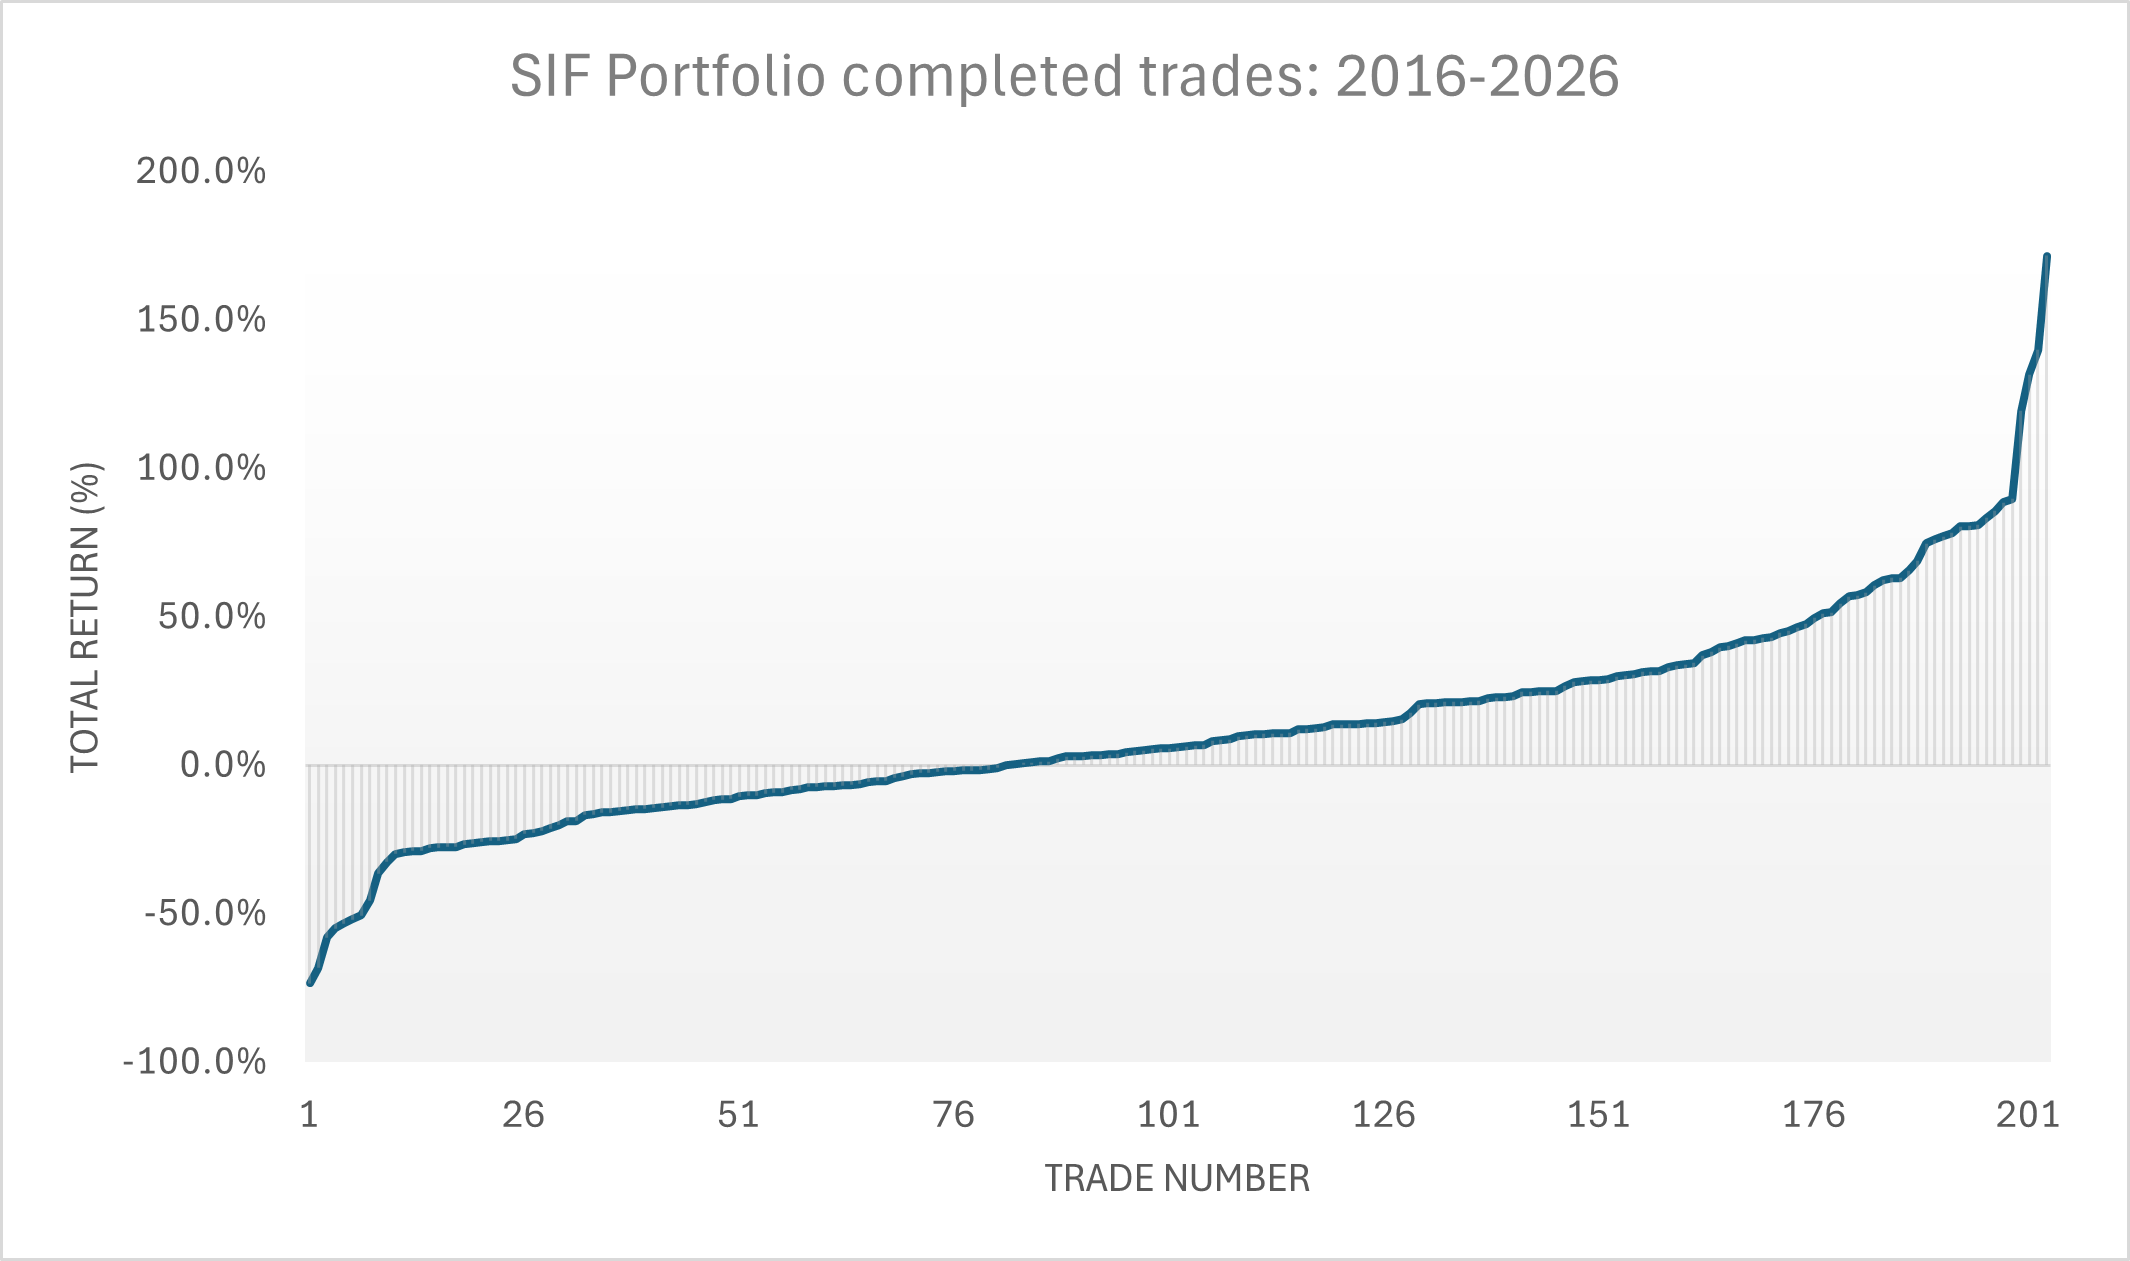
Out of 203 completed trades over the last 10 years, SIF winners have outnumbered losers by 3:2, giving a 60% win ratio; very similar results to the NAPS’ 10-year record.
The average total return (including dividends) was 12.4%, but results from individual trades spanned a very wide range:
Here’s a snapshot of the top 10 winners and losers from the last decade. There will be some very familiar names here for many UK private investors – the SIF strategy was always intended to invest in mainstream stocks, not special situations or obscure niches:
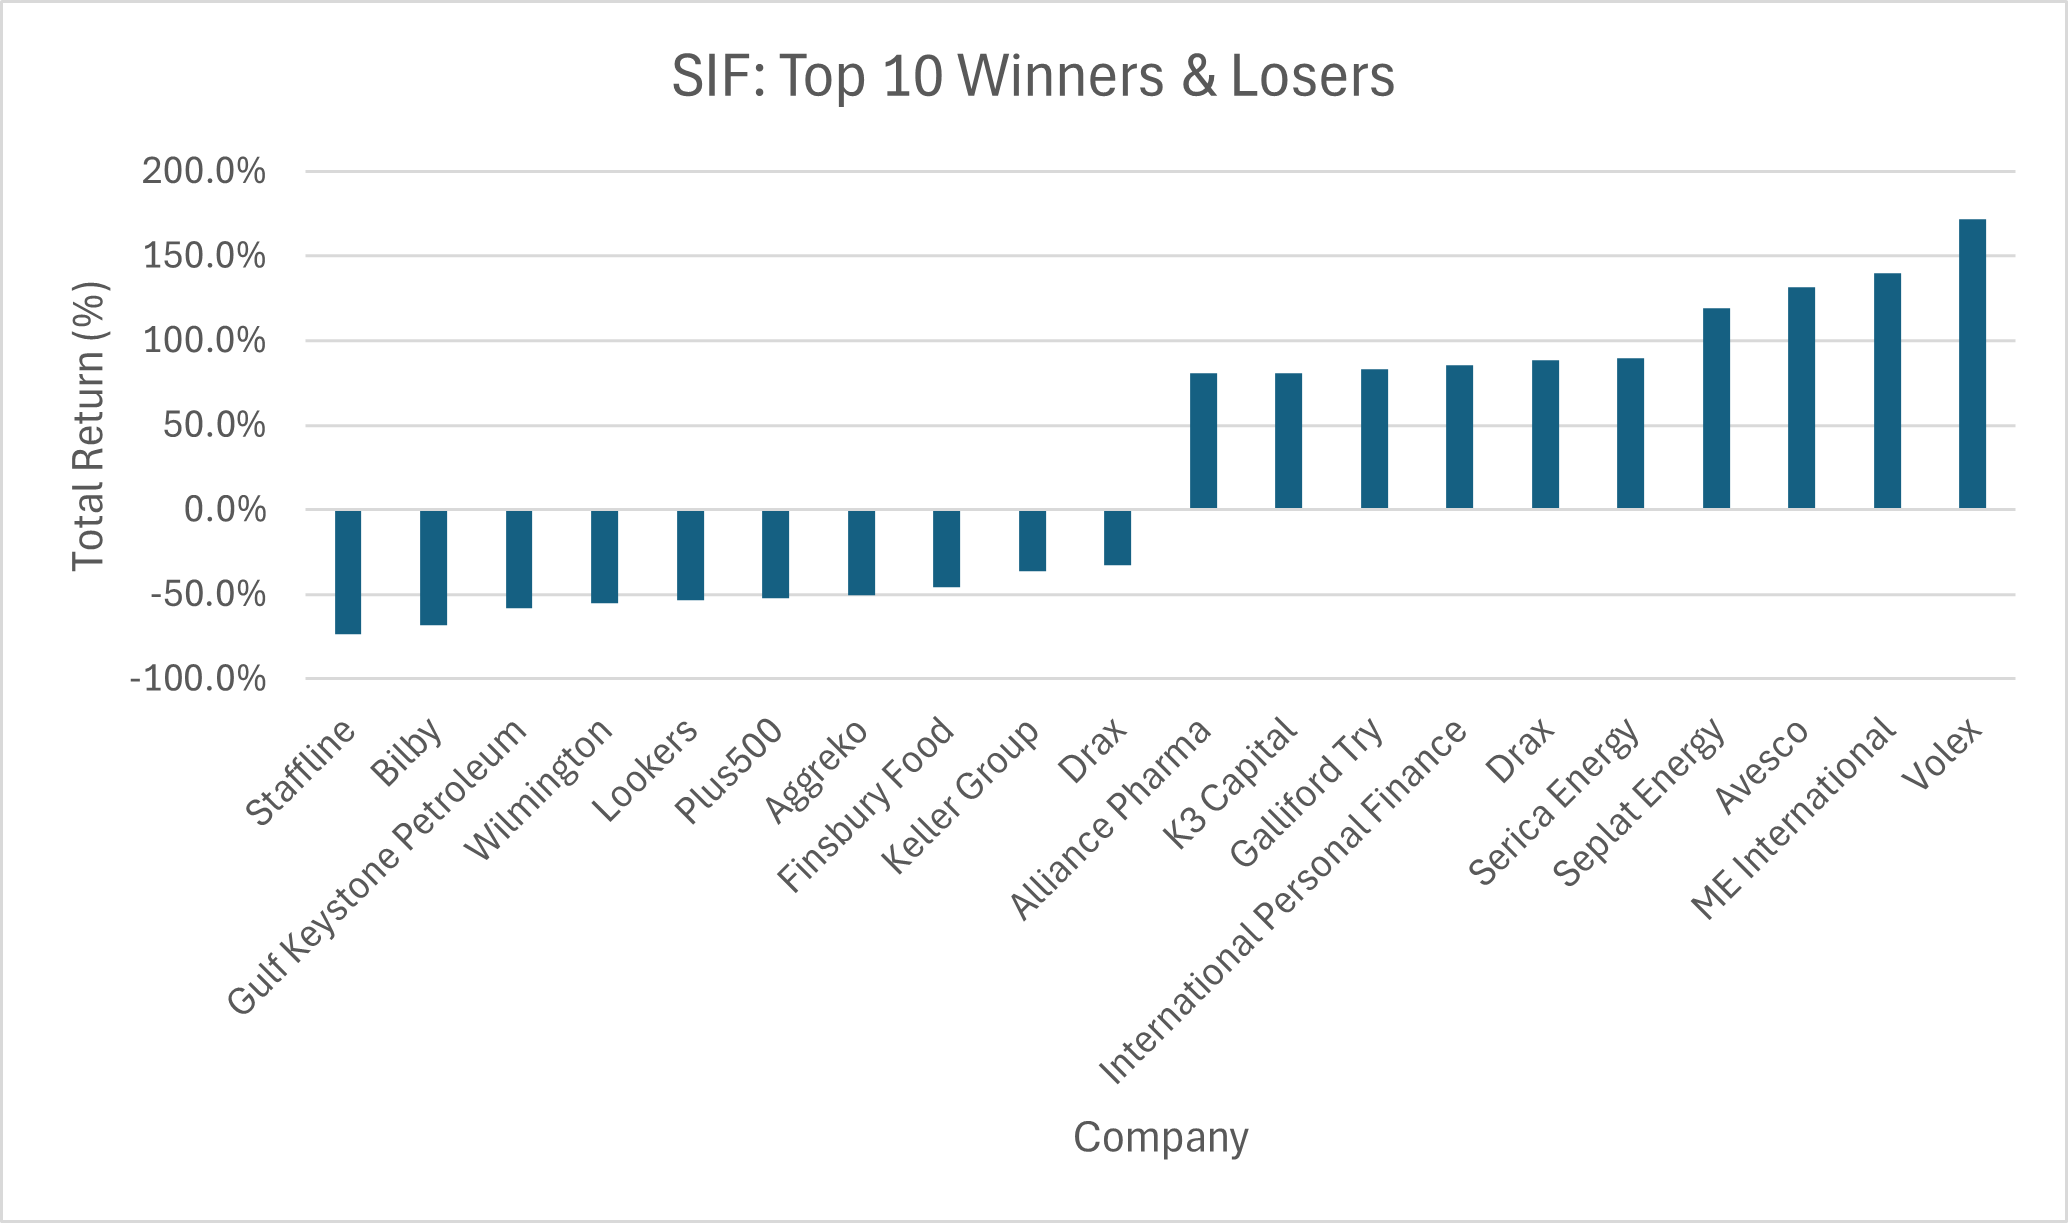
I’ve only had four double baggers in 10 years (plus a possible fifth, gold miner Endeavour Mining (LON:EDV), that’s still an open position).
Even so, these big winners have played an important role in the overall performance of the portfolio. This explains my growing emphasis, over time, on cutting losers.
Conclusions
Have I been good or just lucky? It’s hard to be sure, but the last decade has included some trying times for investors. Achieving a respectable result over such a (relatively) long period has given me some confidence in the rules.
Personally, I’ve also found great comfort and utility in having a system to follow in any and all market conditions. This has allowed me to avoid some of the worst of the cognitive biases I know can affect me.
The future is always uncertain, but I’m hopeful that patient consistency will continue to yield positive results over the next decade. I plan to continue operating this strategy with a portion of my own funds, given its positive and diversifying performance (versus the remainder of my portfolio).
SIF Q1 2026 Performance: breakeven
With all of that said, SIF’s performance during the first three months of 2026 was decidedly mixed. After level-pegging the market until the start of the conflict in the Middle East, it’s since slumped to a breakeven result for the quarter:
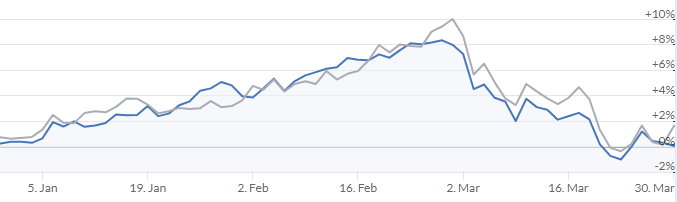
Here’s how this breaks down into a split between dividends and share price gains for SIF and my FTSE All-Share index benchmark:
Q1 2026 | Price Return | Income | Total Return |
SIF Folio | 0.1% | 0.3% | 0.4% |
FTSE All-Share | 1.5% | 0.9% | 2.4% |
Including income, SIF underperformed slightly in Q1. But with nine months of the year remaining (and potentially much more volatility), I think there’s still everything to play for.
SIF Q1 Portfolio Review
Market conditions and my screen results dictated that the hectic pace of sales during the final quarter of last year continued into 2026. The number of stocks in the portfolio had fallen from 16 to just nine by the end of the first quarter:
Buys: 2
Sales: 9
As a result, the portfolio’s cash weighting increased from 30% at the end of 2025 to more than half the portfolio:
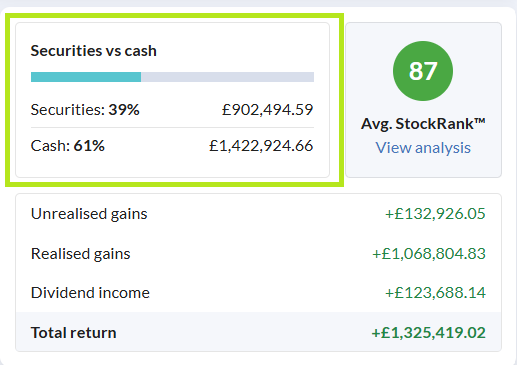
Position sizing: despite the increase in cash, I have left my default position sizing unchanged to reflect the unchanged value of the portfolio at the end of the quarter. As a quick reminder, all positions are equally sized, with no top ups or top-slicing.
Positions are sized to allow for c.20 stocks and sufficient surplus cash to protect me in a market crash – this portfolio has a fixed amount of capital and has never been topped up.
Portfolio snapshot
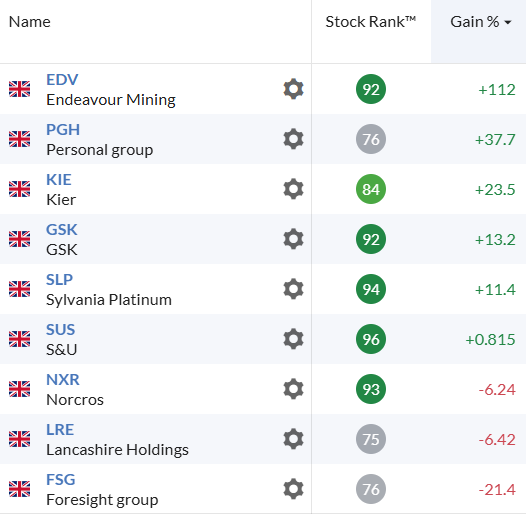
Here’s how the portfolio looked on 31 March 2026, after any month-end sales:
Portfolio metrics
Last year I introduced the table below as a new reporting measure, tracking some key average metrics for the portfolio. I find it useful to visualise the portfolio in this way to ensure that in aggregate, it has the characteristics I’m seeking.
Changes in the metrics below can also provide a useful barometer of market conditions. In this case we can see that the stocks in the portfolio became cheaper in Q1:
Period | P/E rolling 1y | Div yield rolling 1y | PEG rolling | Cash weighting | No. holdings |
Q1 2025 | 9.7 | 5.3% | 1.0 | 13% | 18 |
Q2 2025 | 10.2 | 5.0% | 1.9 | 5% | 21 |
Q3 2025 | 10.3 | 4.8% | 0.8 | 13% | 20 |
Q4 2025 | 9.8 | 5.3% | 0.9 | 30% | 16 |
Q1 2026 | 8.6 | 6.1% | 0.8 | 56% | 9 |
Another conspicuous change during the quarter was a sharp fall in the number of new stocks qualifying for my buying screen. This is reflected in a near-halving of the number of holdings in the portfolio, as stocks aged out and were not replaced.
In the past, this kind of shift to cash has sometimes preceded a wider market slump. But not always. I’m not making any predictions for the remainder of the year, but I do hope to be able to add some new holdings soon in order to maintain an attractive income yield from the portfolio.
In the remainder of the article, I’ll provide a summary of the changes to the portfolio during Q1 2026.
Portfolio changes in Q1 2026
New stocks
Foresight group (LON:FSG)
This founder-led asset manager boasted Super Stock styling and a StockRank of 89 at the time of my purchase in January. The picture has deteriorated slightly since then due to a modest miss on year-end AUM, which Mark discussed in the DSMR.
Despite this, consensus forecasts have been left unchanged (so far) and both quality and valuation metrics remain attractive to my eyes:
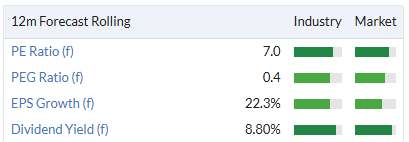
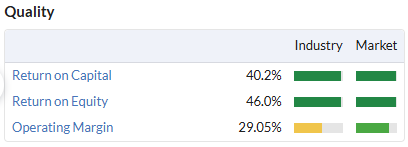
Foresight’s StockRank Style has now shifted to Contrarian, reflecting the slight loss of momentum. But Mark took an AMBER/GREEN view following the latest trading update and I remain broadly positive on this stock, as do the StockRanks:
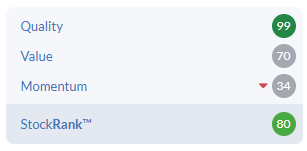
I added Foresight to SIF at 446p on 20 January 2026.
Pebble (LON:PEBB)
I added this marketing and promotional merchandise business to SIF at the start of March, following a recent in-line trading update and Super Stock styling.
At the time, earnings forecasts suggested double-digit growth this year. The valuation looked reasonable to me, with a forward P/E of 12 and 4% dividend yield.
Unfortunately, full-year results later in March prompted Pebble’s brokers to cut earnings forecasts for the current year on the back of higher spending guidance. Interestingly, the shortfall in earnings appears to have been added to next year’s forecasts:
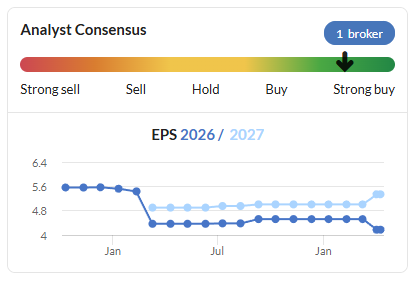
Even so, my rules are clear in such circumstances – sell on a profit warning.
The StockRanks retain a more positive view and Pebble still has its Super Stock styling, so it’s possible that I acted too hastily.
Such glitches are inevitable with a rules-based system, but I believe my trading decisions are still far more consistent when following these rules than they would be otherwise.
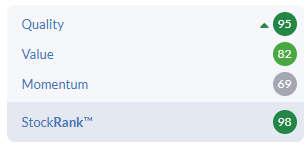
I added Pebble to SIF at 52.3p on 3 March 2026. The position was subsequently closed following a profit warning during the quarter – see below for details.
Sold Stocks
Here’s a summary of the stocks I sold from SIF during Q1 2026:
Name | Bought / Sold | Income Return | Total return | Reasons for sale |
Imperial Brands (LON:IMB) | 2,271p on 15 Oct 24 | 10.1% | 42.8% | Failed relative strength and EPS upgrade rules. |
Anpario (LON:ANP) | 370p on 8 Apr 25 | 3.1% | 57.2% | Failed rolling PEG ratio rule. |
Cake Box Holdings (LON:CBOX) | 195p on 13 May 25 | 5.3% | 6.8% | Failed relative strength and F-Score rules. |
Pebble (LON:PEBB) | 52.3p on 3 Mar 26 | 0% | -3.9% | Profit warning for 2026. |
Topps Tiles (LON:TPT) | 47.5p on 16 Dec 25 | 4.4% | -23.2% | 25% stop-loss rule. |
Aviva (LON:AV.) | 572p on 6 May 25 | 11.0% | 15.5% | Failed multiple momentum rules. |
Knights group (LON:KGH) | 157.5p on 3 Jun 25 | 3.2% | 5.7% | Failed multiple momentum rules and F-Score rule. |
Seplat Energy (LON:SEPL) | 227.5p on 10 Jun 25 | 4.0% | 119.3% | Failed sales growth and rolling PEG rules. |
International Consolidated Airlines SA (LON:IAG) | 322p on 17 June 25 | 2.7% | 10.6% | Failed multiple momentum rules. |
Disclosure: At the time of publication, Roland owned all the shares shown in the 31 March 2026 portfolio snapshot.
Disclaimer
This is not financial advice. Our content is intended to be used and must be used for information and education purposes only. Please read our disclaimer and terms and conditions to understand our obligations.

16 comments
Morning Roland,
In your SIF portfolio what do you do when at the 9 month review point a stock doesn't appear on the sell screen list (i.e. should be sold) but does appear on the buy screen? This appears to be an anomaly and is the case with Endeavour Mining (LON:EDV) a stock I hold in my version of the SIF portfolio. Appreciate your thoughts.
Profit warning around jet fuel price but Ed Croft mentioned no matter what sell when a profit warning
I bought IAG at about 130 as I knew it would recover. If only trump didnt invade..I was bottom fishing covid shares and this has been a Gem over 5 years
The core problem is fuel. Jet fuel prices surged after late February following disruption linked to the Iran conflict and the Strait of Hormuz. Q1 only captured a limited portion of the impact because hedging protected near-term costs, but management warned that Q2 and Q3 will be much more affected. Fuel cost guidance has risen toward €9bn for the year, capacity growth plans have been reduced, free cash flow is now expected below the previous €3bn target, and management explicitly warned that full-year profit will be lower than originally anticipated. Shares initially fell around 5.5% to roughly 374p after the warning before recovering toward 385p, suggesting the market views this as a serious but manageable earnings downgrade rather than a structural collapse.
Importantly, this is not a demand warning. IAG repeatedly stated that premium demand, business travel and transatlantic bookings remain resilient, with Q2 booked revenue broadly in line with historical levels. The market concern is therefore centred on fuel prices, geopolitics and how much higher costs airlines can pass through to customers. Management believes around 60% of higher fuel costs can be recovered through pricing and cost actions, implying the group still has meaningful pricing power.
Overall, the results suggest IAG is evolving into a structurally stronger airline group with high margins, strong premium exposure, leading hub positions, growing loyalty revenues and one of the best balance sheets in the sector. The near-term earnings outlook is weaker because of fuel and geopolitical pressures, but operationally the business itself still looks very strong.
To sell or not that is the question.
Eds graph that shows after 100 trading days after the profit warning it falls off a cliff. If the Iran passageway is sorted then maybe it will recover and the 245 case studies on profit warnings Ed talked about might not apply?
Very nice read, Roland. I'd be well happy with a 9% return. And you didn't need Mag 7 stocks to get a good return.
Have you compared the performance of your SIF shares with the rest of your portfolio?
Getting out of an oil share, Seplat Energy (as the oil price sits around the $100 mark) without any analysis on the impact of significantly higher oil prices seems a bit strange to me.
Hi jamest007,
Taking a view on the future direction of oil prices would be speculative and subjective, so not compatible with my rules-based SIF strategy.
I recognise that in some circumstances this approach means I'll underperform, but equally it has also saved my bacon on some occasions...
Roland
Seplat Energy (LON:SEPL) one of the strengths of Roland's approach is that it makes an active sell decision. Traditionally this is the hardest thing in investing. To have bought at 230p and sold at 490p is a good result. Coincidentally in my less rules-based system I also sold Seplat at 490p on the grounds that absolutely everything looked to be in its favour.
Buy low, sell high. I bought SHEL when its share price was in the basement. Brent was like $40 a barrel and "experts" were predicting it would go lower. I got out too early, having doubled my money. I had no idea the Iran thing would happen.
Yes, oil is significantly higher now, but where will it be in 2 year's time? Nobody knows. We could be seeing a permanent shift in oil prices, or the crisis might resolve, panic over, and the price of oil and oilers going down.
True, the P/FCF of SHEL looks attractive at 10%, so arguably I made the wrong call.
The interesting point about this portfolio is the sell review at nine months. Personally, i review at six months and tend to go for more momentum style firms.
Roland mentions that performance is similar to the NAPS which has a twelve month holding period. I would be interested for any comments on whether the shorter holding period has helped or not.
Hi Epitychia,
My initial rules when I started SIF were for a sell review at six months. I changed to nine months after the first year or two (I can't remember exactly) for a couple of reasons:
Update: I discussed this change in more detail (with additional backtesting) in this 2020 piece:
https://www.stockopedia.com/co...
In short, the main reasons for my switch were:
- I modelled what would have happened if I'd extended six months to nine and found that my results would have been better if I'd held for nine months. Obviously this is quite subjective and only tested against a small subset of stocks; it won't apply to all strategies.
- A nine month holding period was more consistent with my use of RS1y (1-year relative strength), which research has found is more predictive over 6-12 months.
- More tangibly, I wanted to be sure that every company issued a fresh set of accounts (to be digested by the Stocko algorithms) during its time in the portfolio. In my view, this approach provides a more objective view on whether the stock still meets my original criteria for an extended holding period.
For example, if both the share price and earnings have risen, the P/E and PEG ratio may be unchanged. Over <6 months, that kind of progress doesn't show up in the accounts and valuation metrics: instead, the shares simply appear to get more expensive.
One other comment re. SIF and NAPS - what I meant to say is that the ratio of winners to losers in SIF has been very similar to NAPS on a 10-year view. The two portfolio's actual performance has differed significantly at times.
Roland
Thanks for the information. Very interesting.
I review at 6 months and cut those that have fallen more than 5% or where the situation seems worse. On the date of purchase the latest accounts may already be 3 to 6 months out of date. So this is enough time for Mr Market to digest those old results and a fresh set of numbers may have poppod up in the 6 month holding period.
A company can have a good set of accounts, low PER etc etc but be out of fashion. I want to cut these. Eventually they will shine but i dont want to wait 3 years for this to happen.
Essentially it is an approach based on fundamentals but tempered by the realisation that the market can be inefficient or i have been inefficient and missed something in the original review.
P.S. Obviously this only works with a modest bid / ask spread.
What was its biggest DD in % over the 10 years out of interest?
Hi WTT,
I don't have a record of drawdowns, but I'm fairly sure it was at the start of the pandemic.
From 19 Feb 20 to 19 Mar 20, the portfolio fell by 30%.
For much of 2020 , I had a temporary 'no sell' rule, on the basis that I didn't want to sell anything at such bombed out prices (I hoped this was true!). As it happens, this paid off well and allowed me to benefit from the market rebound.
Holding cash in the portfolio going into 2020 meant that I was also able to add new stocks during this period.
I discussed SIF's 2020 performance in this review:
https://www.stockopedia.com/co...
Roland
Hi thanks for this Roland!
Can I ask, do you reinvest dividends or just keep them as cash for when an opportunity identifies itself?
Thanks Josh,
All dividends are held in SIF and reinvested over time, supporting gradual growth in position sizing.
Roland
That's interesting. Does the FTSE All-Share reinvest dividends? I thought it considered only the share prices.