SIF Income portfolio 2025: battling the FTSE 100 winners

2025 marked the first year of the SIF portfolio’s tilt to income. My initial impression of the modest changes I made in order to increase the portfolio’s yield are that they’ve worked largely as expected.
While underperforming the market slightly, SIF delivered a respectable double-digit gain in 2025 and generated a useful income premium over its FTSE All-Share index benchmark.
Given the market backdrop last year, SIF’s lack of exposure to FTSE 100 big caps probably held back performance. That’s inevitable sometimes.
Fortunately, the portfolio’s returns were lifted by takeover offers for International Personal Finance (LON:IPF) and Bakkavor (LON:BAKK) and the belated purchase of gold miner Endeavour Mining (LON:EDV). The latter has since become the portfolio’s largest position.
I’m broadly happy with last year’s result and plan to leave my screening rules unchanged in 2026. This should allow the updated system to deliver a year of returns without any transition impact (positive or negative) from selections made under the previous rules.
Let’s take a closer look at how the portfolio performed last year and at SIF’s trading activity since my Q3 update.
How the SIF folio works: as a quick reminder, SIF is a model portfolio that I mirror within my own real money portfolio. Here is a summary of the rules I use to buy and sell shares:
I select new shares from my SIF stock-buying screen in a weekly review, adding new shares when possible, while taking into account diversification by sector and the number of existing holdings;
Shares are held for a minimum of nine months. However, if a stock issues a profit warning or falls by more than 25% below the portfolio’s cost price, it’s sold at the next weekly review;
After nine months, I test shares against my SIF stock-selling screen. If they pass all the rules, they remain in the portfolio subject to a rolling monthly review. If they fail, they’re sold.
SIF 2025 performance: +17%
The SIF portfolio delivered a total return of 17.1% in 2025, including 5.6% of dividend income. As with Ed’s NAPS, this was the third-best year in the portfolio’s history since its inception in 2016.
That SIF underperformed the FTSE All-Share while also delivering such a solid result highlights how strong the returns from the UK indices were last year. That’s not an excuse for underperforming. But as Ed explained in his year-end StockRank review, outperforming market cap-weighted indices is not always easy for stock-picking investors.
The chart below shows SIF’s 2025 total return versus the index’s capital gain in 2025:
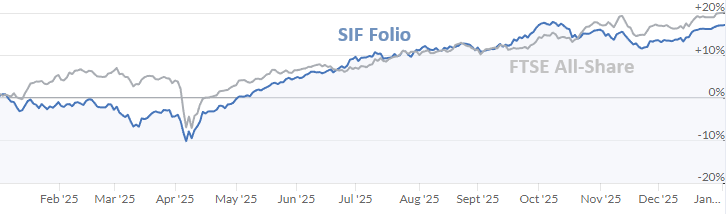
Here’s a more detailed comparison of the portfolio’s performance against its benchmark, splitting out income and capital gains:
2025 | Capital Gain | Income | Total Return |
SIF Folio | 11.5% | 5.6% | 17.1% |
FTSE All-Share | 19.8% | 4.2% | 24.0% |
Zooming out for a long-term view, here’s how SIF has performed against the FTSE All-Share since its inception in April 2016. Again, 2025 includes SIF dividends but not those for the All Share:
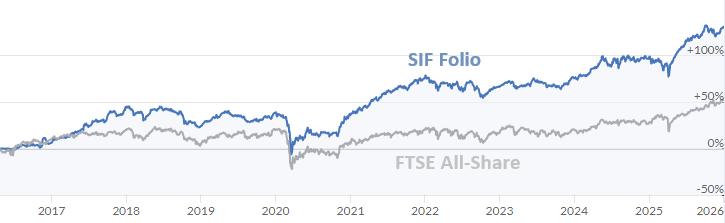
In total, the SIF portfolio has delivered a gain of 131.4% since April 2016, or 9.1% annualised (including dividends for 2025 only).
The FTSE All Share index has risen by 56.9% on an equivalent basis over the same period, giving an annualised return of 4.8%.
Winners and losers in 2025
2025 was relatively busy for the portfolio, with a total of 23 positions closed during the year. At the top of the list were two takeovers. At the bottom were several companies whose share prices were hit by profit warnings and declining expectations:
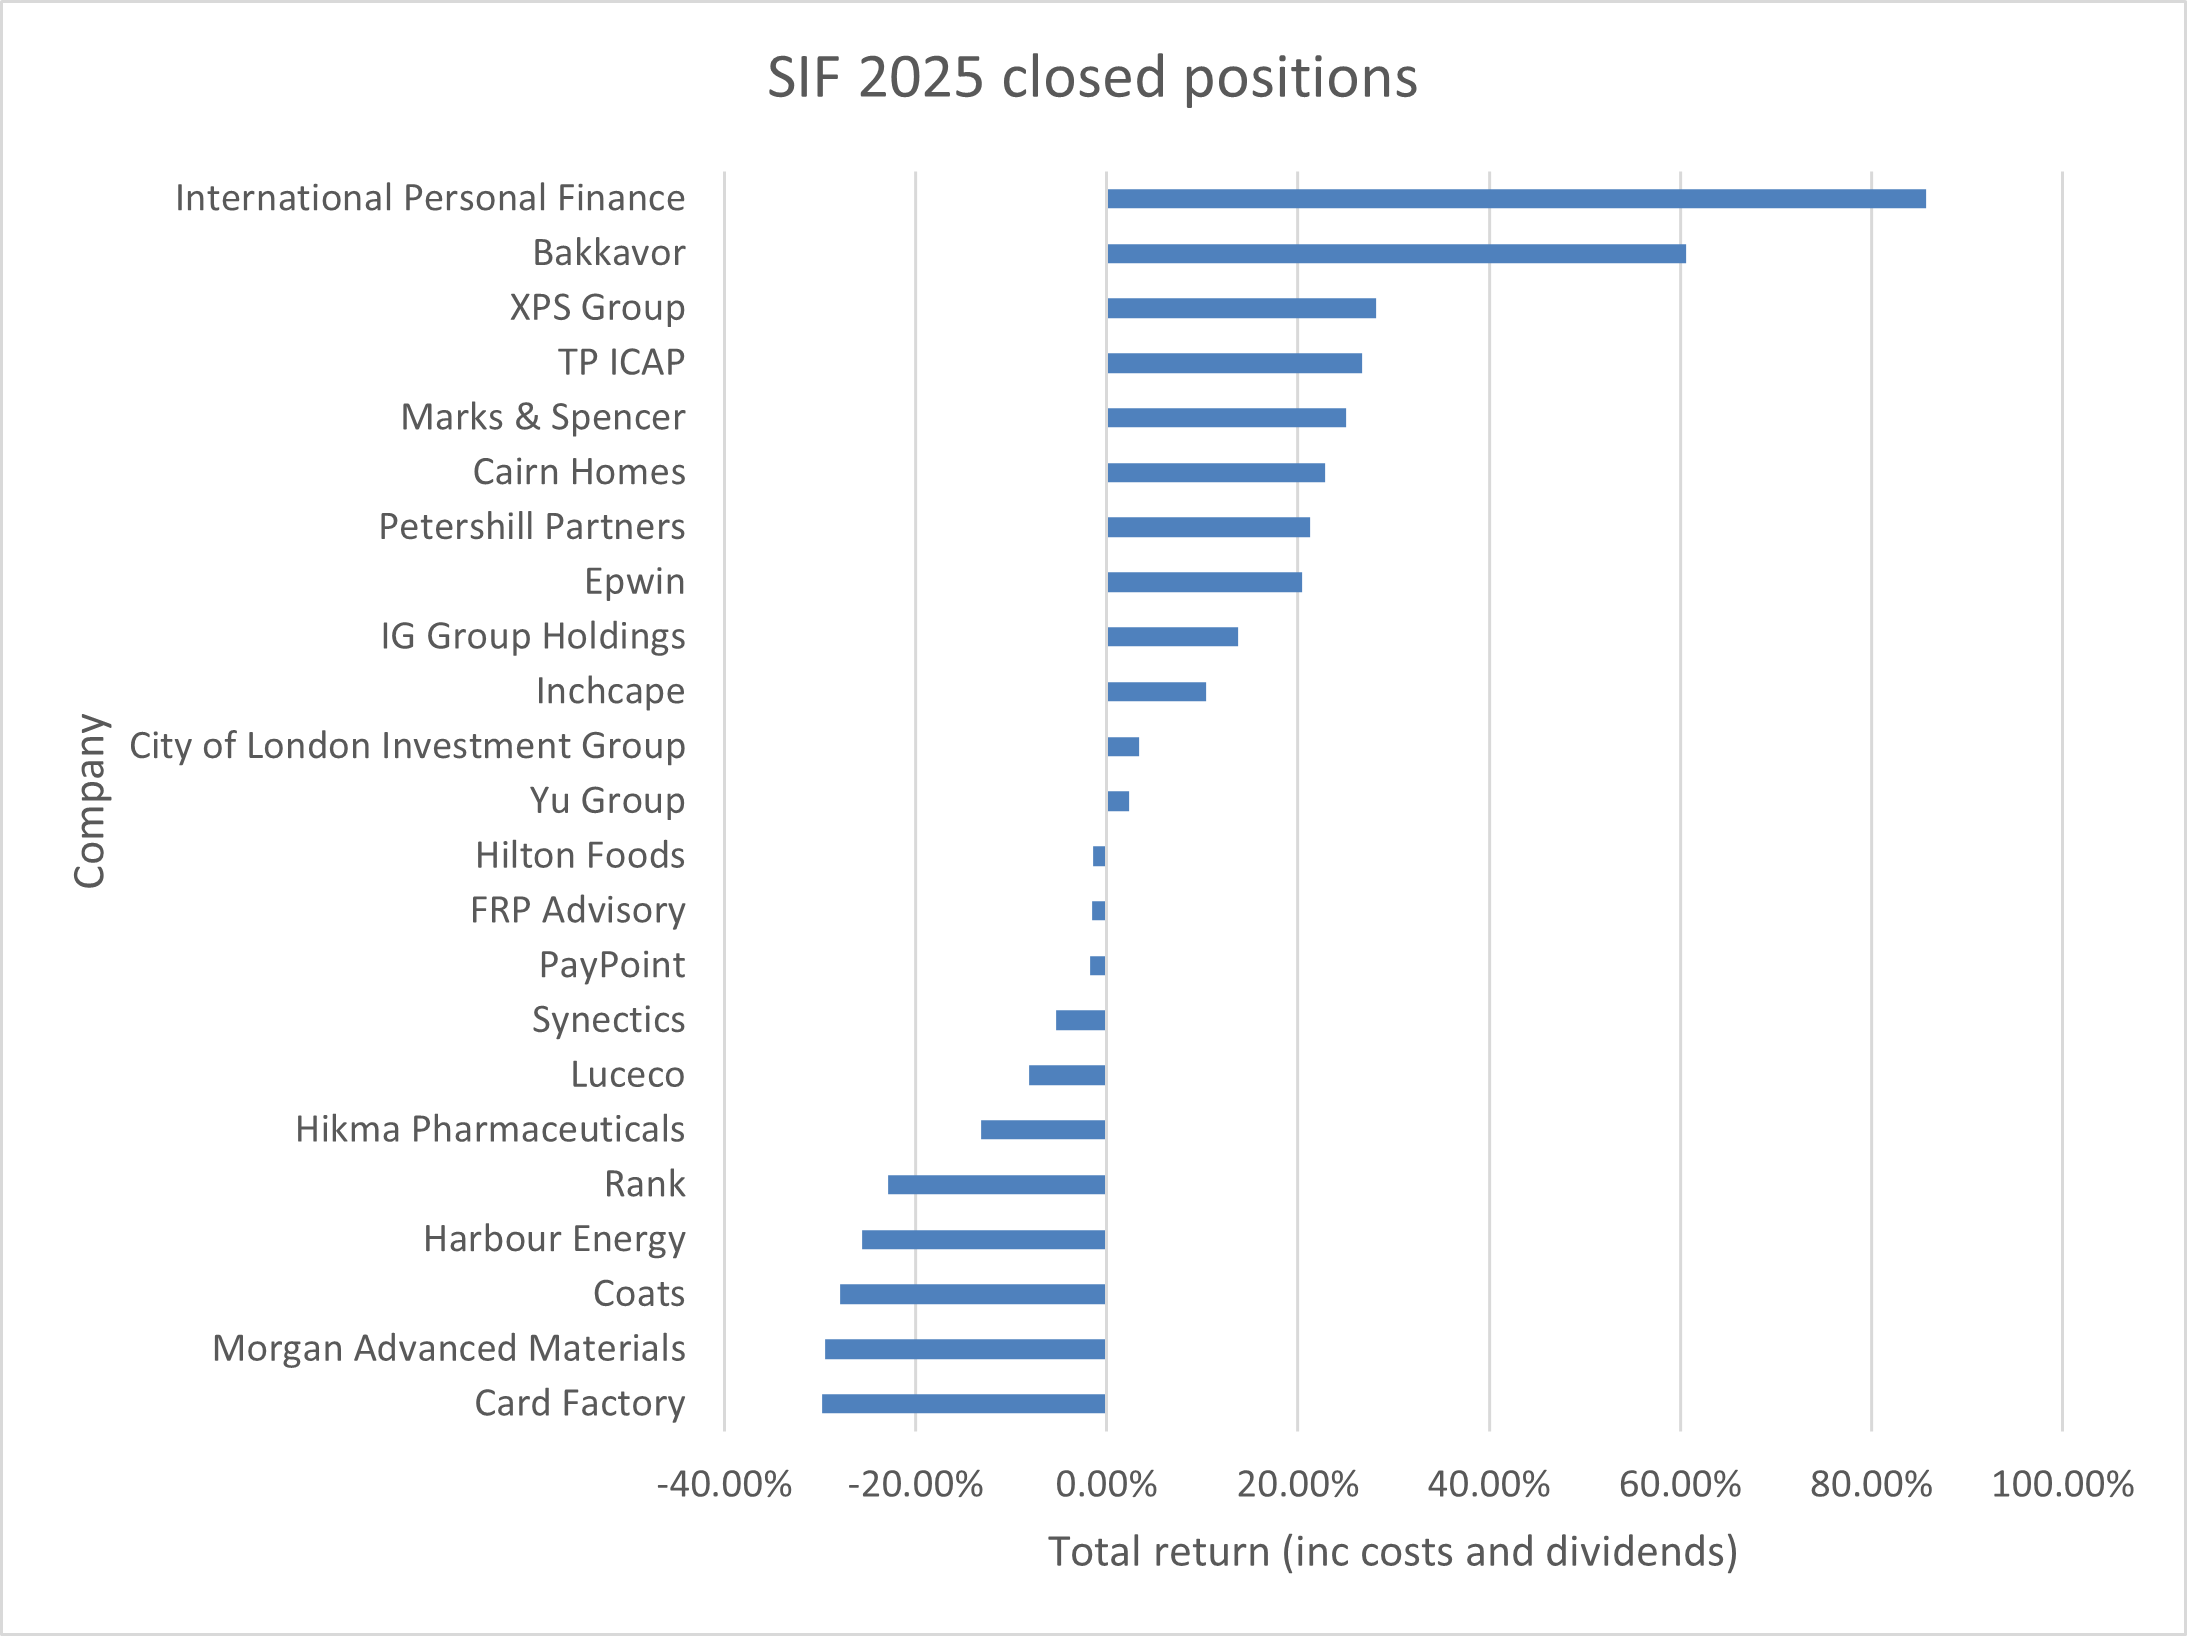
The 12 winners outnumbered the 11 losers by a small margin.
However, what’s probably more significant is that the winners’ average gain of 26.7% comfortably outweighed the losers’ average loss of 15.2%. This helped drive the portfolio’s overall positive return.
I believe that achieving this result is at least partly attributable to my 25% stop-loss and profit warning sell rules.
After nearly a decade of running SIF, I’ve become convinced that cutting losses is crucial in a trading portfolio like SIF, where holding periods are limited. In my view, the benefits of cutting losers comfortably outweighs the risk of missing out on the occasional rapid recovery.
SIF Q4 portfolio review
Of the 23 shares sold last year, 10 were sold in the final quarter. This somewhat hectic series of disposals was not matched by new buys. My screening results dried up during the closing months of 2025, providing fewer new opportunities.
In total I made the following SIF trades in Q4:
Buys: 4
Sales: 10
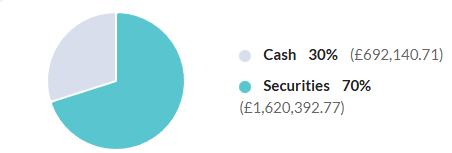
As a result of this imbalance, the number of holdings in the portfolio fell from 20 to 16 during Q4. When combined with a strong Q4 weighting to dividend payments, this left SIF somewhat cash-rich at the end of the year. At the end of December, SIF’s cash balance accounted for 30% of the portfolio’s value, up from 12% at the end of Q3:
Position sizing: I review the portfolio’s position sizing quarterly to help manage SIF’s cash weighting. My aim is to always have sufficient cash to be able to open new positions during a market crash, but not so much cash as to needlessly dilute the investment returns from my holdings.
To try and achieve this, I calculate position size by deducting 20% from the value of the portfolio and dividing the remainder by 20. All positions are equally sized and there are no top ups.
This formula is an approximation and probably errs towards excessive caution. But it’s served me well for nearly 10 years and I don’t plan to change it in 2026. SIF’s default position size will remain unchanged at £90k in Q1 2026.
Portfolio Snapshot
Here’s a snapshot of the portfolio on 2 January 2026:
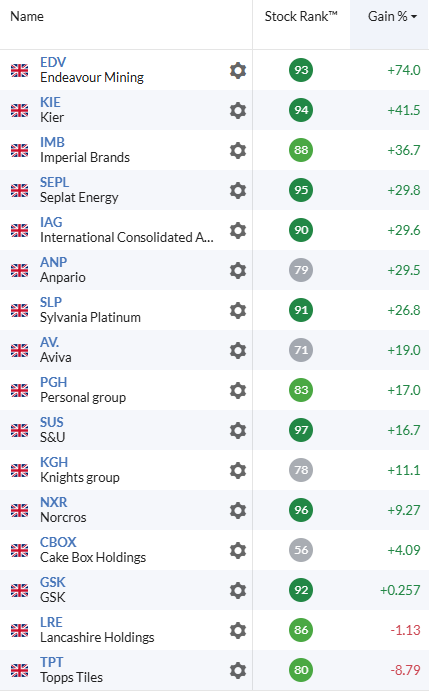
Portfolio metrics
One change I made last year was to introduce a new reporting measure to track the average valuation of the stocks in SIF. Against a backdrop of positive returns, I am pleased to see that the stocks in SIF became slightly cheaper and higher yielding last year.
I’m also encouraged to see the portfolio’s average PEG ratio has remained under 1x. This suggests that at least some of my shares may be priced attractively relative to expected earnings growth:
Period | P/E rolling 1y | Div yield rolling 1y | PEG rolling | Cash weighting | No. holdings |
Q1 2025 | 9.7 | 5.3% | 1.0 | 13% | 18 |
Q2 2025 | 10.2 | 5.0% | 1.9 | 5% | 21 |
Q3 2025 | 10.3 | 4.8% | 0.8 | 13% | 20 |
Q4 2024 | 9.8 | 5.3% | 0.9 | 30% | 16 |
In the remainder of this article, I’ll take a look at the new stocks I added to the portfolio during Q4 2025.
Portfolio changes in Q4 2025
New stocks
GSK (LON:GSK)
The FTSE 100 pharmaceutical group has been a disappointing investment for many years. But performance has improved and I think the business is in a stronger position – with better momentum – than it has been for some time.
The StockRanks look favourable…
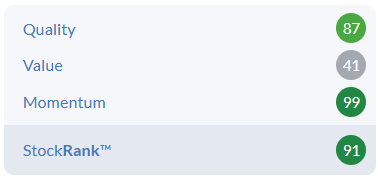
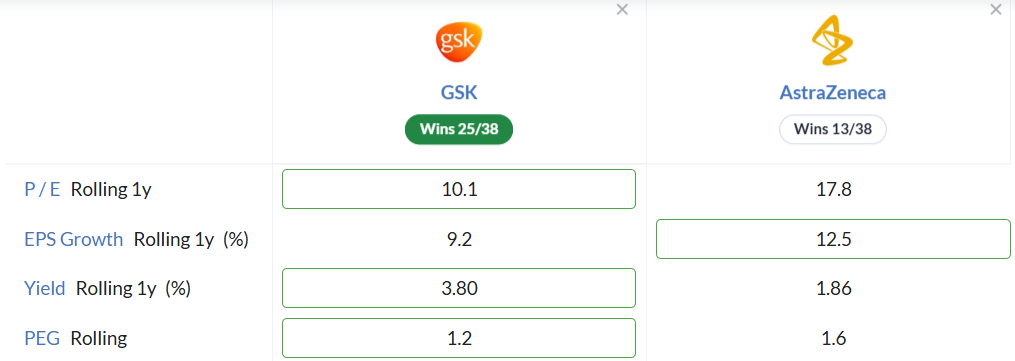
… while the shares continue to trade at a significant discount to FTSE peer AstraZeneca. If recent earnings momentum can be maintained, I’d like to think this discount could narrow:
I took a broadly positive view on GSK’s third-quarter results in October. These highlighted particularly good progress in the Specialty Medicines division, supporting a modest upgrade to guidance.
I’m also optimistic about the company’s new CEO, Luke Miels, who took charge on 1 January. While I think his predecessor Emma Walmsley made significant progress and was unfairly criticised at times, Miels was the architect of much of the company’s reshaped portfolio, in his previous role as Chief Commercial Officer. He’s a career pharmaceutical specialist with deep sector knowledge and seems a good choice to maintain and extend recent new product momentum.
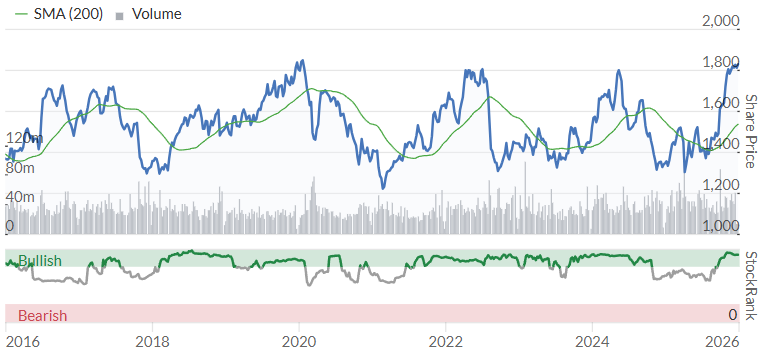
Will 2026 be the year that GSK’s share price escapes the trading range it has occupied for the last decade? It’s too soon to be sure, but I’m cautiously optimistic.
S&U (LON:SUS)
This family-controlled specialist lender operates under two brands, the Advantage motor finance business and the newer Aspen business, which provides bridging loans for property developers.
Like much of the wider motor finance sector, S&U’s trading has been held back by regulatory and legal challenges recently. However, these issues are now largely resolved or contained and recent trading has been strong, as highlighted by Chairman Anthony Coombs in December’s trading statement:
This surge clearly confirms the abilities of our businesses, once freed from the shackles of regulatory intervention.
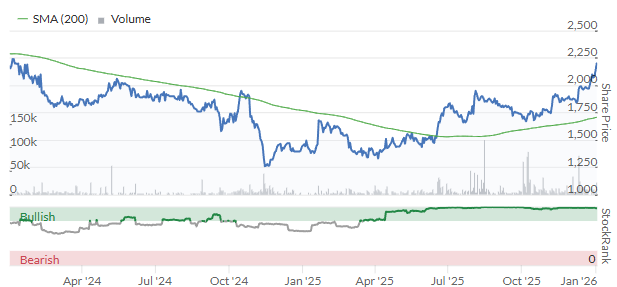
While S&U shares are no longer trading at a discount to book value, I think the valuation remains reasonable for a company that was generating double-digit returns on equity until recently.
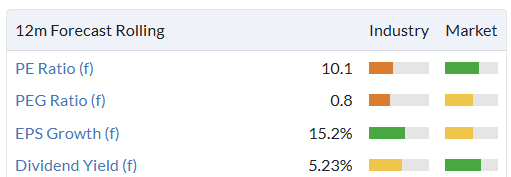
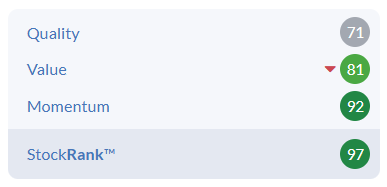
High ValueRank and MomentumRank scores suggest to me that we could see continued share price strength if trading news remains positive:
Norcros (LON:NXR)
Bathroom and kitchen products company Norcros is something of a perennial value stock – although investors with good timing have been able to enjoy some attractive returns over the last decade:
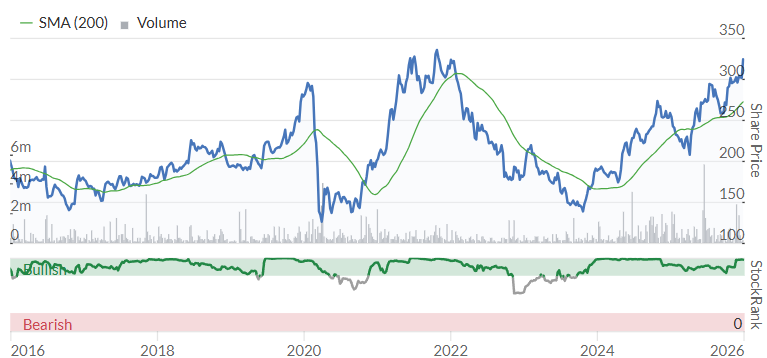
This chart might seem to suggest that now is the time to be taking profits, rather than adding exposure. This may yet prove to be true. However, I think there are some factors supporting the view that Norcros could be on a more sustainable growth trend this time.
As Mark observed in July, continued acquisitions are helping to achieve economies of scale and lessen the impact of the company’s long-running pension deficit.
Mark’s prediction that the Fibo acquisition would be earnings accretive also appears to have been correct. A useful EPS upgrade followed November’s interim results, which were otherwise said to be in line with expectations:
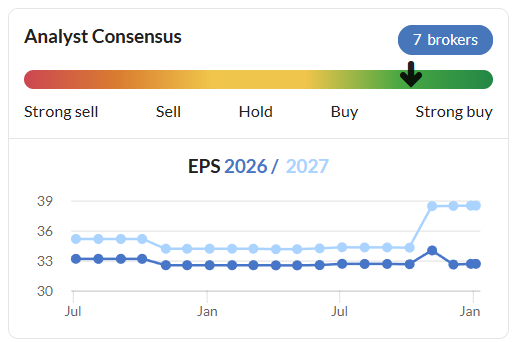
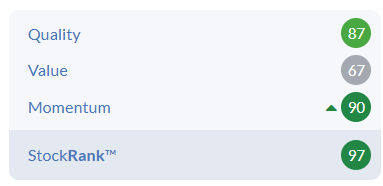
Earnings growth is now expected to be c.18% in FY27, which begins in April. If that can be achieved, the current forward P/E of 9 looks undemanding to me. I’m pleased to see this view supported by attractive Quality and Momentum scores:
Topps Tiles (LON:TPT)
There is perhaps a little too much overlap between Norcros and my most recent addition, leading UK tile retailer Topps Tiles. I’ve justified this by viewing UK-centric Topps as a pure-play on the housing market and domestic economy, whereas Norcros also operates in South Africa and is a manufacturer. But there’s definitely some overlap, all the same.
I try to avoid too many subjective decisions when running SIF, but choices such as these inevitably arise sometimes.
Topps itself appears to be trading well, with growth across its core, online and trade operations. Adjusted revenue rose by 6.8% to £265.4m during the 52 weeks to 28 September 2025, while adjusted pre-tax profit climbed 46% to £9.2m.
This dramatic improvement in (adjusted) profits was driven by improved gross margins, which supported a c.£10m increase in gross profit. This comfortably outweighed the £5.77m increase in operating costs over the same period.
One potential risk is a major management reshuffle. Longtime CEO Rob Parker was replaced by Alex Jensen on 8 December, while Topps will also get a new CFO when Caroline Browne joins from Watches of Switzerland Group in the spring.
In the meantime, Topps recently appointed its second interim CFO since the departure of the previous incumbent in September. This suggests to me that the appointment of a new permanent CFO may have taken a little longer than hoped for.
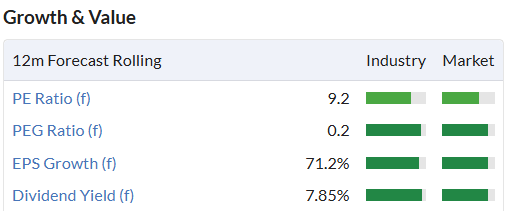
With the caveat that a new management team might adopt a new strategy, Topps Tiles’ valuation and dividend yield look appealing to me, from both value and income perspectives:
The company’s balance sheet looks fine as well, with net cash excluding lease liabilities at the end of last year.
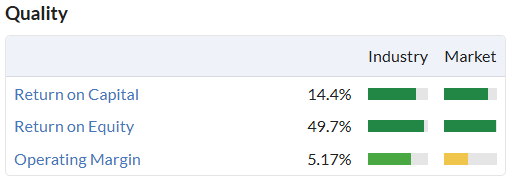
Quality metrics are also strong, with a respectable 14% return on capital employed:
I’ll be keen to see what the new CEO has to say in January’s trading update, but I’m encouraged by last year’s positive trading and evidence of improving momentum.
Sold stocks
Here’s a summary of the stocks I sold from SIF during the fourth quarter of 2025.
Name | Bought / Sold | Income Return | Total return | Reasons for sale |
City of London Investment (LON:CLIG) | 388p on 10 Dec 24 | 8.5% | 3.3% | Failed 7/14 rules in my sell screen due to lack of broker coverage and weak relative strength.. |
Synectics (LON:SNX) | 306p on 3 Dec 24 | 1.5% | -5.9% | Sold as the stock failed three of my momentum rules. |
Hikma Pharmaceuticals (LON:HIK) | 1,885p on 15 Apr 25 | 3.3% | -13.2% | Profit warning. |
PayPoint (LON:PAY) | 619p on 11 Mar 25 | 11.2% | -2.5% | Broker cut EPS forecasts. |
TP Icap (LON:TCAP) | 220p on 12 Mar 24 | 14.2% | 26.7% | Failed multiple momentum rules. |
IG group (LON:IGG) | 1,011p on 4 Feb 25 | 3.3% | 13.8% | Failed multiple momentum rules, also PEG ratio above limit. |
Rank (LON:RNK) | 131p on 7 Oct 25 | 0.0% | -22.9% | Sold following Autumn Budget after company warned of significant potential hit to profits. I concluded a cut to FY26 expectations is likely. |
Card Factory (LON:CARD) | 101p on 4 Nov 25 | 1.3% | -29.8% | Profit warning. |
International Personal Finance (LON:IPF) | 132p on 7 Jan 25 | 8.9% | 85.7% | Firm takeover offer - see here. |
Inchcape (LON:INCH) | 717p on 18 Mar 25 | 3.7% | 10.4% | Failed 1yr relative strength rule. |
Disclosure: at the time of publication, Roland owned all the shares listed in the SIF portfolio. He also owned shares in IG Group Holdings and City of London Investment Group.
Disclaimer
This is not financial advice. Our content is intended to be used and must be used for information and education purposes only. Please read our disclaimer and terms and conditions to understand our obligations.

12 comments
Do you ever screen SIF on non UK markets at all, or is it purely UK? If not, is there a reason why not? Thanks in advance for any reply.
As I recall, there was something done for the US, but the results weren't great. Alas, I have no further details on that point. Despite this, I did set up a couple US orientated SIF portfolios as an experiment. I didn't religiously follow the rules, so its validity is questionable, but the results were lower than the S&P, though a few gems were found along the way:
Jon
Hi Mark,
Apologies for the belated reply. I did attempt an International SIF at one time, but the initial results were not very encouraging and it was difficult to justify the coverage. I discontinued the effort some years ago now.
In theory, following the SIF approach doesn't require much market-specific knowledge or in-depth company research. So I don't see any reason why it couldn't work elsewhere. However, the UK market has normally provided sufficient material to work with and is my main interest. UK stocks are also our main focus for coverage here at Stockopedia, so I've been content to stay local.
Regards,
Roland
Apologies if this has been covered already, but I’ve noticed that some stocks appearing on the Buy SIF screen don't show up on the Sell SIF screen. Should I only be buying a stock if it meets the criteria for both screens?
The rules are slightly different for each screen. The "Sell" screen would probably be better called a "Hold" screen, i.e. sell if the company doesn't appear there.
But the "Buy" criteria is only given by the "Buy" screen. Thus, buy from the buy screen and continue to hold after 9 months, if the company still appears in the sell screen.
Great update thanks, was about to update my portfolio I notice Rank is back in the buy list, any thoughts?
Thanks Roland for your comprehensive reports.
As you have done , i introduced a tighter manual stop loss when the UK market kept trundling along at a low level. Results days would either see a good rise or a big fall so for each i would determine direction & often sell & occasionally buy back on good news. If i had good profits in the bag , that allowed me to hold on a little bit longer.
Previously in a more bullish market i would hold after a large fall , in expectation & eventually dump them except since '22 a few ,in which i still had faith I continued to hold as there was not anything i considered worth buying. The Lost Opportunity advantage was not attractive. However happily those i held finally came back into profit eg. VLX ; RR. ; BEZ ; SLP ; the last nearly a Triple Banger in reverse
Lessons., i hope learnt, to modify my Stop Loss depending on the state of the market being invested.
Wishing everyone a Healthy life and Portfolio, for and beyond 2026.
Norcros (LON:NXR)
As Mark observed in July, continued acquisitions are helping to achieve economies of scale and lessen the impact of the company’s long-running pension deficit.
Of the two main measures used the headline figure (On an IAS 19R accounting basis) actually confirms there is a surplus now ref the pension and has been for the last2 years - ok the backup version - The actuarial deficit - does still show a modest deficit at 31/3/2024.
Overall though the pension seems reasonably sound as the deficit payments are planned to stop in 2027 - and there is possibility interim payments may go into eschrow so they can be clawed back if not needed.
Thats a decently healthy position imho
Note imho its more the "size" of the pension that might be a worry and drag rather than there being any material deficit - with scheme liabilities curent value of £260 mill thats pretty large sum where the assets to cover these liabilities need to generate positive returns to stop defecit tunring up again (measure 1) or increasing(alternative measure)
Good news is that liabilities number has been trending down nicely and its a very mature scheme - albeit it aint going to go away anytime soon - but its decently under control and trending downward most years ref size of what neds to be paid out - with hope that from 2027 there isnt anything that needs actively funding as thigs stand now.
full commentary form 2025 results
Pension schemes
On an IAS 19R accounting basis, the gross defined benefit pension scheme valuation of the UK scheme showed a surplus of £6.8m compared to a surplus of £16.5m last year. The present value of scheme liabilities decreased by £17.8m as benefit payments made in the year and an increase in the discount rate to 5.60% (2024: 4.85%) were partially offset by a loss in relation to updated mortality assumptions. The value of scheme assets decreased by £27.5m largely due to benefit payments made in the year.
In the current year, the Group reached agreement with the Trustee on the 31 March 2024 triennial actuarial valuation for the UK defined benefit scheme. The actuarial deficit at 31 March 2024 was £11.7m (2021: £35.8m). The current deficit repair contributions were reconfirmed at £3.8m per annum from 1 April 2022 to June 2027 (increasing with CPI, capped at 5%, each year). It was agreed that there would be no further deficit repair contributions after June 2027.
The agreement also included a mechanism where deficit repair contributions would be diverted into an escrow account when the scheme is deemed to be in surplus on a technical provisions basis. In addition, the Group will contribute up to a maximum of £1.0m per annum to cover pension administrative expenses should asset investment performance not be sufficient to cover the ongoing management fees. The 2027 triennial actuarial valuation is expected to take place during the year ending 31 March 2028.
The Group's cash contributions to its defined contribution pension schemes were £3.8m (2024: £3.9m).
'Since April 2026 ' must be a typo! I sold IG group (LON:IGG) but have kept Card Factory (LON:CARD) , PayPoint (LON:PAY) , Synectics (LON:SNX) and TP Icap (LON:TCAP) on while you sold them all Roland. It'll be interesting finding out whether my contrarian view will keep the bacon in the pan or not. I sold the IG because I wanted to crystalise a profit, to put the returns into something that glitters.
I still hold all of those. Tempted to sell some IG group (LON:IGG) but it has momentum now, it is 1332p today. So up about 30% from Roland's sale.
I should have sold Card Factory (LON:CARD) probably.
Card Factory (LON:CARD) Always sell on a profit warning.
Silver Moon, that's now corrected, thanks for flagging it up.
Roland