The Value Factor - cheap beats expensive

In any market, online or off, ebay or car boot sale, humans are wired to look for bargains. We know when we've got a deal. There's a payoff to buying things cheap.
It's no different in the stock market. Cheap stocks tend to outperform expensive stocks. While it's not true every single year nor for every single stock, it seems to hold true, on average, in the majority of three to five year periods across market history. This is known as 'the Value Effect' - which has been the driving force behind many stock market fortunes, and the great cult of Value Investing.
A Background on Value Investing
Benjamin Graham usually gets the credit for being the ‘Father of Value Investing’ due to his writing in the influential tomes Security Analysis[1] and The Intelligent Investor[2]. He was one of the first to lecture about the market beating potential of buying unpopular, cheap stocks, and proved the strategy's veracity by bouncing back from his big losses in the Great Depression. He believed in buying shares so cheap that you could enjoy a 'margin of safety' on the purchase price - so that even in a worst case bankruptcy scenario you'd be able to earn all your money back through a liquidation of company assets. But later in his career he took a more measured, and systematic perspective:
Try to buy groups of stocks that meet some simple criterion for being undervalued - regardless of the industry and with very little attention to the individual company. It seems too good to be true, but all I can tell you after 60 years of experience, it seems to stand up under any of the tests I would make up. Ben Graham
While Graham succeeded in rebuilding his wealth, it was the students of Ben Graham who really capitalised on the deep value effect. Becoming known as the Super Investors of Graham and Doddsville many went on to return more than 20% per year for their investors over long periods of time. Among this cohort was Warren Buffett who perfected Graham's methods, improving them along the way to become the wealthiest investor in the world with a fortune of over $100 billion.
While it took a long time for academics to catch up with the practitioners, in 1992 Eugene Fama and Kenneth French published The Cross Section of Expected Stock Returns[3] - the nexus of an academic career that would eventually see them win the Nobel Prize for Economics. They illustrated that portfolios of cheap stocks ranked by the humble Price to Book Ratio (P/B) consistently outperformed expensive stocks. They proposed that the high returns investors in these stocks received was compensation for holding fundamentally riskier stocks - potentially at risk of distress.
But this reasoning was challenged a few years later in a 1994 paper [4] which measured the returns to 'cheapness' across many more measures (P/E ratio, P/B ratio, P/CF ratio included). They assessed how cheap stocks performed in many environments, including recessions and market declines. They found little evidence that value strategies were riskier than growth strategies. In fact, they concluded that the active avoidance of cheap stocks by both individual investors and institutional investors meant they were systematically oversold. Cheap stocks were priced too cheap.
While all these results were extremely promising for the craft of value investing, investors in the strategy went through two periods of difficult underperformance. In the dotcom bubble up through the late 1990s, and in the period after the global financial crisis from 2011 to 2020. Many observers during these periods wrote about "the death of value", but these periods were defined by central bank interventions that encouraged manias and kept interest rates anomalously low. Value strategies seem to have always bounced back with vigour when more normal market environments return.
How can you measure Value?
Investors can measure the pure relative cheapness of a stock by comparing its price against either how much the underlying company earns, how much it sells or how much it owns and comparing it to other stocks. These methods create sets of financial ratios that divide the price of the stock (P) by each measure of value.
The Price/Earnings Ratio (P/E for short) is by far the most popular financial ratio for individual investors. Studies show that buying groups of relatively cheap stocks according to their P/E can lead to market beating, albeit volatile, returns. Similar results have been proven for almost all the other valuation ratios (Price to Sales, Price to Book, Price to Dividends and so on).
But these different valuation ratios can enjoy different times in the sun. Indeed there have been entire decades when one or more of these measures have underperformed. Nobody enjoys underperformance and most investors who do invest using a strict P/E based strategy often throw in the towel (or are force to) at exactly the wrong time.
Is there a solution?
Yes. Composite value scoring systems have been used successfully by many investors since Benjamin Graham originally designed his ‘Graham Multiplier’ in 1949. This simply multiplied the P/E ratio and P/B ratio to create a simple composite value score. This pioneering idea has been extended by quantitative investors for decades, with a variety of value scores being published by the giant indexing firms like Standard & Poors, MSCI & iShares.
One of the most classic studies on this idea for individual investors is by James O'Shaughnessy's in the 4th edition of his excellent What Works on Wall Street[5]. He showed that Value Composites based on the average ranking across valuation ratios could consistently beat the market.
Between 1964 and 2009 O'Shaughnessy showed that using Price/Sales alone - the cheapest 10% of stocks by Price to Sales returned 14% with a standard volatility of 21% annually. But by using a composite value factor instead the return was improved to 17% and the standard volatility reduced to 17%.[5]
No single measure of value is demonstrably better than another. But, an average of multiple measures is usually best.[6]
Why does the Value Effect work?
If stock markets were perfectly efficient, cheap stocks wouldn't be able to outperform expensive stocks. The fact that they do requires an explanation that generally falls into one of two camps:
Cheap stocks outperform because they are riskier. Cheap stocks tend tend to be less profitable, have more debt, and are more prone to bankruptcy than expensive stocks. In bad economic times, these kinds of companies can become distressed so investors require an additional premium to take on that risk.
Cheap stocks outperform because investors are biased against them. Investors become overly-pessimistic about the prospects for unfashionable, out of favour, distressed stocks and struggle to believe that their low prices will recover. This leads to over-reaction, excessive selling pressure, delayed buying and persistent underpricing.
Regardless of the explanation, investors who are willing to systematically go against the grain, and take on the risks of value stocks tend to earn a market-beating reward for doing so.
Stockopedia's Value Rank
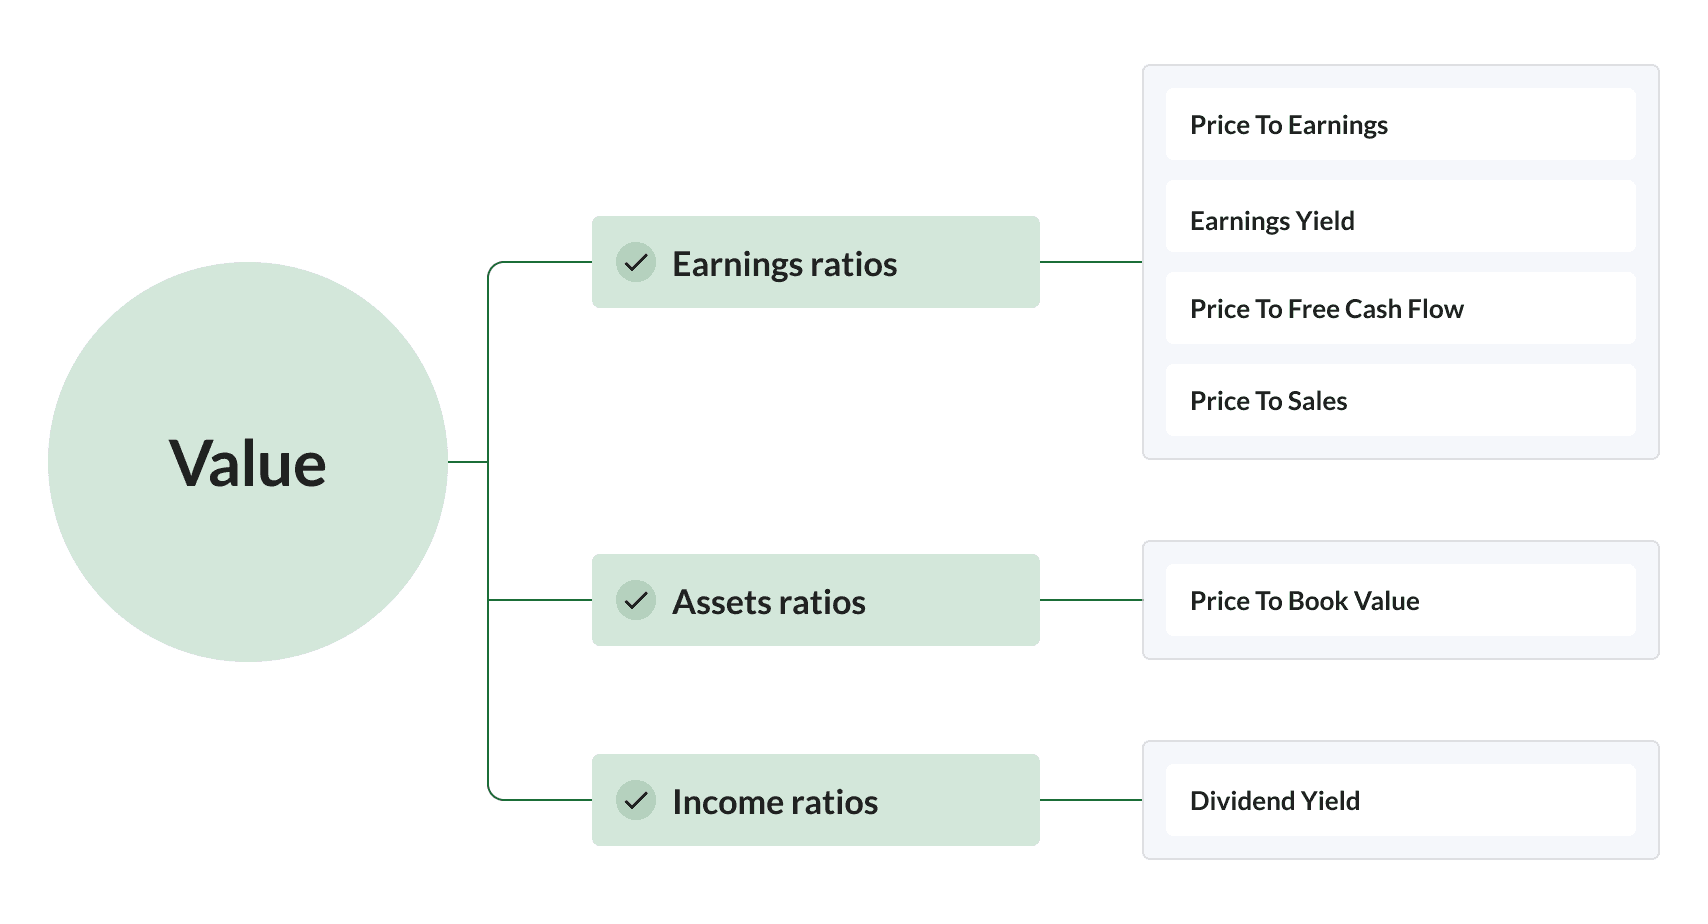
All the above methods have inspired the Stockopedia ValueRank. We've defined the Value Rank as an equally weighted composite of the following six valuation ratios:
Price to Book Value: comparing the stock price versus what it owns
Price to Earnings: comparing the stock price versus what it earns
Price to Free Cash Flow: comparing the stock price versus the cash it generates
Dividend Yield: comparing the stock price versus the dividends it pays out
Price to Sales: comparing the stock price versus the sales it generates
Earnings Yield: comparing the value of the enterprise versus what it earns
Each company in the market is ranked from 1 to 100 for each of these value ratios and a composite score is calculated as the weighted average of all valid values. The Value Rank is then calculated as a percentile rank between zero and 100 for this composite score, where 100 is best and zero is worst.
Consistent with value investing conventions, we use backwards looking historic data for each of these ratios, rather than using forecast data from analysts. Analyst forecasts are not ignored, but are used as a component of the Momentum Rank which we define in an upcoming chapter. This keeps a purity to to the Value Rank as a measure of backwards looking ‘cheapness’.
- Benjamin Graham and David Dodd. Security Analysis. 1934
- Benjamin Graham. Intelligent Investor: The Definitive Book on Value Investing. 1949
- Eugene Fama and Kenneth French. The Cross-Section of Expected Stock Returns. 1992
- Josef Lakonishok, et al. Contrarian Investment, Extrapolation and Risk. 1993
- James O’Shaughnessy. What Works on Wall Street - 4th Edition.
- Clifford Asness, et al. Fact, Fiction and Value Investing. 2015