
A finding is only as good as the way it was measured. Markets are a graveyard of reasonable ideas that fell apart the moment someone tested them properly. So before I hand you rules worth acting on, let me open up the research room - the dataset, the definitions, and, most of all, the things we did on purpose to stop ourselves from fooling ourselves. If any of the guards below had been left off, the numbers in the chapters that follow would be worth nothing. With them on, I think they are worth a great deal.
The dataset and the window
We took every UK-listed share on the London Stock Exchange, measured every week, from early 2014 to June 2026 - about twelve years. At any given moment that market held up to 2,000 listed tickers, of which about 1,300-1600 carried a StockRank depending on the year in a typical week. The rest were investment trusts, or too new, too small, or too data-poor to score, and we left them out.
Two details matter more than they might sound. First, the data is point-in-time, or "as published". Each weekly snapshot uses the rank a member would actually have seen on their screen that Monday, archived from our published data. There is no restated history and no hindsight. Second, we excluded investment trusts and suspended lines. Trusts are baskets of other assets and don't behave like operating businesses; suspended shares have no live price to trade against. Leaving them in would have muddied the read.
What counts as a jump
The whole study turns on one definition, so it is worth being pedantic about it.
A jump is a strict crossing up through a threshold - the rank was below the line one week and above it the next, moving up through 80 or through 90 rather than being already there. We required the move to be at least 5 rank points, so that a stock nudged over the line by rounding noise doesn't count as an event. And we applied a six-month cooldown per stock: once a name triggers a jump, it cannot trigger another for six months.
That cooldown is not just housekeeping. Ranks are jittery in exactly the stocks we care about - a small cap on the cusp of the top decile can flicker across the 90 line four or five times in a single quarter as its price wobbles. Without a cooldown, that one company would post half a dozen "events", all measuring almost the same twelve months, all sharing the same eventual fate. A single lucky multi-bagger could stuff the sample with copies of itself and flatter the average; a single blow-up could do the reverse. The cooldown forces each name to speak once per episode, so the study counts distinct stories rather than the same story stuttering. It also matters for the statistics, as you'll see below - duplicated observations masquerade as independent evidence when they are nothing of the kind.
Run that definition across the whole market and twelve years, and you get 5,902 jump events: 3,901 crossings up into the top quintile (rank 80 and above) and 2,001 into the top decile (rank 90 and above). That is the raw material of the study.
Returns throughout are price-only, split-adjusted, and exclude dividends. Including dividends would have lifted the headline figures - these are often decent, cash-generative companies - but I wanted the conservative read. Leaving dividends out means the edge you'll see is, if anything, understated. I would rather show you a floor than a ceiling.
The dead and delisted stayed in
This is the most important thing about the study.
The easiest way to make a backtest look brilliant is to quietly drop the companies that went bust or delisted. The losers vanish, the survivors remain, and the average returns become inflated. This is called survivorship bias, and it is responsible for an enormous amount of nonsense in backtests.
We did not do that. Every delisted stock is held in the sample right down to its last traded price, and that final number sits inside every average we quote. When Carillion collapsed 94% and went to the wall, that 94% loss is in the numbers. So is Flybe at -98%, Afren at -98%, and Morses Club at -98%. These were not distant names - several of them were high-ranked, respectable-looking businesses that qualified as jumps and then failed. They are not swept into a footnote. They are in the averages, dragging it down exactly as they would have dragged down your portfolio. When you read a return in this study, the failures are already priced into it.
The control group: the incumbents
A return on its own tells you nothing. "+15.9% over twelve months" sounds wonderful until you ask the only question that matters: compared to what? If every high-ranked stock made +15% in the same window, then the jump added precisely nothing.
So every jumper is measured against a control group we call the incumbents - the stocks that were already sitting above the threshold in those same weeks. Think of the top decile as the VIP room. The incumbents are the regulars who were already inside the room. We sample the incumbents the same way, over the same overlapping windows, and charge them the same trading costs. The only thing that differs between the two groups is how they got into the room: the incumbents were already there, the jumpers had just arrived. That is the whole test - not "do high-ranked stocks do well?" but "does the act of arriving tell you anything the incumbets don't already know?"
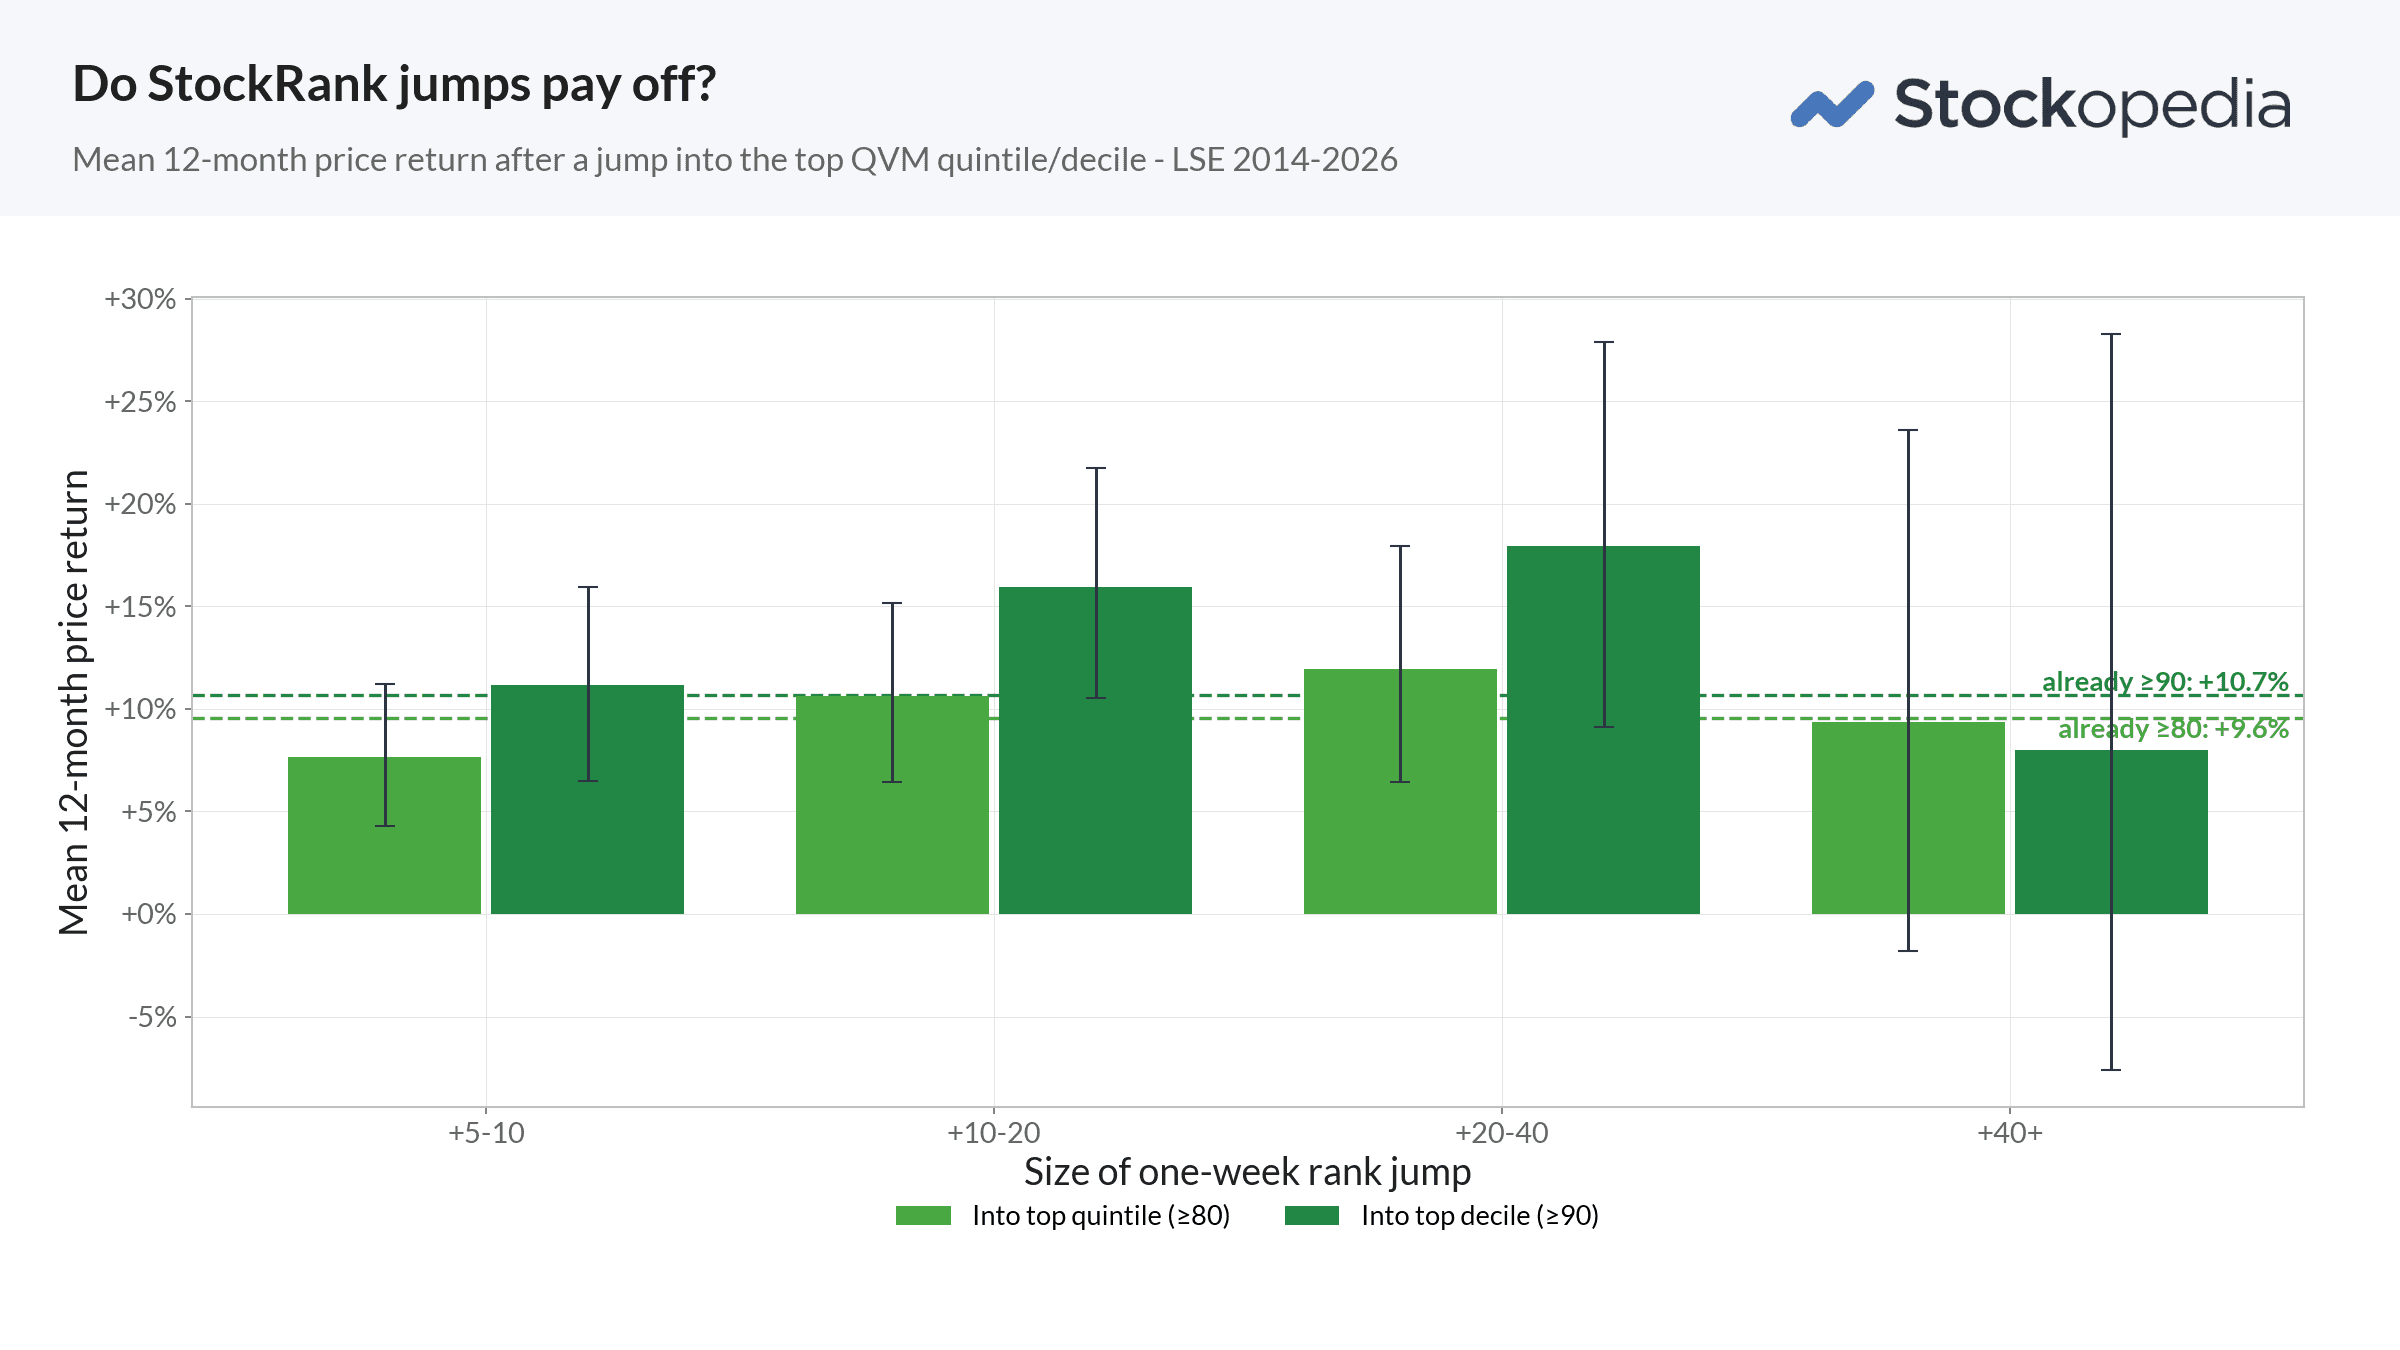
So these numbers set against a fair control group, drawn from the same market in the same weeks and charged the same friction, become the evidence. Everything you read from here rests on that comparison.
Costs, charged by size
There is a special dishonesty available to anyone backtesting small-cap strategies: pretend the trades were free. Bid-ask spreads on tiny, illiquid shares are wide, and a strategy that looks brilliant on paper can be eaten alive at the point of dealing. So we modelled a full round-trip cost for every trade, scaled by company size, including 0.5% stamp duty and 0.2% commissions on top of the point-in-time bid/ask spread.
The result is a sliding scale. The larger, more liquid names in the tradeable universe cost less than 3% for a complete round trip; the smallest, thinnest shares cost significantly. That is a heavy toll, and it is meant to be - it reflects what dealing in neglected small caps actually costs a real investor. Crucially, every performance figure in this series is quoted net of these costs. When a later chapter tells you the strategy compounded at a given rate, that is what would have landed in your account after friction, not before. The cost of trading is not a caveat bolted on at the end. It is baked into the number.
With the scaffolding in place, we can state the findings.
Next: Chapter 3 - Buy the leap, not the creep. The core finding: the edge lives in the top decile, in a specific sweet spot of jump size - and small jumps are worse than useless.