
It started, as our research often does, with a question from a member in the forums:
"When a stock's StockRank suddenly jumps into the top decile, is that a buying signal - or have I already missed the move?"
It's a fair question, and a good one. We've all watched a share climb the StockRanks and wondered whether the jump itself tells us something, or whether the crowd already got there first. Until now, nobody had taken a long, hard, look at the numbers. So we did.
We measured every UK-listed share on the LSE, every week, from 2014 to June 2026 - about twelve years of point-in-time data, no hindsight and no restated history. Every time a stock's QVM StockRank jumped up across a threshold in a single weekly step, we tracked what happened over the following twelve months. The result is the largest study we've ever run on a single behaviour of the ranks - 5,902 jump events in all, 3,901 into the top quintile (a rank of 80 or above) and 2,001 into the top decile (90 or above) - and it gave us a finding clean enough to turn into a rule.
Before you ask - yes, the losers are included. Every stock that later delisted is held to its last traded price and sits inside every average - Carillion at -94%, Flybe and Afren at -98%. Returns are price-only, dividends excluded. If anything, that understates the edge. And throughout, the honest set compared is the incumbents: the stocks already sitting above the threshold in the same weeks, sampled the same way and charged the same costs. New arrivals versus the regulars. That's the whole test.
The headline finding
The signal appears real, and it mostly lives in the top decile (90+ StockRanks) - rather than the top quintile (80+).
A QVM jump of +10 to +20 points that lands at a StockRank of 90 or above returned +15.9% over the following 12 months, against +10.7% for the stocks already sitting up there - a +5.3% edge. Push the jump to +20 to +40 points and the return rises to +17.9%. But a stock easing over the line on a +5 to +10 drift? No edge at all. A small drift into the quintile actually underperformed the incumbents. And past +40 points the whole thing falls apart - those are usually distress moves, and the delisting rate roughly doubles.
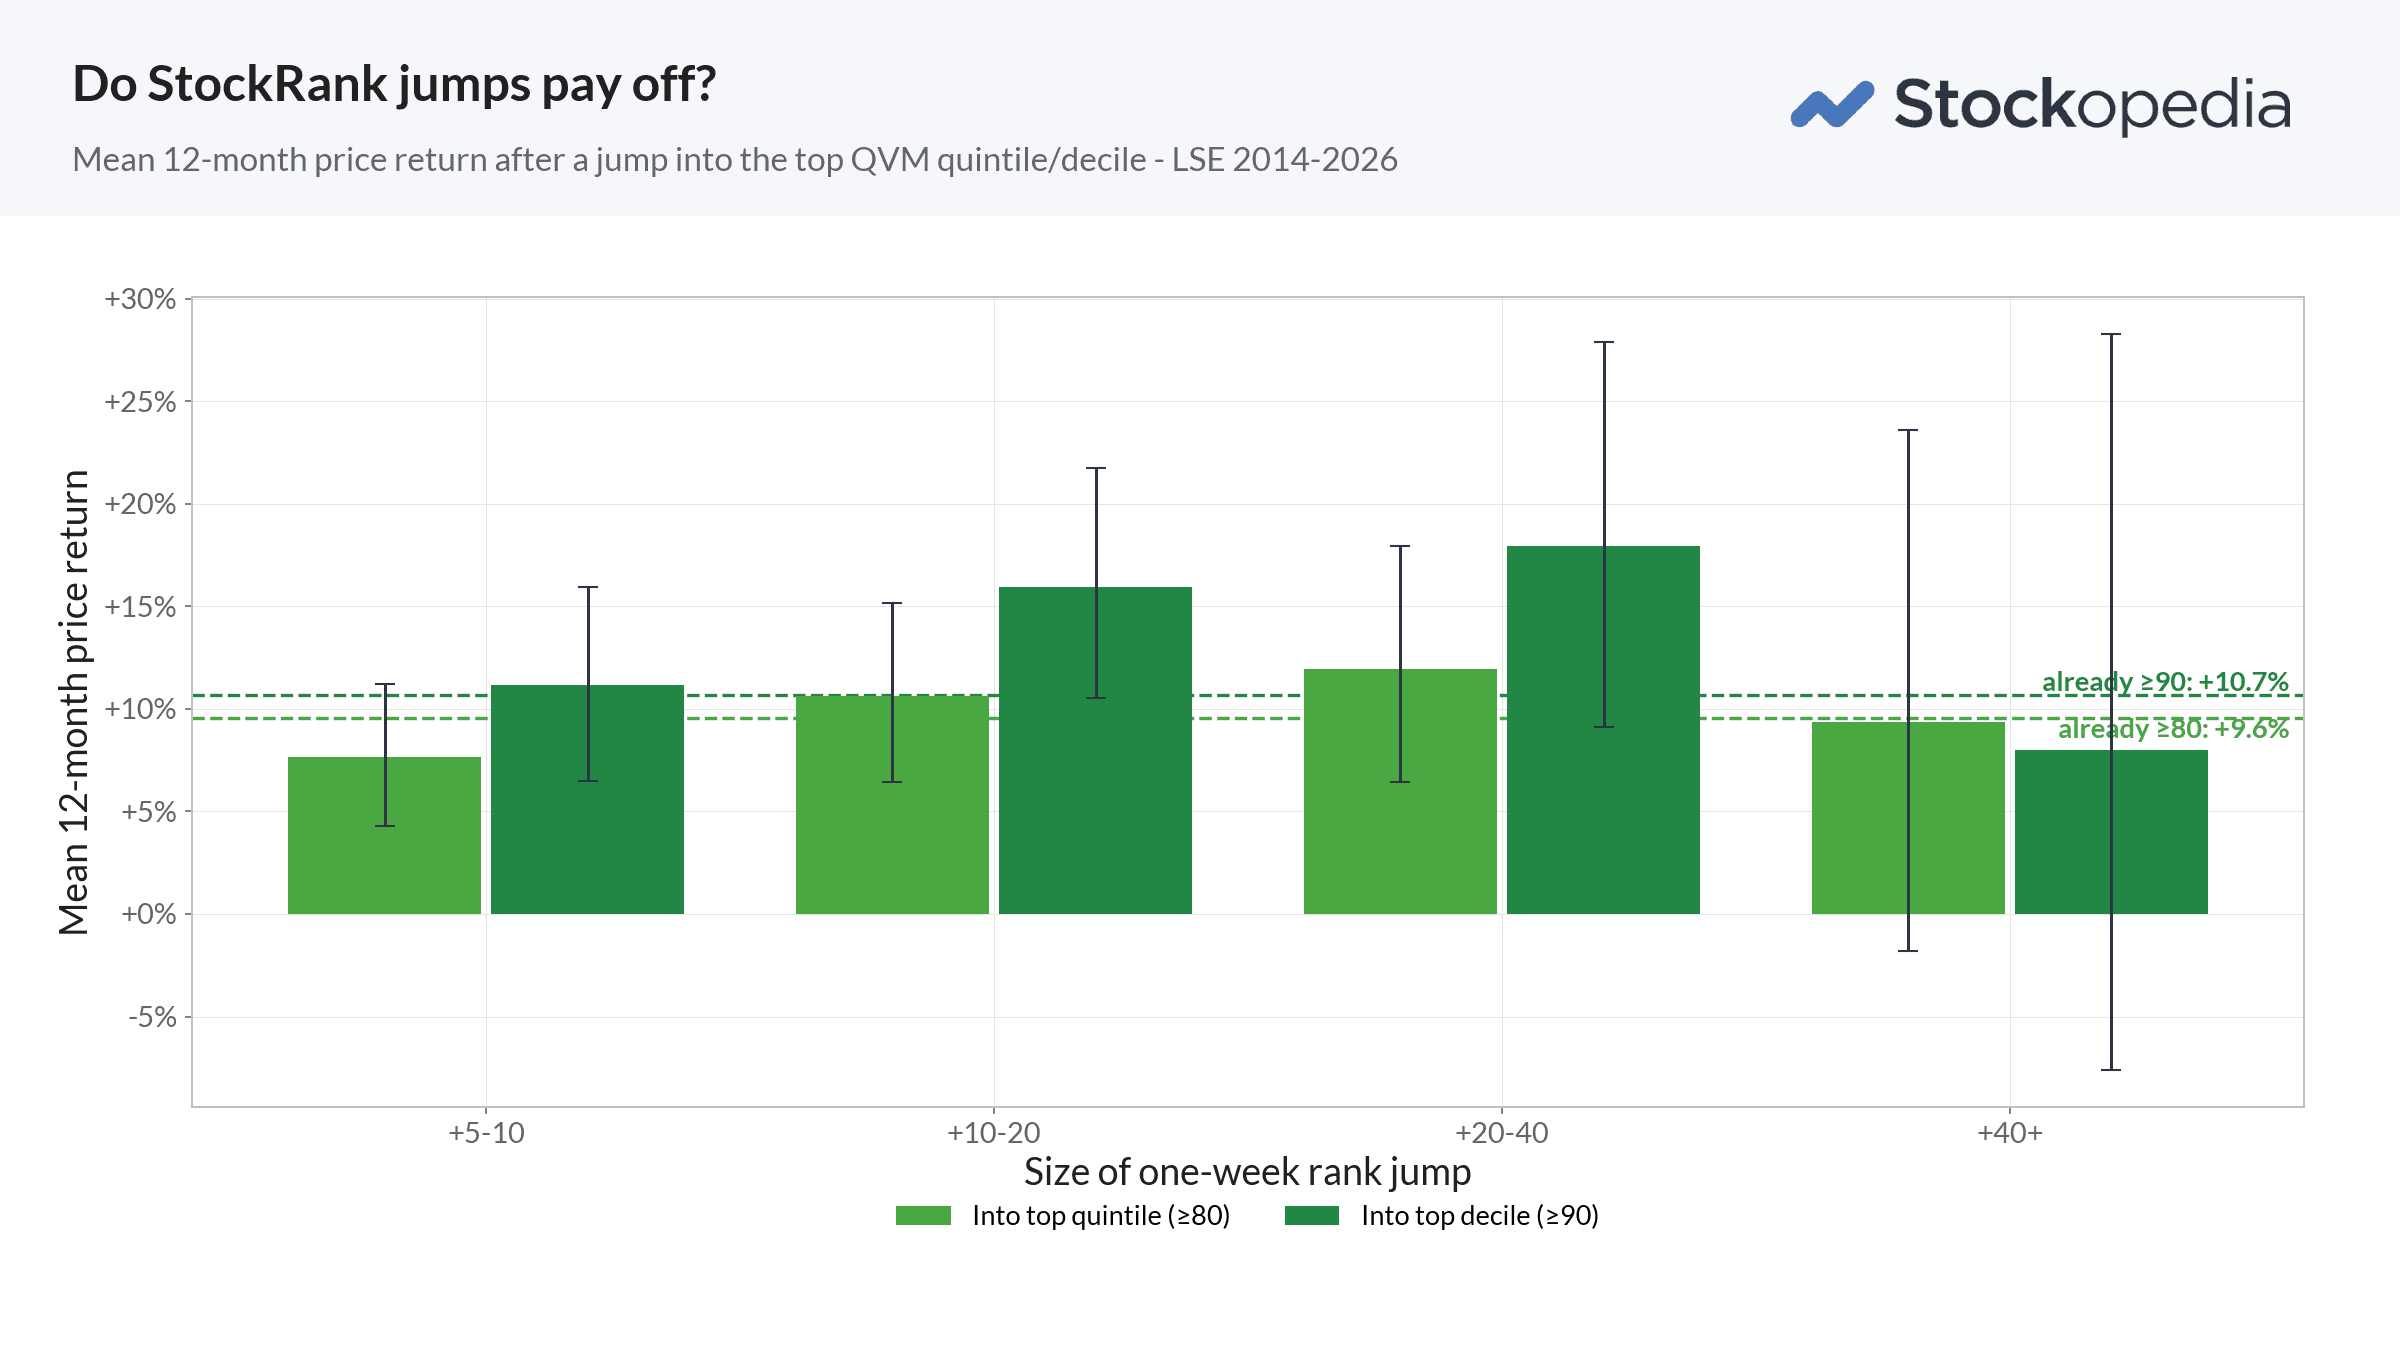
So the size of the jump matters, and where it lands matters even more.
Why a jump can carry an edge
The natural objection is that markets are efficient - if a company is doing well, the price should already reflect it. In a heavily-watched mega-cap, it largely does. But the jump effect lives in the neglected corners of the market, in the small caps nobody large is paid to follow, and there the repricing is slow.
Think of it in three parts. When results land, prices move - but rarely far enough, and rarely fast enough. Analysts, anchored to models they built months ago, nudge their forecasts up only part-way, so the same company comes in "ahead of expectations" again until the numbers catch up. And often existing shareholders, itching to bank a quick gain, sell their winners too early, while new interested buyers are slow to act, staying anchored to the old, lower price. Too much selling, too little buying, expectations adapt one notch at a time - and a jump in the rank (on average) turns into a share price climb.
That's the whole idea in a sentence: the jump is the data noticing. The drift is the market slowly agreeing. The rank catches the inflection in a single week, and the price spends the next year catching up. It's a neglect premium - it exists precisely because institutions aren't looking, which makes it the UK private investor's structural advantage rather than a professional's.
The 90/80 Rule
Buy a +10 to +40 point QVM jump that lands at a StockRank of 90 or above. Hold while the rank stays at 80 or above. Sell on the first weekly close back below 80.
Two rules of thumb sit underneath it. Buy the leap, not the creep - a big jump is a signal, a small drift is noise. And the rank knows more than the calendar does - exit on a rank break below 80, rather than a fixed date. Run net of full costs, that rule delivered +16.5% CAGR with a Sharpe of 1.25 - the rank-based exit adds around 4% a year over a plain six-month hold, and lifts Sharpe from 0.79 to 1.25 on the very same entries. The sell discipline, not the buy, does the heavy lifting.
This is an idea I'll happily admit we built on top of someone else's. Christian Reschenhofer's earlier work gave us a prior "90/70" rule, and we hardened it, tightening the exit from 70 to 80. Beyond this, every figure is net of modelled trading costs, but it's a basket effect - hit rates run 53% to 61%, so at least four or five in every ten positions end up flat or down. The edge is the gap between the winners and the losers across the whole book, never any single pick.
The map of the territory
Seven articles follow. Each stands alone, but they build in order:
What is a StockRank jump? - StockRanks, the QVM rank, the 80 and 90 thresholds, and the difference between a leap and a creep.
The evidence - the dataset, how we defined a jump, why the dead stayed in the sample, and how we kept ourselves honest.
Buy the leap, not the creep - the core finding as a rule: the edge is in the top decile, in the +10 to +40 sweet spot.
The 90/80 Rule - the full entry and exit rules, and the evidence that the rank beats the clock as an exit.
Where the jump effect lives - it's a sub-£350m phenomenon, strong in Healthcare and Technology, and historically weaker in Financials and Energy.
Case studies - Rolls-Royce and Kromek, and Yü Group, a small-cap that ran nearly six-fold while its rank held the decile for a year - and Carillion, the honest loser we show as a reminder for caution.
Building a jumpers' portfolio - the practical playbook: run it as a basket of around 20, expect a 53% to 61% hit rate, and the temperament it takes to stay the course.
Three things to take away
The edge is in the decile, not the quintile. Jumps that finish at 90+ pay; jumps that finish at 80+ largely don't.
Buy the leap, not the creep. A +10 to +40 jump is a signal. A +5 to +10 drift over the line is noise - and sometimes worse than noise.
It's a base rate, not a guarantee. Hit rates run 53% to 61%, means beat medians, and the wins live in a long right tail. This is a basket strategy, not a one-stock bet.
If you want the full method, the confidence intervals, the costs and the robustness checks, the complete research study - The StockRanks Jump Effect - is available as a downloadable PDF. The chapters here are a readable tour.