A closer look at the earnings quality of Aveva (LON:AVV)

.jpg)


Leading software companies have the ability to change the world but their heavy R&D spend, intangible assets, and intellectual property can make them tricky to value.
Take Aveva (LON:AVV), for example. AVEVA Group plc provides a broad portfolio of engineering, design and information management software to various industries. It has grown sales at a rate of 36.2% per year for the past three years to £486.3m as of FY2018.
Aveva's share price has more than doubled to 3066p in the past year and now stands at more than 30 times forecast earnings - yet the group's compound annual growth rate in earnings per share is negative over three years (-6.41%), five years (-5.48%), and 10 years (-1.86%). So what's going on?
Applying the Beneish M-Score to Aveva (LON:AVV)
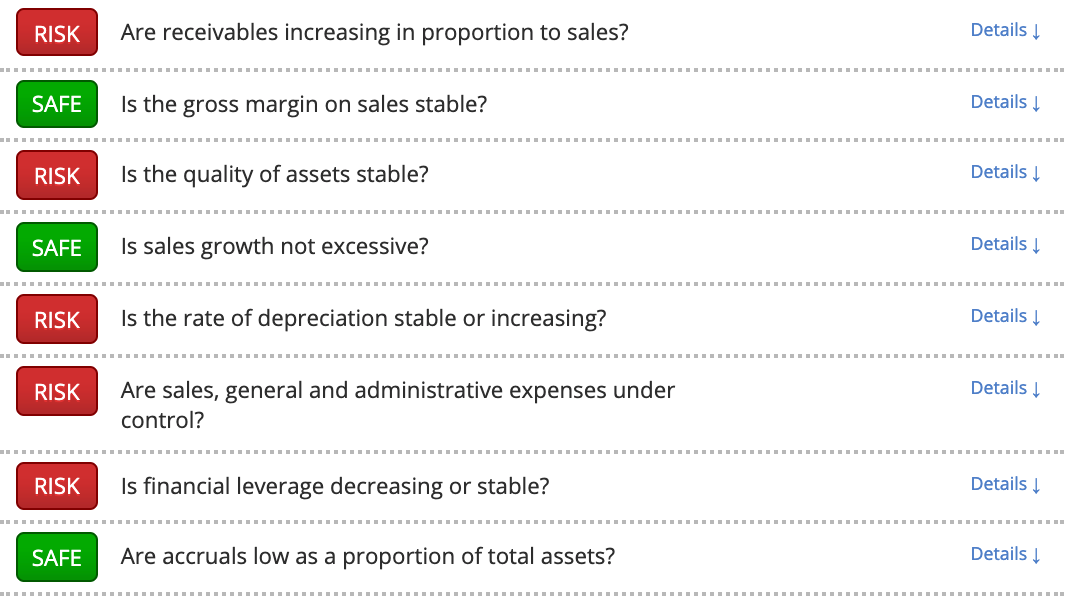
Professor Beneish’s M-Score looks at the year-on-year change in eight different ratios that can be worked out from a company’s financial statements. It looks for these red flags:
- Inflated revenues
- Declining gross margins
- Capitalised and deferred costs
- Excessive sales growth
- Lengthening depreciation periods
- Rising sales expenses
- Increasing leverage
- Higher accruals
Aveva actually fails our Beneish M-Score test, with a rating of -1.69 just squeaking beyond the -1.78 threshold that signifies a potential risk to quality of earnings. Here is a graphic that shows how Aveva measures up:
About Aveva (LON:AVV)
This checklist does not indicate any kind of wrongdoing but it does highlight areas to investigate in more detail.
It is also worth noting that, while earnings have been trending negatively over the last few years, analysts are currently forecasting that Aveva's earnings per share will jump up by 53.6% in the current financial year.
Next Steps
To find more stocks like AVEVA, you'll need to equip yourself with professional-grade data and screening tools to pinpoint the highest quality companies in the market. This kind of information has traditionally been closely guarded by professional fund managers. But our team of financial analysts have carefully constructed this screen - which gives you everything you need.
In less than a minute, you can be exploring a list of stocks with the very strongest financial ratios in the market. You'll be joining us on a journey towards owning the very best quality stocks possible. So what are you waiting for? Come and get started for free.
About us
Stockopedia helps individual investors make confident, profitable choices in the stock market. Our StockRank and factor investing toolbox unlocks institutional-quality insights into thousands of global stocks. Voted “Best Investment Research Tools” and “Best Research Service” at the 2021 UK Investor Magazine awards.