Four red flags for the Angling Direct (LON:ANG) share price

.jpg)


Accounting errors often entail a swift and severe downgrade from the market. What most investors don’t realise is that there are algorithmic ways to check the credibility of company earnings - and one of them is called the Beneish M-Score. In this article I’m going to explain how it works by looking at Angling Direct (LON:ANG) as an example.
About Angling Direct (LON:ANG)
Angling Direct is a speculative, micro cap in the Internet Services industry.
In terms of price performance, the Angling Direct share price has seen 1-year relative strength against the FTSE All-Share index of -33.9%.
When it comes to earnings, analysts are currently forecasting that Angling Direct's earnings per share will grow by % in the current financial year.
While those figures sound promising, the Beneish M-Score - which I’ll explain shortly - shows that there are areas in Angling Direct's accounts that might be worth closer investigation.
How the Beneish M-Score works
Professor Beneish’s M-Score looks at the year-on-year change in eight different ratios that can be worked out from a company’s financial statements. It looks for these red flags:
- Inflated revenues
- Declining gross margins
- Capitalised and deferred costs
- Excessive sales growth
- Lengthening depreciation periods
- Rising sales expenses
- Increasing leverage
- Higher accruals
Ideally, you and I would want our stocks to be passing these checks with ease. But when a company fails one or more of them, it’s time to dig deeper into the accounts to find out why.
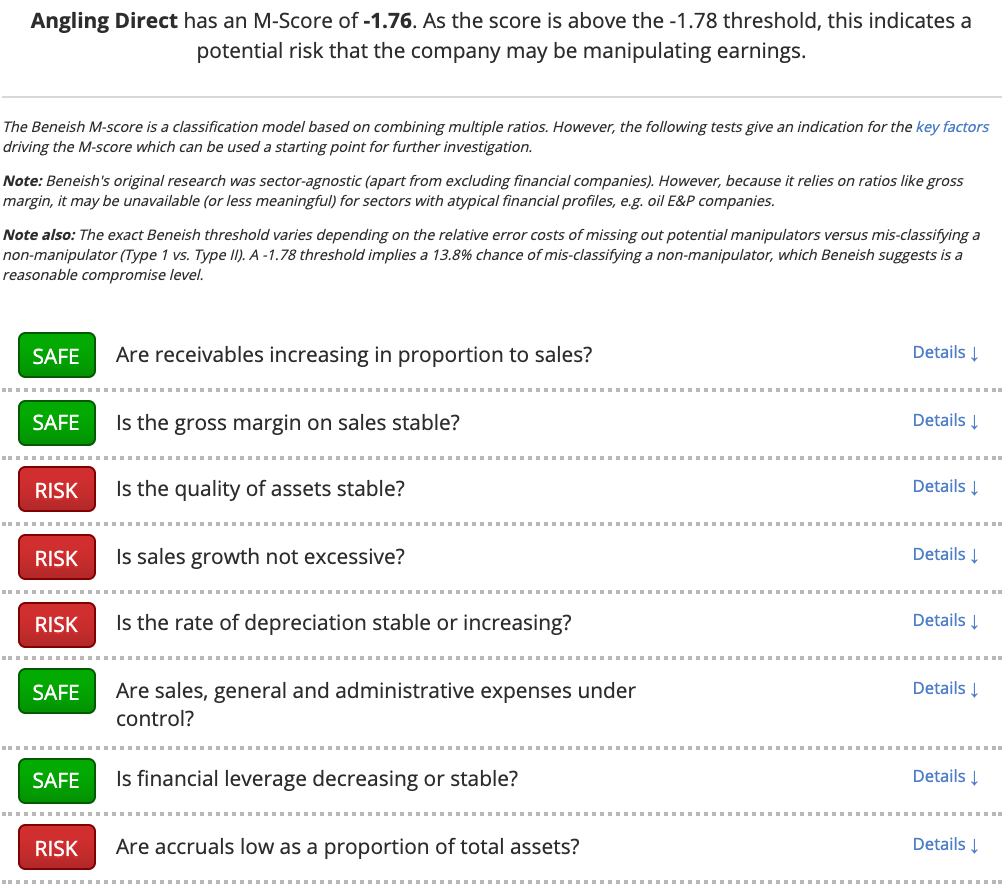
Are there accounting risks at Angling Direct?
Here is a graphic that shows how Angling Direct stacks up against the M-Score checklist and highlights areas to investigate.
Next Steps
To find more stocks like Angling Direct, you'll need to equip yourself with professional-grade data and screening tools to pinpoint the highest quality companies in the market. This kind of information has traditionally been closely guarded by professional fund managers. But our team of financial analysts have carefully constructed this screen - which gives you everything you need.
In less than a minute, you can be exploring a list of stocks with the very strongest financial ratios in the market. You'll be joining us on a journey towards owning the very best quality stocks possible. So what are you waiting for? Come and get started for free.
About us
Stockopedia helps individual investors make confident, profitable choices in the stock market. Our StockRank and factor investing toolbox unlocks institutional-quality insights into thousands of global stocks. Voted “Best Investment Research Tools” and “Best Research Service” at the 2021 UK Investor Magazine awards.