Why you need to look at Nufarm's (ASX:NUF) Piotroski F-Score

.jpg)


Nufarm (ASX:NUF) has been struggling recently, as you can see from its share price chart:
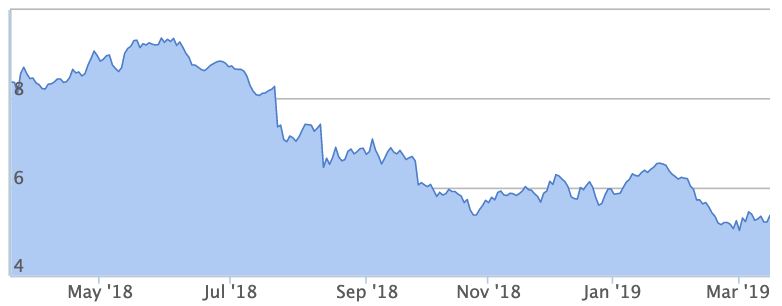
The company develops, manufactures, and sells herbicides and related products to crop producers. The company has been struggling recently, with profits taking a hit. For the fiscal year ended 31 July 2018, Nufarm Limited revenues increased 6% to A$3.31B but registered a net loss of A$26.4M.
Unfortunately, applying the Piotroski F-Score to this mid-cap doesn't do much to dispell these concerns... We'll get into this later, but first a quick refresher on what the F-Score means.
The Piotroski F-Score: one indicator to rule them all?
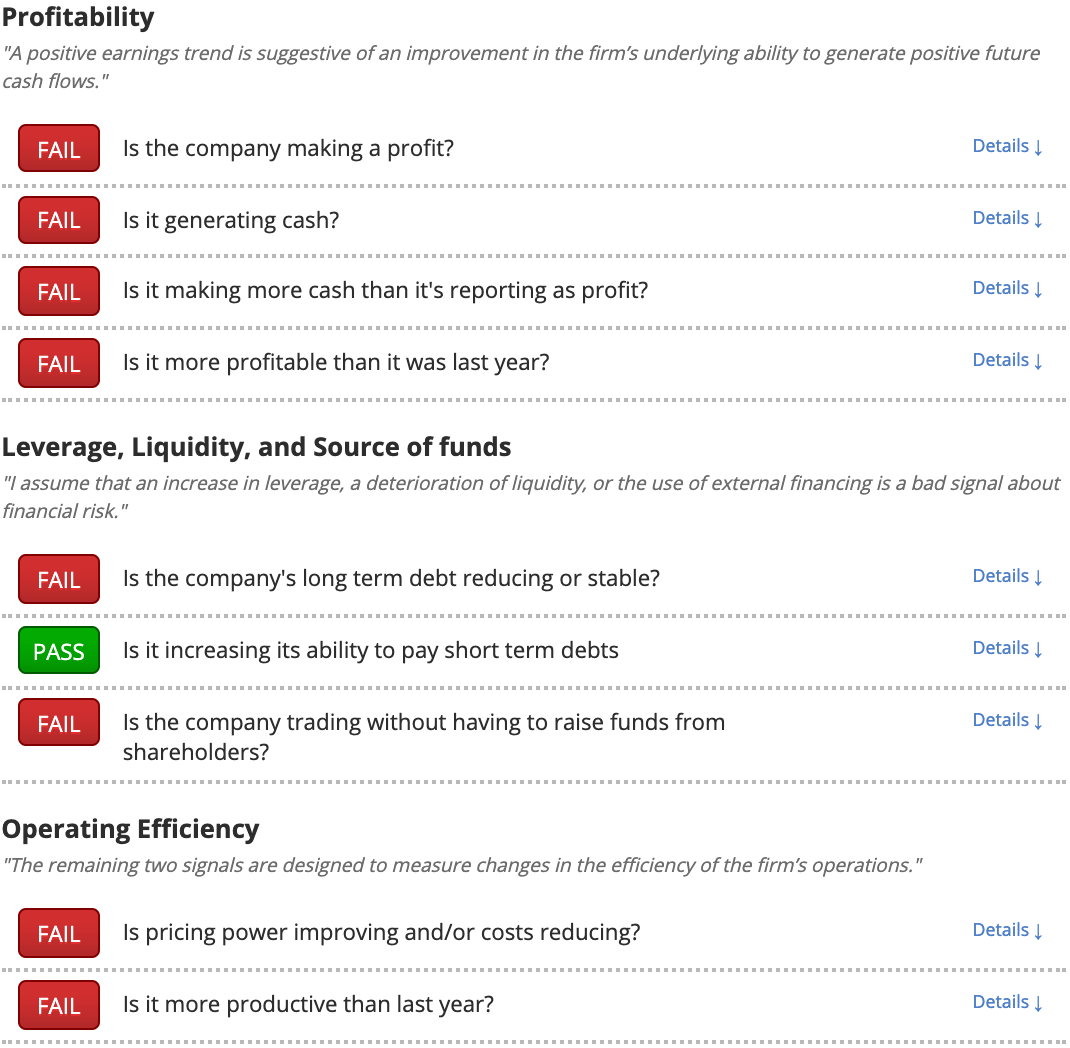
The Piotroski F-Score is a nine-strong checklist split up into three sections, each looking at a different part of a company's financial situation. What makes it so useful is that, unlike most ratios, the F-Score looks more deeply into the direction in which a company’s financial health is moving.
Stanford Finance Professor Joseph Piotroski wanted to sort the wheat from the chaff. After settling on the F-Score, he produced some astonishing results that showed high F-Score stocks should be sought out and low F-Score stocks should be avoided.
Why the F-Score does not like Nufarm (ASX:NUF)
Piotroski found that weak stocks with an F-Score of 2 or less are five times more likely to either go bankrupt or delist due to financial problems. Working our way through Piotroski's checklist, we can see that Nufarm gets a very concerning F-Score of 1 out of a possible 9. Food for thought for anyone looking to hold onto their money. We can see which areas of the checklist Nufarm fails in the graphic below:
Fortify your portfolio with simple, effective tools
The problem areas for Nufarm identified here can be explored in more depth on Stockopedia's research platform. All the best investors have stringent due diligence processes that reduce the chances of them suffering big losses, so why not take a leaf out of their book?
Simple tools can help us better measure and understand the risks we take. That's why the Stockopedia team has been busy building new ways of understanding investment risks and company characteristics. In this webinar, we talk about two or our most popular innovations: StockRank Styles and RiskRatings. These indicators transform a ton of vital financial information into intuitive classifications, allowing you to get an instant feel for any company on any market - sign up for a free trial to see how your stocks stack up.
About us
Stockopedia helps individual investors make confident, profitable choices in the stock market. Our StockRank and factor investing toolbox unlocks institutional-quality insights into thousands of global stocks. Voted “Best Investment Research Tools” and “Best Research Service” at the 2021 UK Investor Magazine awards.