SIF Folio Q1 25 update: a tough start to the year

It’s been a tough start to the year for my rules-based Stock in Focus model portfolio, which has lagged the market so far in 2025.
The UK market as a whole has been lifted by big gains for some of the largest constituents of the FTSE 100, which is a market-cap weighted index:

However, these strong performances haven’t been echoed in all parts of the market and the evenly-weighted all-cap SIF portfolio has underperformed the market so far this year.
SIF Q1 25 performance review
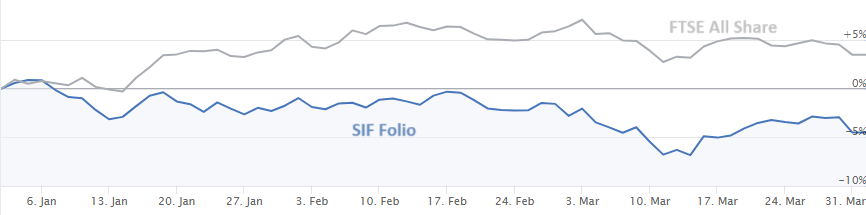
The value of the portfolio fell by 4.5% during the first quarter, compared to a 3.5% rise for the FTSE All Share index:
The portfolio’s performance since inception remains well above the market average, although the gap has narrowed a little this year::
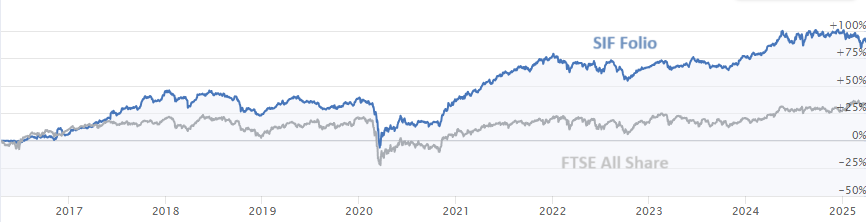
My sums suggest the portfolio has generated an annualised return of 7.3% in the nine years since its inception in 2016, excluding dividends.
SIF Folio - Income focus: in my 2024 review at the start of January I discussed a change in the portfolio’s remit to focus more heavily on income.
Only a handful of portfolio stocks went ex-dividend during the first quarter, so the income generated so far under this new regime has been minimal (about £6.5k, or 0.3% of the portfolio’s opening value).
However, the shares in the portfolio now have an average dividend yield of 5.3% and I expect dividend income to have a much greater impact over time.
In my half-year update at the start of July, I will explain how I’ll report income performance and discuss whether I’ve decided to extend the portfolio’s default holding period to better reflect its focus on income (and avoid too many missed dividends).
SIF portfolio changes in Q1
I added six new stocks to SIF and sold four during the first quarter of 2025.
This left me with 18 positions, up from 16 at the end of 2024. This is slightly above my target of 16 holdings, but so far the portfolio’s cash position has proved sufficient to maintain this size portfolio.

Given the new focus on income, I’m happy to let the portfolio expand to a maximum of 20 positions. To try and ensure SIF doesn’t run short of virtual cash, I’m going to reduce standard position size from £90k to £80k for the second quarter, in line with my normal policy of reviewing this quarterly.
Here’s a snapshot of the SIF portfolio after markets closed on 31 March 2025:

Stocks sold in Q1
I sell shares from SIF by following a set of rules, not by making a discretionary decision.
After an initial holding period of nine months, stocks must pass all of the rules in my selling screen in order to stay in the portfolio. In other words, they must appear in the results of the screen.
Stocks will also be sold if they fall more than 25% below my purchase price or issue a profit warning.
Here’s a review of the stocks I sold during the second quarter, including the profit or loss achieved on each holding.
Luceco (LON:LUCE)
Shares in wiring accessory and electrical equipment manufacturer Luceco are trading broadly flat on one year ago. Unfortunately the timing of SIF’s entry and exit did not work out well and the position returned a loss:

The company’s performance seems to have been fine last year, if unspectacular. Graham reviewed the recent results here and the StockRanks also take a positive view:

Perhaps it’s worth a closer look.
SIF’s position was closed after nine months as Luceco failed two of my momentum rules, with negative 1y relative strength and a share price below the 200-day moving average.
- Bought: 156p on 16 Apr 24
- Sold: 142p on 28 Jan 25
- Income return: 1.1%
- Total return: -8.2%
Harbour Energy (LON:HBR)
North Sea oil and gas producers are largely out of favour with investors and trade on bargain valuations. Time will tell whether they are as cheap as they seem, or if the market’s collective wisdom is highlighting risks not yet widely recognised.
Harbour exited the portfolio after nine months, triggering my 25% stop-loss rule at the same time. The shares failed many of my momentum rules and are now also styled as a Value Trap by the Stocko algorithms:

Mark looked at Harbour’s 2024 results and took a neutral view, highlighting that the company’s impressive free cash flow is heavily dependent on the oil price.
- Bought: 322p on 21 May 24
- Sold: 231p on 25 Feb 25
- Income return: 3.1%
- Total return: -25.6%
Morgan Advanced Materials (LON:MGAM)
This FTSE 250 industrial group issued a profit warning in late February, triggering my rule to sell on a profit warning.
Graham covered the news here, downgrading his view to neutral in recognition of the risk that the downtrend could continue.

While selling crystallised another uncomfortable loss, geopolitical risks such as tariffs and sluggish economic growth do not seem to support a very bullish view at the moment. On balance, I’m happy to be out.

- Bought: 310p on 20 Aug 24
- Sold: 215p on 4 Mar 25
- Income return: 1.7%
- Total return: -29.4%
XPS Pensions (LON:XPS)
This pension consultancy was the only profitable sale from SIF during the first quarter. It’s been a strong performer over the last couple of years:

The shares show terrific trend clarity and XPS’s High Flyer status suggest to me that it could still have the potential to deliver attractive further growth:

I would argue the valuation on a forward P/E of 19 may not be expensive, if quality metrics can be maintained:

However, forecasts for slowing earnings growth mean that XPS’s rolling PEG ratio has risen sharply to 2.9, from just 0.7 when I added the shares in June 2024:

In fairness, earnings estimates have been trending higher. It’s possible that further upgrades will reduce the PEG ratio to a more appealing level as the year progresses.

However, as things were in March, XPS failed my screening rules at the end of its default nine-month holding period, triggering a sale.
- Bought: 299p on 28 Jun 24
- Sold: 374p on 25 Mar 25
- Income return: 3.6%
- Total return: +28.1%
New stocks added in Q1
I added the following companies to SIF during the first quarter, selecting from shares that qualified for my buying screen.
International Personal Finance (LON:IPF)
This non-prime lender operates in markets including Poland and Mexico and is currently one of the higher-ranked stocks on the UK market:

Niche lenders always carry some risk, perhaps especially in this sector, which can attract regulatory intervention.
However, Graham gave IPF’s results a favourable review in February and I agree that the current valuation metrics look very reasonable for a business generating double-digit returns on equity:

Broker estimates were upgraded following the recent results, although it’s worth remembering that forecasts remain lower than they were a year ago:

- I added IPF to SIF at 132p on 7 Jan 25.
Bakkavor (LON:BAKK)
This little-known FTSE 250 ready-meal producer qualified for my screen in January. At the time, my hope was that Bakkavor would deliver modest growth and a safe 5% dividend yield.
However, it’s since become public that FTSE 250 peer Greencore is trying to acquire Bakkavor and has made two offers so far, both of which have been rejected.
The higher offer reported in the RNS was for 85p in cash and 0.523 Greencore shares for each BAKK share. That’s equivalent to 178p per BAKK share at the time of writing.
This takeover interest has prompted a nice share price rally, but it’s important to note nothing has been agreed yet. Greencore’s interest may now fizzle out – it has until 11 April to make a firm offer:

Bakkavor’s full-year results in March seemed reassuring enough to me and Stockopedia’s algorithms view the business as a Super Stock.

It’s worth remembering that Bakkavor is still controlled by the Icelandic brothers who founded the business. They will have an absolute say in whether any bid goes through, especially if their views are aligned with those of the largest outside shareholder (which I assume they are):

- I added BAKK to SIF at 132p on 14 Jan 25.
IG group (LON:IGG)
Financial trading platform IG Group is a long-standing holding in my main personal portfolio and has now joined SIF as well.
We cover IG and its UK peers regularly in the daily report, most recently here.
IG’s recent revenue update confirmed that the company remained confident of meeting market expectations for the year ending 31 May. I think the shares look fairly priced and could deliver attractive upside.
In the interests of balance, as a long-term holder I do have some concerns about the company’s creeping loss of market share in its core business and the seeming reliance on acquisitions to address this, rather than internal innovation.
However, I respect the group’s track record, high profitability and strong cash generation.

The StockRanks have a favourable view of this business too, which I would not argue with:

- I added IGG to SIF at 1,011p on 4 Feb 25.
Kier (LON:KIE)
Construction group Kier qualified for my buying screen and was added to SIF in February. If I’m honest, I’m already regretting this decision. With one or two honourable exceptions, this is a sector I generally avoid due to its slim margins and accident-prone nature.
Kier’s interim results for the six months to 31 December were greeted with a share price plunge. No surprise – H1 adjusted earnings were just 41% of full-year consensus, implying a substantial H2 weighting would be needed to meet expectations.

However, management remain adamant that full-year expectations are unchanged and broker consensus estimates have supported this view so far:

If the company can deliver on FY25 and FY26 forecasts, I think Kier shares could be attractively priced. My confidence isn’t high, but I do not have any legitimate reason to sell, based on SIF’s rule framework.
For now, my fingers are crossed and Kier remains in SIF.
- I added KIE to SIF at 154p on 18 Feb 25.
PayPoint (LON:PAY)
PayPoint is a stock I’ve held in SIF before. I think it’s an interesting – albeit complex – business. However, while there are many moving parts, the group’s cash generation and strong profitability always appears genuine, by my analysis.

The shares have made a weak start to the year, but Stockopedia’s algorithms score the business highly:

Current consensus forecasts suggest PayPoint could deliver earnings growth of around 10% over the coming year:

With the stock trading on a P/E of eight and offering a 6% dividend yield, I think there could be some value here.
You can read our latest daily report coverage of this business here, when Graham also took a positive view on PayPoint.
- I added PAY to SIF at 619p on 11 Mar 25.
Inchcape (LON:INCH)
I have something of a soft spot for well-run distribution businesses. They can be cash generative and deliver attractive returns on investment.
I think automotive group Inchcape could fall into this category, although I accept the 10-year share chart tells a more inconclusive story:

Inchape effectively outsources car manufacturers’ in-country operations in regions where the manufacturers don’t have a direct presence.
I imagine there might be some indirect disruption to the business from looming US tariffs, but as Inchcape doesn’t operate in North America, I don’t think this should be such a big concern.
Recent full-year results showed strong cash conversion from profits and a useful reduction in leverage. Inchcape boasts strong quality metrics, despite the inherent low margins of its business model:

The shares also look reasonably priced to me at current levels, assuming there are no drastic changes to current expectations:

- I added INCH to SIF at 717p on 18 Mar 25.
Final thoughts: attractive metrics?
The first quarter of 2025 turned out to be a relatively volatile time. Various flavours of geopolitical and macroeconomic uncertainty mean it is perhaps harder than usual to take a view on the outlook for the remainder of the year.
However, my feeling that collectively at least, SIF shares look reasonably valued with a positive outlook at the moment.
The table below is a new reporting tool I’m planning to update each quarter. Aggregating key metrics for a portfolio is an approach I find useful as a way of monitoring whether I’m staying within my remit:
Period/Portfolio average | P/E rolling 1y | Div yield rolling 1y | PEG rolling | Cash weighting |
Q1 2025 | 9.7 | 5.3 | 1.0 | 13% |
Uncertainty is an essential part of stock market investing.
As always, I plan to stick to my rules and continue following the system during the months ahead.
I’ll report back here at the start of July on performance during the second quarter of 2025.
Disclosure: Roland owns all of the shares listed in the SIF portfolio except Cairn Homes and Marks & Spencer Group.
Disclaimer
This is not financial advice. Our content is intended to be used and must be used for information and education purposes only. Please read our disclaimer and terms and conditions to understand our obligations.

15 comments
Thanks Roland,
I had forgotten about the equal weighting
Hi Roland - I'll be intrigued to observe how you report performance going forward here - especially as you tilt more towards income.
Stocko offers no total return functionality - they don't even offer the total return versions of the main indices.
Using average yields is full of pitfalls - dividends don't get paid evenly throughout the year and there are large differences between interim and final dividends, whilst the aggregate fwd yield estimates on Stocko often struggle with the stocks that regularly pay special divis. Adding a stock and assuming you earn the annual yield on a pro-rata basis isn't going to work.
It is not just the amount of dividends that matter but also when they are paid, and then how you re-invest the proceeds on the payment date. Clearly a large divi reinvested during a market dip has a bigger impact on subsequent performance.
You could unitise the portfolio to track performance at the aggregate cashflow level, but that won't help you attribute performance to the component stocks, nor will it help you with the benchmark.
The alternative is of course to track the actual dividends received together with their payment dates and do the performance calculation properly, but you will need to maintain a notional cash balance and deal with the reinvestment transactions. It is an awful lot of work if you don't actually hold some of the stocks and have a historic cash transaction record to remind you.
So that I can maintain accurate performance records at the single stock level I currently maintain dividend payment histories for about 200 stocks (because some of my portfolios were constructed from higher-yielding equities/trusts/ETFs as proxies for fixed income during the zero rate years). I can't deny it is a lot of work, but you end up having to do most of it for tax return purposes anyway - once you get into the delights of foreign income, double taxation agreements, excess reportable income, PIDs and acquired/disposed accrued income on gilts you are pretty much there whether you like it or not.
Any clever solution that doesn't involve paying up for Sharesight (or similar, I'm aware of sharescope's functionality here) is something I'd love to hear about.
There is another service that is not Sharesight that can track the dividend for you in your portfolio , but you have to pay for that too, which it seems you don't want to do.
I did mention sharescope at the end....?
It is not an aversion to paying - it is simply that I've not found anything that reduces the workload sufficiently, in that you end up having to go through your income items line by line again for tax purposes anyway (so just getting the dividend payment amounts & dates is just the start). Anything I pay for has to be much, much better than sucking up the CSV files direct from the platforms.
I hold quite a few overseas stocks in tax-exposed vehicles so I am recording local currency, the FX rates for each dividend payment date (which have to match the platform for ISAs), any fees that apply to ADR/GDRs, the tax jursidiction for double-taxation relief, the withholding tax rate applied (differs for SIPPs in some cases, dependent on the jurisdiction) etc etc.
It all ends up in a very big PowerQuery database that holds my full transaction records for several decades, so I can calculate the IRR of any holding, including divis, over any period in any portfolio (or multiple portfolios given the utility of bed & spouse!). I import pricefeeds from multiple providers & i track my CGT/dividend tax exposure as the year progresses.
Like yourself, probably, I had full access to a Bloomberg & various risk & performance attribution platforms for much of my career so I am aware of what is possible, but the retail platform APIs do not yet have the data granularity that is needed (or at least mine don't - I've not looked at interactive brokers too closely as they don't do SIPPs).
Ah sorry I missed that bit. I feel your pain, although personally I have avoided all the hassle of FX & withholding tax etc. by using funds for overseas exposure. You could always have a look at the following, although it would still require manual inputs and I guess would take quite a bit of effort to import all your things into it. Portfolio Performance
I will look into that link - very interesting & hadn't come across it before.
The advantage of single stocks over funds is that you have much greater
control over your CGT exposure - strategically crystallising loss
positions can be very useful.
Hi Roland,
Am following the SIF portfolio with interest though as it is a 'fantasy' portfolio with no money at stake (!) I just follow the rules with minimum further research (yours is always excellent). My version of your portfolio has 11 stocks out of the 18 you hold plus another 9 to give a full allocation of 20. One question though - you still hold Cairn Homes (LON:CRN) in the SIF portfolio but at the last monthly review it does not appear on your Sell screen. It has been in the portfolio way longer than 9 months so on this basis should it have been sold?
Hi ACounsell,
Re. Cairn Homes (LON:CRN) - one characteristic of using screens is that shares sometimes slip in and out repeatedly by the narrowest of margins. When I checked Cairn on 25/3 (Tuesdays are when I make changes to SIF) my notes tell me it did appear in my sell screen results and also qualified for the buy screen.
I suspect it may drop out at the end of this month - as you say it no longer qualifies due to the recent share price falls.
Roland
Hi Roland,
You say you hold for a minimum of 9 months then re-evaluate. If a share hit -25% or issues a profit warning, do you still hold for the 9 months, or is it gone on the day of the event.
Hi GloucesterBob,
If a share issues a profit warning or suffers a drawdown of more than 25% from my cost price, I'll normally sell at my next weekly review of the portfolio.
Roland
Hi Roland
Regarding your new tool
. Can you give us an example of how you calculate the averages
Hi,
These averages are just a simple average of all the values for the portfolio. So for example, summing all the forecast dividend yields and then dividing by the number of positions.
As each position is equally-weighted when added I think it should be a reasonably accurate estimate.
Hope this helps,
Roland
Thanks Roland, very interesting to read. When you say "The value of the portfolio fell by 4.5% during the third quarter, compared to a 3.5% rise for the FTSE All Share index" what was your comparative performance over this first quarter? Apologies if I've missed that figure.
Hi Brucie5,
I'm afraid this was a typo - thanks for highlighting it. I've now corrected it to read first quarter.
Roland
Great article Roland, as always.