Small Cap Value Report (11 Mar 2015) - BOO, LRM, MWG, CAU, RST

Good morning!
Boohoo.Com (LON:BOO)
Share price: 26.75p
No. shares: 1,123.1m
Market Cap: £300.4m
(at the time of writing I hold a long position in this share)
Trading update - today's update is for the two months to 28 Feb 2015, completing the year ended 28 Feb 2015. BooHoo is a fashion etailer, targeting teens & young adults, at the affordable end of the market. They operate in the UK, but also internationally. The company floated at the peak of the small caps market in Mar 2014, and the share price has been falling ever since! Note that it opened at a big premium to the 50p price where about half the shares were sold by management, who trousered several hundred million quid in the process. Very nice for them, but not so nice for the buyers of those shares, who overpaid, because growth expectations were much too high.
Growth has slowed, but is still very respectable, and of course is all organic too. Therefore in my view the gloom surrounding the shares is presenting us with a buying opportunity, as disappointed Institutions who bought into the IPO have been selling. Yet if you ignore the original excessive valuation, and just focus on things as they are now, my view is that this is the only sensibly-priced online retailer in the UK (the others are all ridiculously over-priced still in my view). BooHoo is also the most profitable, in terms of profit margin as a percentage of turnover. So you could argue that it's the cheapest, yet the highest quality (Asos is bigger in absolute terms, but has a lower profit margin).
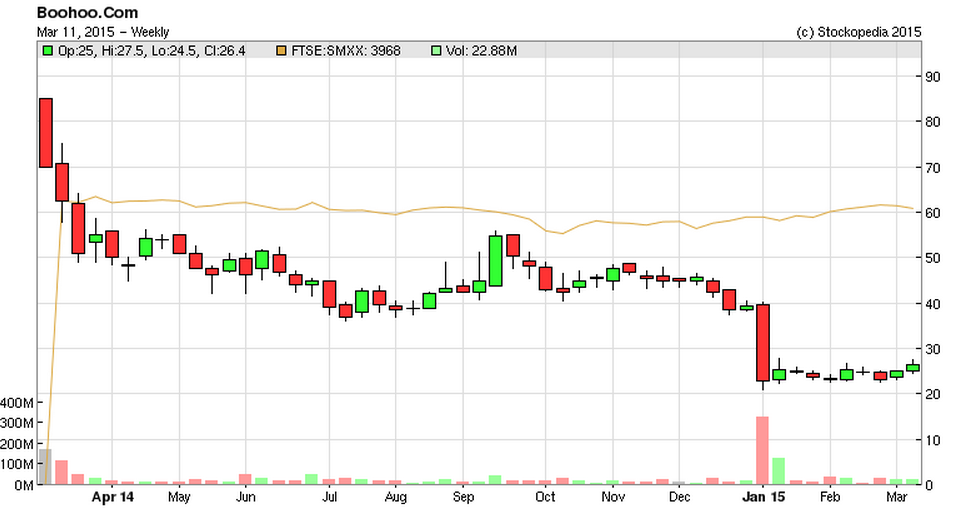
Here is the table from today's update showing sales growth for the two months, and the year to 28 Feb 2015;

Points to note;
- The rate of sales growth is slowing, but is still very respectable at 22% for the 2 months
- UK is 67.5%, Europe 12.9%, and Rest of World 19.6% of sales for the y/e 28 Feb 2015
- Price reductions in Rest of World has rejuvenated sales growth (up to 56% in the most recent 2 months)
- Exchange rates have blunted sales growth a little ("CER" is constant exchange rate)
- £139.9m sales has come in slightly below the latest forecast of £142.7m
- The gross profit margin of 61% for the year is very strong
- Net cash of £54m at the year end is about 18% of the current market cap (4.8p per share)
- The company has today announced a share buyback of up to 10% of its shares, to utilise the surplus cash, which will of course enhance EPS
- EBITDA margin is in line with expectations, at 10% of turnover, so about £14m EBITDA for the year
Some points I jotted down during this morning's conference call;
- Positive current trading comments - trading well in March 2015
- Accelerating marketing spend to c.17-18% of turnover in the short term, to boost new spring/summer ranges, but this will fall back later
- "Really good response" to current marketing campaign - reached #1 in UK on Twitter, and #5 globally on 1 March
- "Good surge" in sales when blogger Zoella reviewed the latest range on Sunday
- Very pleased with acceleration of sales in Rest of World
- Strategy is to focus on key markets
- Warehouse extension opening in April 2015
- Euro weakness likely to trim margins slightly in 2015
Valuation - people seem to think BooHoo is terribly expensive, but actually when you consider its excellent organic growth, and high margins, it really isn't (in my opinion). Consider the growth so far, and you can see this is an exceptional business;
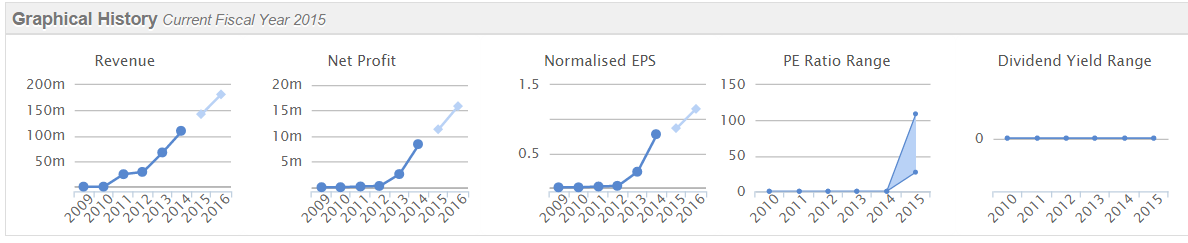
EPS is forecast at 0.87p for the y/e 28 Feb 2015, and the company seems to be saying today it's in line, although no specific reference is made to EPS. That puts the shares on a PER of 30.7 times. OK, not exactly a bargain, granted! But strip out the cash, and you're actually paying 21.9p for the business (at a 26.75p share price, since 18% of the market cap is net cash). That brings the PER down to 25.2. Still pricey perhaps, but that is now the historic rating. So looking at this year's forecast, EPS of 1.15p looks reasonable, and that translates into a PER of 19.0 times (using the ex-cash share price of 21.9p again).
I suggest that an ex-cash rating of 19 times is very reasonable for a business that is still growing rapidly, and seems to have now got its pricing right, and is thus seeing an acceleration in global sales again. Jim Slater's PEG ratio says that if the growth rate exceeds the PER, then the stock is worth looking at. Here we have turnover growth still above 20%, so the PEG looks to be under 1.
Bear in mind also that during its growth phase, the company is reinvesting extra profit into marketing, to increase customer numbers. So they can really choose a profit figure within quite a wide range, depending on how aggressive they want to be in growth.
Business model - probably the main reason I am so bullish on BooHoo is because in a former life I was the FD for a ladieswear chain. We used Manchester based companies called Pinstripe and Jogo as two of our biggest suppliers. The people behind those companies set up BooHoo, so they are very experienced rag traders, with extensive supplier contacts in the UK and abroad. People say there are no barriers to entry with online fashion, but there are a lot more than you might think. It's all about getting the product & the supply chain right. Many retailers find that very difficult, so smaller retailers tend to use intermediary companies (like the ones I mentioned) to source stock. So by now selling direct to the public, BooHoo has probably got the most efficient supply chain possible, and makes fantastic gross margins - they are effectively trousering not only the retailer's margin (without the costs of a chain of shops), in addition to the wholesaler's margin. Thus the 61% gross margin achieved is really excellent. This allows BooHoo to spend heavily on marketing - which smaller, start-up type etailers cannot afford to do, to this extent. This should create a virtuous circle for BooHoo - as it gets bigger, it can afford to spend more & more on marketing.
My opinion - I am told that BooHoo and a rival site called MissGuided are dominant in online fashion for youth. It's highly competitive of course, as there are also all the High Street chains to compete with, who nearly all have an online presence too.
As things stand today, with BOO shares on an ex-cash valuation of 19 times current year forecast EPS, this looks good value to me - providing that growth can be maintained of course. Given the size of international markets, and the progress made so far, then that rating could go through the roof if international growth really gets going.
Why is ASOS (LON:ASC) rated at nearly 69 times forecast earnings? If the market is excited about growth there, despite it having slowed considerably, then surely it is overlooking the growth potential at BOO? Also, Asos talks about improving profit margins, whereas BOO is already delivering superior margins, and thowing off surplus cashflow which will enable it to buy back 10% of its own shares, and still have plenty of cash left over.
If you believe the growth will continue at BOO, then I think this could be a very good entry point. DYOR as usual, of course!
Lombard Risk Management (LON:LRM)
Share price: 12.9p
No. shares: 263.9m
Market Cap: £34.0m
Profit warning - the company admits today that it will not meet market forecasts, as H2 has fallen short (as is so often the case when companies rely on a strong H2);
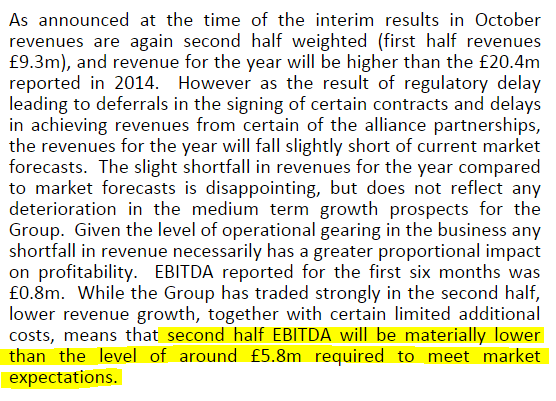
(please also note that I've finally got the hang of the highlighter tool!)
My opinion - the EBITDA performance figures that this company reports are completely meaningless, because they capitalise a large chunk of their payroll into intangible assets. So the valuation is far higher than it should be, in my opinion. Sooner or later the penny will drop with investors that this company doesn't actually make any money - that's why it only pays a tiny dividend.
Modern Water (LON:MWG)
Share price: 17.75p
No. shares: 79.5m
Market Cap: £14.1m
Final results - for calendar 2014 look really bad. Turnover fell to £2.8m, and it made an EBITDA loss of £4.5m. There was also another £12.8m in exceptional costs, but that looks mainly goodwill write-offs, so non-cash. Or at least, non-cash at the moment, but originally that would have been cash that went out of the door on acquisitions some time ago.
My opinion - as things stand, this is clearly not a viable business. It seems to have burned through approx. £5m in cash every year since 2008. There's just over a year's worth of cash left in the kitty, so if they don't deliver a much better performance in 2015, then I wonder if shareholders will be willing to flush away another load of cash in another fundraising?
It's going on my bargepole list I'm afraid.
Centaur Media (LON:CAU)
Share price: 66p
No. shares: 143.7m
Market Cap: £94.8m
Results for the 18 month period to 31 Dec 2014 are issued today. Comparatives for calendar 2014 vs 2013 are also given, which are more meaningful for analysis purposes. The results look reasonable - turnover is down 2%, but adjusted operating profit is up 2% to £10.2m (for the 12 months ending 31 Dec 2014).
Divis - are good, with a forecast yield of about 4.6%.
Balance Sheet - is weak, and it fails my simple tests, as follows;
Current ratio is low at 0.76. The main reason is a large deferred income creditor, so the company has received money up-front from subscribers to its magazines, but has already spent that money in advance. For this type of business, I wouldn't normally be comfortable with a current ratio below 1.0.
Net assets of £86.8m becomes negative when you write off intangibles, at -£23.1m. I wouldn't normally invest in any company with negative net tangible assets.
My opinion - the weak balance sheet rules it out for me, but it looks a reasonably good business. Although it looks ex-growth, maybe even declining in the long term? So probably not one to get excited about.
Restore (LON:RST)
Share price: 260p
No. shares: 82.2m
Market Cap: £213.7m
Full year unaudited results for calendar 2014 are out today. They look good, but you have to bear in mind this group is making lots of acquisitions, which flatters the figures. I'm not convinced the shares deserve a premium rating, as there's not much sign of organic growth.
Net debt has risen to £30.9m at end 2014.
Dividends - are minimal, with a yield of 1%.
Balance Sheet - the trouble with companies which grow by repeated acquisition, is that the balance sheet gradually worsens as it fills up with more & more goodwill. In this case, Restore's balance sheet has turned negative for net tangible assets, of -£1.9m. Now you could argue that doesn't really matter, as it generates an increasing flow of earnings, a lot of which is based on recurring revenues.
Valuation - given the increased debt, and that growth is mainly coming from acquisitions, therefore the existing (mature) businesses probably shouldn't be on a PER of more than about 12, then I think it's looking a bit too expensive, on a fwd PER of 16.9;
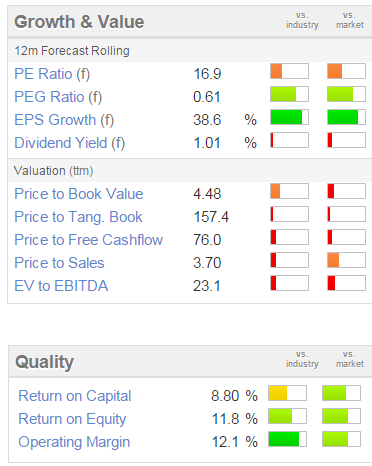
My opinion - it's too expensive for me.
All done for today.
Regards, Paul.
(of the companies mentioned today, Paul has a long position in BOO, and no short positions. A fund management company with which Paul is associated may also hold positions in companies mentioned)
Disclaimer
This is not financial advice. Our content is intended to be used and must be used for information and education purposes only. Please read our disclaimer and terms and conditions to understand our obligations.

25 comments
herbie47 - Underscored is absolutely right. When dealing with probabilties, exceptions don't prove anything.
pka - apologies for not updating my blog recently. Life has been busy and I've found it difficult to find the time to maintain it. Also, it takes me a while to get my thoughts into words, but I will try to a give an update shortly.
Phil - The MB strategy that I describe in my blog is a very simplistic. I don't rebalance. I buy and sell 100% positons and hold until the combined StockRank and Screen count drops below 90. However, the threshold may be too strict. For my real life portfolio I have dropped this to 80. It would be nice to do some more research to work out the optimal threshold. Unfortunately, would require a full daily history of StockRank and screen count data, which I don't think is available from Stockopedia. I am also a bit more sophisticated with my real life portfolio management. For example, I now topslice when positions reach specified allocation limits. This means I manage the downside risks, while still running winners.
Funnymoney - You asked about how the MB system will work in the crash or bear market. Frankly, without being able to backtest it, I don't really know. From what I can tell, when markets crash fear takes over and all logic flies out the window. My guess is that no stock picking approach is immune but I don't see why a high StockRank approach would perform worse than any other strategy.
IMHO the best way of preserving capital is to have an effective strategy for asset allocation. Stockmarkets usually crash when they are overvalued so you want to be moving out of stocks into cash or other assets as the market as a whole gets more expensive and then back into stocks as the market gets cheaper. John Kingman from UK Value Investor writes extensively about this: (e.g. http://www.ukvalueinvestor.com/2015/01/ftse-100-forecast-for-2015.html/).
I can't find the link but a while back John Kingman proposed an asset allocation system based on the Cyclically Adjusted P/E (or CAPE). He demonstrated that with this strategy one could achieve the same returns being 66% invested (on average) in stocks as being 100% invested, but with much less volatility. I have incorporated his ideas into my overall investment strategy. Indeed, I have come to the view asset allocation is just as important as having an effective strategy for buying and selling stocks.
The basic idea is that when the CAPE is 8 or under, you should be 100% invested in stocks and when it is over 32, you should be completely out of stocks because such a high CAPE means that the market is probably about to crash. At the moment, the CAPE for the UK FTSE is about 13, which translates to being "slightly cheap" and so I am about 80% invested in stocks.
This is where private investors have a massive advantage over managed funds, as most have strict rules on asset allocation. I am actually surprised that asset allocation is not written about more on Stockopedia because it really is very important.
One of the problems though is getting up to date data on the current CAPE. So Ed, if you are reading this, please consider adding this to make Stockopedia even better!
"when markets crash fear takes over and all logic flies out the window"
This is not just a logic/lack of rationality. This is about leverage and margin calls forcing sales. Bankruptcy and liquidity issues outside of the stock market may also force fire sales.
Yes 2014 was not a great year, esp. for small companies. Some larger companies did alright, housebuilders generally up about 30%, Ashtead did well if you bought around 820p, Carnival also if you bought on dip to around £21. Only small cos that did OK for me were INL and Trifast, although QPP has recovered, so has ASOS. One thing I noticed on some share charts is they don't look to scale, if you look at ASOS it does not look like it has gone up over 100% from the low. Also QPP does not look like 3.5x.
Im still having problems with the system, when I press Log In nothing happens, I can't reply to above posts but I can type here?
It will be interesting to see if Mark Slater talks about Restore (LON:RST) at the Mello Bloomberg event, as it's one of his largest holdings (2nd position in his growth fund)
MB,
I was just looking at your portfolio and noticed that none of your winners are 100%+. I notice that the trading rules force you to sell a stock when it's Stockrank drops below 90. I'm wondering if this prevents you from multi-bagging?
The powerhouse of my portfolio performance has been Sprue Aegis currently up 415%. When I bought Sprue it would have been a 90+ stock but as the market has come on board it's now has a stockrank of 72 mainly dragged back by the Value Rank.
In fact if you look at the old back tester to examine the constituents of the top decile since April 2013 (Markcap > £50m) there are six 100%+ stocks:
Renew Holdings (LON:RNWH) +204% StockRank now -> 64
JD Sports Fashion (LON:JD.) +162% StockRank now -> 96
4imprint (LON:FOUR) +114% StockRank now -> 87
Staffline (LON:STAF) +114% StockRank now -> 71
Jelf (LON:JLF) +111% StockRank now -> 90
Trinity Mirror (LON:TNI) +102% StockRank now -> 95
What I'm suggesting is that it's great to select high quality stocks however I'm wondering if the rebalancing strategy doesn't maximise the opportunity for the stock to reach it's full potential.
I'm not sure how the old backtest stocks are rebalanced? Maybe they aren't or perhaps it's quarterly or annually?
I assumed that you were following a quarterly rebalancing strategy but looking at your portfolio it seems that you are rebalancing each month. I'd be interested in your thoughts about this.
Thanks in advance
Phil
PhilH,
"if you look at the old back tester.." Can you tell me where this is please - I appear to have completely missed it.
Thanks
The new backtester is here: www.stockopedia.com/stockranks/performance/
Wow ! - another really useful feature of Stockopedia that I hadn't discovered. The graphs are pretty compelling on the effectiveness of StockRanks.
Hi Phil, I think you've probably got the "non-public" link to the original non-rebalanced backtester that I built. It was useful to test the 1 year results of the StockRanks but is less useful now as there is no rebalancing built in.
You are probably still using it as seeing the names and performances of each of the contributing stocks in each set is very useful - but it's very slow in the current back-tester to print these details so we've removed them from the live pages. I can though access the results myself and I hope we can add them to the site in due course as they are fascinating.
Looking at the annually rebalanced sets in the first year there were 7 stocks of StockRank 90+ that did 100%+ many of which you've mentioned, but in the second year as the market churned sideways there was only 1 - Victoria Group - which incidentally rocketed 554%. Just to bug Paul I'll also mention that Wincanton was the 4th best stock in the set returning 54%.
I think that the hit-rates are the most enlightening figures:
So even though the 2nd year has seen a serious sideways churn in the market, the 90+ StockRanks nudged ahead. In the top StockRank set, there was nearly as much downwards churn as there was upwards churn. The distribution of returns was high, averaging plus or minus 20% across all the stocks.
Understanding these kinds of distributions and statistics is vital for anyone using the StockRanks as part of portfolio selections. A 98/100 ranked stock falling or profit warning is entirely to be expected - just as a 98/100 ranked stock surprising on the upside is to be expected. On average, we hope there to be more of the latter than the former as long as the past tendency for value & momentum stocks to outperform persist. The case for broad diversification is very clear.
2014 - A bad year for stockpickers? Famously 2014 was a year when active fund managers (and most private investors) completely failed to beat the market - only 14% of fund managers did - taken in that light I think the above StockRank results are quite good. As anyone can see from the StockRank performance charts... the low StockRank sets suffered terribly in 2014 and anyone mucking about in speculative areas of the market got horribly burned. I'm not sure why anyone bothers with these kinds of low ranked stocks... they are so often priced like lottery tickets with negative payoffs. The stock market can be thought of as a game of odds... aligning with higher probability bets is wise.
How important is it to multibag a single stock? Personally I don't think it's as important as most. I personally have come to side with Professor Robert Haugen who believed that instead of trying to buy the perfect stock (which can be very rare), you should synthesise it - by buying the perfect stock's attributes across a portfolio (good, cheap, improving etc). I elaborated on this idea in a previous article which was published just before we launched the ranks. Haugen has had a huge influence on my own investment philosophy - especially when it comes to constructing a portfolio - I can't recommend this book enough.
I think these days in tax-efficient wrappers, there's less cost to rebalancing... so one can trade a bit more frequently and rotate into the most optimal stocks according to the frequency that works best for your portfolio size. Buy and hold was perhaps better in pre-ISA, higher inflation, more stable periods.
Of course it's all a matter of personal choice - PhilH you take a very dedicated and attentive approach to your selections - so running winners and watching them carefully works extremely well... if someone doesn't have the time or inclination to do so then a more passive rebalancing approach can work too.
OK I'm rambling. Over and out.
Hi Ed,
Thanks for the clarification. I think the list of stocks in each bucket is really useful.
If it takes a long time to produce that information how about providing a link to each bucket so that they are only processed if I request them? Plus that way you'll only be searching for 10 or 20% of the stocks at a time?
With respect to Haugen ... I'm not attempting to select stocks that will multi-bag rather I'm attempting to select high quality stocks with upside ... however I want to do everything I can to get out the way to maximise the returns.
I also appreciate what you say about time poor portfolio management and that is a definite advantage of quant approach with quarterly rebalancing.
We like a bit of rambling!
Phil
There were a few exceptions to your speculative cos doing badly, in 2014 Fitbug went up over 800%. Concha also went up considerably over 2000% according to one report. Also Emerging Market Minerals was up 1300%. All are loss making. Not sure how these were rated on Stockopedia on 1.1.2014?
And were you able to identify in advance, which speculative loss making companies would boom and profit?
Mechanical Bull, I have read your blog about your portfolio (which is selected using Stockopedia's rankings and guru screens) with great interest in the past, but it hasn't been updated for several months now. I for one would welcome an update.
Well said MB. I personally would love to see all commentators here running a fantasy portfolio so we can see the performance of their approach. Less talk and more evidence please.
Warm regards
Phil
UWhile it is true that using Stockopedia Stockranks will not guarantee results for individual stocks this is not to say hat a system based on them doesn't work. There is any amount of academic research shows that it does. As a statistician I see it as quite wrong to focus an outliers and then think that the system doesn't work. Someone may smoke 2 packs a day and live to 90 - It doesn't disprove that smoking will shorten your life expectancy.
My view is that most investors would do best to use a simple set of rules that can be shown to have beaten the market over the long term and stick with them. Very clever and experienced investors may be able to do even better by applying subjective judgements but most of us will fail using that approach. The problem is how do we react when our judgements are wrong - what do we do?
Ive just taken a bath on LRM but I am not really concerned because I just have to remind myself of how high Stockranks have performed over the past 22 months. My SR based system has returned over 50% in that time and which would certainly be higher than your average amateur stockpicker. I have achieved this not because I have great understanding of balance sheets. I simply have a willingness to trust statistical evidence.
MB - I agree with your approach, but what are you going to to when we get another 2007-2009, early 1970s, 1929 etc.? If you look at the data from "What Works on Wall Street" there are times over the long term when the best simple systems go down by 65%. If you are unlucky enough to start at such a time it will take 8 or so years to get back to where you started. Stockranks began at a particularly fortuitous time, so extrapolation is risky.
I've never heard of Lombard Risk Management (LON:LRM) so had a look at the stock report and seen they had an overall stock rank of 98, which I found surprising. So I decided to have a look at their interims issued in October last year. I totally agree with Paul that their EBITDA performance is meaningless as their capitalising a large chunk of development costs which is inflating profits. Indeed when you look closely at the cash-flow statement their cash generation was really poor, and indeed it was favourable movements in working capital that flattered the net cash position.
The other red flag in hindsight was probably note 5 in the interims where they detailed accounting adjustments following a review by the Conduct Committee of the Financial Reporting Council. This details at length errors that had arisen in the application of the company's policy for the capitalisation and amortisation of product development costs for the previous two financial years.
Lombard Risk Management (LON:LRM) profit warning clearly demonstrates that quantitative approach of Stockopedia is not always reliable. This stock had a stock rank of 98, excellent financial health indicators and had passed 6 of the investment screens. Indeed, the only real negative flagged up by the Stockreport was the gearing level when including intangibles - caused by the factors you mention I assume. As you say DYOR !
I absolutely agree with your point, and was indeed going to make the same one, that I think a purely quantitative and mechanical style of investing won't work on its own. I think a manual check of the financials is always going to be required to ensure there are no hidden nasties!
imranawan,
I completely agree. For me, quantitative techniques are great for providing a shortlist of companies to research, but quantitative techniques only can get it completely wrong far too often to be reliable on their own. Chinese companies, and companies which rely on very aggressive accounting techniques (such as £LRM) can sail through quantitative models, but actually be a can of worms when you open them up & have a proper look at the numbers!
So I'm all for combining the two approaches - quantitative for creating the shortlist, then me manually digging into the numbers to pick out the remaining duds! And even then, unexpected things still go wrong, so no approach will get it right every time.
P.
Yep - ASOS is the big girl in the sector but as Paul says, Boohoo and MissGuided are very much "go to" sites for the fashionable female youth market, especially those who want somethign a little but different to the more "mainstream" ASOS.
Well, thats what my 24 year old daughter tells me (she's also a Buyer for a clothing retailer).
Hi Paul -
Lombard Risk Management (LON:LRM) I was very tempted to buy some shares this morning when the sp dropped some 20%. With a reported PE of around 8, my back of a fag packet calculations showed that a price of 12 - 12.5 would make the risk/ reward ratio attractive.
Until I read your comment about capitalisation of development costs.
These guys have been pretty aggressive in capitalising software development costs. Basically to the tune of around £4m - £5m a year, which pretty much wipes out the annual net profit. This teaches me once again to review the cashflow statements. Free Cash Flow over the past 2 years is negative if you subtract capitalisation of development costs.
Thank you for saving me from making a serious misjudgement.
Regards, Ram
Hi Ram
I agree that FCF is negative over the last two years, but only when you manually calculate this based on the accounts. It's interesting to note that the Stock report, shows that FCF per share is actually has improved over the last 3 years and is positive! I suspect this is due to the formula and calculation which FCF on the Stock report is underpinned by.
Best wishes,
Imran.
"I am told that BooHoo and a rival site called MissGuided are dominant in online fashion for youth." Are you forgetting ASOS? This has to my knowledge the vast %age of market share. It would be interesting to compare the numbers if anyone has them?
Hi rick,
ASOS is the biggest online fashion retailer, true, but it's more expensive than BooHoo, so a different target market really. BooHoo is firmly focused on 16-24 year old, mainly female, at very low price points. All own brand too. Whereas ASOS is a broader age range, higher prices, and other brands.
It's fascinating looking into how BooHoo are using video bloggers such as Zoella, to do some of their marketing. For example. Zoella did a professional photoshoot for BooHoo, posted it on her YouTube channel on 8 March, and in just 3 days since then, it has been viewed 1.28m times! And has got 120k thumbs up from viewers. Video bloggers such as Zoella have a fanatical fan base, and indeed BooHoo commented today that they saw "a good surge" on items Zoella showcased.
I think the online-only fashion companies are more on the ball with digital marketing, and these new ways to interact with potential customers, than the High Street retailers.
Also, as an investor, why would I be interested in paying 69 times earnings for Asos, when I can get BooHoo for about a third of that (less when you strip out the surplus cash)?
The only thing BooHoo/Zeus did wrong was to over-hype its growth potential at the time of the IPO. Now that expectations are more grounded, the shares look reasonably-priced to me. I think an opportunity has been created by IPO buyers selling in disgust, leaving behind a bargain for people like me who couldn't care less what the IPO price was.
P.