Stock In Focus: Inmarsat

When it comes to technology investments, timing is everything.
Investing in the right idea at the wrong time can do serious damage to your wealth. Satellite telecommunications provider Inmarsat undoubtedly falls into the good idea category, but is now the right time to buy?
Having taken a closer look at the numbers, my view is that despite a strong run, Inmarsat could yet deliver further gains for shareholders.
Speed advantage

Inmarsat was originally founded by the International Maritime Organization in 1979 to enable ships to remain in permanent contact with land while at sea.
Today, the firm is essentially a satellite mobile network operator. Inmarsat provides mobile voice and broadband services to the aviation industry, maritime sector and to organisations, including the US military, which operate in remote areas where no other coverage is available.
The firm’s maritime division is still its largest, accounting for $595.6m (49%) of revenue and more than half the firm’s profits in 2014. However, while the maritime division is likely to remain a valuable cash cow for the firm, its fastest-growing division is aviation.
In addition to in-flight safety, telemetry and navigation services, passenger use of mobile broadband and voice services is rising fast. Inmarsat’s aviation revenue rose by 37.7% to $101.1m last year. The division’s EBITDA margin of 86.3% made aviation the firm’s most profitable business, too.
Inmarsat is in the final stages of launching its 5th generation satellite broadband service, Global Xpress. Customers will be able to enjoy speeds of up to 50Mbps, anywhere in the air, on land or at sea. That’s better than most home broadband and should be a big draw for airlines, I’d imagine.
The firm expects this new service to deliver $500m of additional revenue by its fifth birthday. I think that this next generation network could be the catalyst needed to unlock a new round of growth for Inmarsat.
Quality - Good company at a fair price?
 For anyone who can remember when international direct dialling was new and a 56k modem was fast, Inmarsat’s services are deeply impressive. As you’d expect, they don’t come cheap.
Inmarsat’s StockRank of 87 is the result of high QualityRank (88) and MomentumRank (99). These high ranks in tandem with a low ValueRank (27) make this the classic profile of a High Flyer stock according to the Stockopedia taxonomy. It’s a good, improving stock at a seemingly pricey valuation.
Inmarsat’s 30% operating margin is backed by a Piotroski F-Score of 7 out of a possible 9. This indicates good, improving financial health across a range of measures including profitability, efficiency and liquidity.
The only real red flag is a rise in long-term debt, but this should start to fall now that the Global Xpress program is nearing completion.
Sales have risen by an average of 4.4% per year since 2009, which is good, if not spectacular. The average return on capital employed since 2009 is a solid 13.7%.
One of Inmarsat’s big advantages is its defensive moat. In addition to its advanced satellite networks, the firm has a strong technical reputation and a large, established customer base. Potential competitors face very high barriers to entry.
Value - expensive but a strong dividend yield
Of course, much of this quality is already reflected in Inmarsat’s valuation. With a ValueRank of 27, Inmarsat is not a stock for low P/E value investors. However, I don’t think the firm’s shares are quite as expensive as they look.
A forecast P/E of 31.3 is definitely a turn-off, but investors need to look further.
Inmarsat trades on a trailing price to free cash flow multiple of 19.3, according to Stockopedia. This is more attractive, especially when combined with the firm’s prospective yield of 3.5%.
Inmarsat’s dividend has risen by an average of 8% per year since 2009 and has increased every year since its flotation in 2005. The stock’s yield is also higher than both the Telecoms sector average of 3.3% and the FTSE 250 average of 2.3%.

Interestingly, Inmarsat qualified for the Stockopedia Large Cap Dividend Attraction screen at the start of May. This screen aims to identify firms with a strong track record of profit and dividend growth and an attractive price-to-cash flow valuation.
Indeed, it’s cash flow that helps make Inmarsat’s dividend so attractive. Last year’s cash flow statement shows free cash flow of $150m, excluding acquisitions and disposals but after interest payments.
That wasn’t quite enough to cover the 2014 dividend payout of $212.6m, but I think it was a decent effort for a firm in the middle of a $1.6bn investment program.
Dividend cover is expected to dip below 1 in 2015 and 2016, as the effects of a one-off revenue boost in 2014 fall out of the firm’s earnings.
However, capital expenditure fell by $175m to $405m in 2014, and is expected to remain below $500m in 2015. Spending should then fall to less than $400m in 2016 and 2017, according to the company. This should improve free cash flow and dividend cover.
Momentum - strong price and earnings trend
The long-term factors I’ve described above will help Inmarsat to deliver long-term returns for investors.
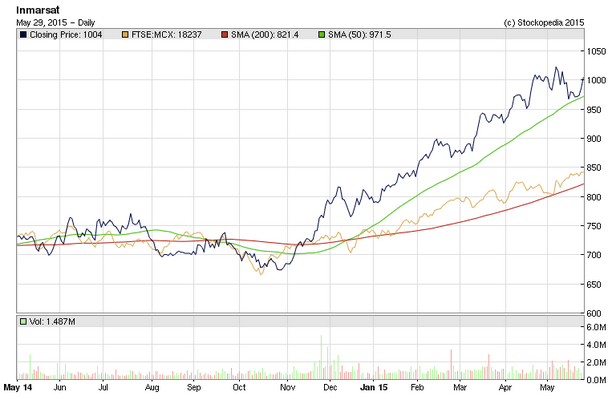
A medium-term factor in favour of the firm is its strong momentum. Inmarsat’s MomentumRank of 99 is the result of a combination of strong price and earnings momentum. The firm’s stock has risen by 24% so far this year, while the FTSE 250 has only managed 13%.
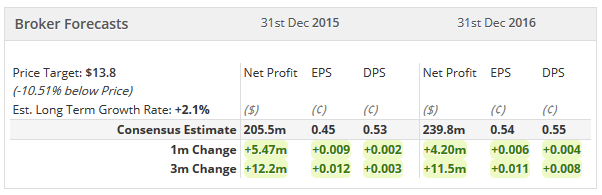
Earnings momentum is also encouraging. Consensus forecasts for Inmarsat’s 2015 earnings have risen from a low of $0.42 per share in January to $0.45 at present. 2015 forecasts have seen similar revisions.
Could things go wrong?
Inmarsat’s business isn’t without risk. The launch of its third Global Xpress satellite was scheduled for May but has been delayed indefinitely, after the preceding ILS launch failed and caused the total loss of another customer’s satellite.
Inmarsat’s launch will be delayed until the report into the failure is complete. However, in my view a more potent risk is that the same could have happened to Inmarsat, resulting in a much longer delay while a replacement satellite was built.
The firm says that the delay to the launch will have “a small negative effect on 2015 revenue and earnings”, but it cannot be more specific until the length of the launch delay is known. Global Xpress revenues are ramping up from the first two Global Xpress satellites, which now serve Asia, Europe and the Americas.
As yet, broker forecasts for 2015 or 2016 have not been downgraded:
Outlook
Inmarsat’s strong performance this year means that a certain amount of growth is already in the price. The shares have already pulled back a little over the last month.
Despite this, I think that rising global demand for mobile broadband could lead to a step-change in medium-term demand for Inmarsat’s services. I remain cautiously bullish.
Disclaimer
This is not financial advice. Our content is intended to be used and must be used for information and education purposes only. Please read our disclaimer and terms and conditions to understand our obligations.

22 comments
Bid situation.
Sold half my holding 25% profit.
Who to believe? The brokers now stock is in play? RustySpanner?
Stockopedia = Value and Quality but Short Sellers' screen.
Certainly Short Covering explains some of the Rocket fuel Rise!
Having worked for Inmarsat as a contractor, and seen the incompetent way the company is managed (public comments on Glassdoor.co.uk), breaking the monopoly position that they held up until to todays announcement on Iridium explains (http://spacenews.com/iridium-breaks-inmarsat-monopoly-on-maritime-safety-communications/) will leave them with little of value IMHO. Their business processes are tangled and ineffective and with holes and duplication. They have a complacent, public sector mindset and I'm glad I don't have any shares in them!
Ay up pal
how the devil r u
its not a done deal yet, if the bounce today holds above 434 and continues rising from there with volume. It could still be game on. But yes I agree with your price target, don't forget though the ex divi SP will almost reach that. Its all good technical and fundamental.
Reached 390 target and bounced.
Dividend cut is applauded by investors because it saves cash.
I have taken a new position because ISAT (Inmarsat) does the WiFi in planes which is a growth area.
updated here
https://www.stockopedia.com/content/an-update-on-isat-state-of-the-markets-easyjet-and-debenhams-315228/
regards J
Came to similar conclusion about ISAT, out at 447p for 15% loss. Glad for bounce from yesterday.
Next downside target May 2012 Lo around 391p.
Appreciate your efforts for the cause of Technical Analysis.
Articles published in the last couple of days
including more insider trading to the value of $149,600.00
https://stockpressdaily.com/in...
https://simplywall.st/news/201...
https://www.directorstalkinter...
https://www.stockopedia.com/sh...
Regards J
1 Inmarsat have competitors.
2 The business needs big lumps of capex now & then to keep up to date with new technology.
So I'm far from convinced this is a good idea.
I'm re posting the chart of the Elliot wave analysis for you Aflash as it appears missing the Right hand portion on my screen, hopefully this will work
Regards J
Hot stuff.
It is unusual to find someone with your Technical skills on Stockopedia.
I take your point about a possible completed 5 wave down. Not a very clear long and strong third wave however.
I have also been looking for symetrical moves in both price and time such as Carolyn Boroden of fibonacciqueen.com finds. There have been some strong 2 pound moves in 2 months in both directions recently but the 3 pound move in 6 months after Nov 2014 does not appear anywhere else.
This is an interesting case study of what happens to a company when it's been highly rated by the market and then profits fail to meet expectations:
While profits are only down by 50% the share price has halved because of P/E compression. Back in 2015 investors were happy with a forward P/E of 30 while now the rating is around 15. So a double whammy for holders. Add on the forward yield of around 8% and it's clear that Inmarsat (LON:ISAT) is in the dog-house with investors and primed for a dividend cut.
Damian
Hi Damien
Thanks for your contribution
Obviously this article is a numbers of years old, so good to see people contributing as I thought they would if I tagged it onto one of Roland’s articles.
Please see my reply to Tom, for my rationale and thinking on ISAT as a potential trade
How do you copy and paste the little sections from stocko’s website onto to your Comments?
As you’ve done with the Graphical History, I can’t figure it out, do!
Best regards John
Hi John,
It's reasonably straightforward to include images but there are a number of steps:
1) Use some sort of screen-grabbing tool to capture an image from somewhere on your screen (I use Greenshot which is free)
2) Save that image somewhere on your computer
3) Click on Show Text Editor to open up the full editor
4) Click on the image icon in the toolbar to select this image file and it'll be inserted wherever you've left your cursor
HTH,
Damian
There's a snipping tool in Windows for image grabs.
HI Damien
I was fine with steps 2,3, and 4
Hadn't heard of the screen grab tool before though
One never stops learning until the day they die
Great thanks
Isn't that the truth John - always learning!
The Windows Snipping Tool is fine although I like Greenshot because I can bind it to the Print Screen button for easy access.
Damian
Halved since this article was published.
Is it time to buy Inmarsat?
If you follow Harmonic patters. ISAT has just completed a Bullish Gartley on the weekly charts
A whole load of ratios coming together on the AB=CD pattern also. CD of the CD leg is a 113 expansion of AB.
Would be interested in all your views!
The chart looks horrific. Cant say i know anything about harmonic Patters though. Why would anyone consider buying this when there are so many other stocks in an upward trend where you could invest your money. In my eyes investing here is trying to catch a huge falling knife, volume was off the chart today. I would never take the risk due to the continued downside risk. Looks a tempting short candidate though
All the best
Tom
Hi Tom
Good to hear from you
Apologies (typo) their harmonic patterns not patter
I’m more interested in the QV rank really
Value Rank 70.2
Quality Rank 80.1
QVRank™ Composite: 87/100
I look at charts to try n identify an area where other potential investors may enter the trade.
The huge volume you refer to confirms that there is huge interest in ISAT at this price.
Huge volume will often mark a long term price reversal. I refer to them as volume spike reversals, I’m sure you’ve heard of the phrases, Selling Climaxes, buy when there’s blood on the streets, buy the dip and so.
Back to the QV rank, as a long term strategy it’s only beaten by the QVM rank and the QV always come before the M.
In the meantime I am happy to collect the near 8% dividend yield, yes I know it can be cut and so can the share be sold. Compound 8% interest over 10 years and you’ve more than doubled you money.
I also see ISAT as a potential takeover target at these levels.
I personally wouldn’t short this trade, if you want one to short try Debenhams that may go to Zero. However, if you are short good luck
Best regards John
Yes Sir!
Thank-you for bringing it to our attention.
Maybe the last seller has left the building. Worth a punt 4 me.
However the main reason for this post is to ask about the charting patterns on Trading View.
I use Elliot Wave which has an A-B-C Counter trend pattern after the 5 Up impulse waves. On that count the downtrend is just beginning!
The Fibonacci retracements do not help much here because the price is through the .618% and on the way to a 100% retracement of the 2012 Lo. It was lower in 2009 but bounced in-between.
There is a .618 on your chart which is presumably at least related to Fibonacci.
Harmonious pitter-patter is new to me but time prevents me investigating.
More to the point. Have you had good results? How long have you been using their techniques?
Hi Aflash
Thanks for your reply
I’m sure not I agree with your Elliott analysis I’ve updated my chart for you to include my interpretation of Elliot, of which I’m not a big fan. The reason being, if you put a chart up and have two so called Elliot wave gurus look at them they come up with different wave counts and how to interpret their meaning in much the same way you and I have. Looking at ISAT one of the Elliot rules is that the A-B-C correction does not cross the top of wave 1. I’ve put a bold red line at the top of wave 1 of the impulsive trend and as we can see, this is pretty close to happening which would invalidate my count, If not then you also have a near perfect Elliot entry. The last leg of the A-B-C correction gives a clear 5 count again annotated on the charts.
Yes I’m using I’m using the 2012 low for the basis of my trend analysis and your correct the price is through the .618 and testing the .786 Fibonacci retracement of the 2012-2016 move. At the .786 retracement a Gartley pattern is evident. The Gartley pattern is no doubt the inception of Fibonacci price confluence pattern recognition (Harmonic Patterns) in financial markets. The Gartley “222” pattern is named after the page number it is found on in H.M. Gartleys book, Profits in the Stock Market. These patterns normally form when a correction of the overall trend is taking place and look like ‘M’ (or ‘W’ for bearish patterns). Harmonic patterns have evolved ever since with more being identified and inducted into financial literature. I recommend Scott Carneys work as further reading for interested parties.
Your question “More to the point. Have you had good results?”
My original reply was I look at charts to try n identify an area where other potential investors may enter the trade. However look at the current chart of the FTSE 100, you may find a useful Bullish Gartley pattern completing right on the 233 Day EMA. 233 Day EMA will be very close to the 200 day SMA, so an area of interest for investors and traders. The Gartley Pattern completed at a price of 7204 on the 15 September 2017, 8 points off the low of the day @7196. From there prices never looked back. Here’s the chart
Look at the chart of EASYJET between October 2016 and March 2017. It’s not a perfect Harmonic Pattern as the .618 was not touched when completing the A to B leg of the AB=CD, but easy to see a Bullish Gartley formation completing almost to the penny. No need to do any of this waves counting pitter-patter stuff, “how many waves can you see? Oh three I think and you? Five, oh no sorry seven I see seven.”
You asked if Harmonic Patterns work?
Harmonic pattern reliability? Some commentators claim an 80% success rate; however I would be very sceptical of this. Some people only tell you what they want you hear as it may be in their best interest. Imagine coming across a cyclist involved in a Road Traffic Accident. You ask their name and if they are you OK? They reply, Andy and Yes I’m fine thank you. Have you really checked that they are OK? You may think you have until you ask the next question. What happened? Oh I fell down the stairs. OK so they are clearly not OK. Why are they suffering from lower levels of consciousness? Do they have a head injury or internal bleeding? Not sure check their breathing and pulse rate for clues. It’s like evaluating shares; you’ve got to ask all the questions.
Like I said I use charts to identify areas of price interest and harmonic patterns are a very useful tool for this purpose when used in conjunction with fundamentals, volume and time analysis.
Maybe the last seller has left the building. Worth a punt 4 me.
Please don’t take a punt on shares on other peoples say so, even if you can afford to lose money, better to spend it elsewhere than lose it in the stock market. Do your own research.
For openness and transparency I have a long position on ISAT opened with a limit order at a predetermined price
My rationale for buying, and I hope this also helps you Aflash.
First of all we have Roland’s excellent article, even though 2 years old still relevant. May be even more so, as I think wireless communications are definitely here to stay. Thanks Roland.
At this stage of a bull market I like to buy shares that tick the QV box for some downside insurance. When you add momentum the number of successful shares above 75% outperformance drop to 2 sets of quintiles re balanced quarterly. If one uses QV the number of successful quintiles with outperformance of between 60-80% rises to 4 fours sets of quintiles rebalanced quarterly. (see images below.)
QVM
QV
From these four sets, my theory is to identify shares where the QV rating is maintained and momentum improves elevating them into the 2 massively outperforming QVM quintiles rebalanced quarterly. This also minimises rebalancing as you’re already in the shares when elevated into the QVM bracket. (The QM always comes before M because that’s what investors are paying for).
ISAT’s QV rank is very good and improving
I use a 12 point checklist to identify suitable for shares for purchasing and look for Improving QV and usually discard shares that don’t meet the criteria. However, I’m going to make an exception for ISAT. The tests it fails are for debt ratios. So why am I going to make an exception? Launching satellites into oblivion is going to require a good deal of investment (Debt). So can the debt be paid off? If the Quality rank is anything to go by then yes, it looks like all of ISAT’s Q components are good and all the % return ratios are far greater than interest payments effectively leveraging profits. The number of shares in issue has also been stable. So ISAT have not been tapping shareholders for cash
Dividend Yield (near 8%)
Is the dividend yield safe? It is always possible for the dividend to be cut, however ISAT has a history of growing its dividend despite never having a satisfactorily dividend cover value and its earnings yield is reasonably good at 8.47. P/FCF is also good suggesting that the dividend could possibly be maintained although a dividend cut is on the cards; it wouldn’t be disastrous if it were halved.
Possible takeover target?
ISAT has a very desirable enterprise value and EV/EBITDA when compared to the market let alone its industry group.
This is what IC’s View is as updated last Friday.
What are insiders doing? Buying £250,000 since August
Mr. Andy Sukawaty
10/11/2017 | Purchase
19,260 519.21 100,000.00
Mr. Rupert Pearce
10/11/2017 | Purchase
19,260 519.21 100,000.00
Mr. Simon Bax
08/09/2017 | Purchase
2,500 646.25 16,156.00
Mr. Simon Bax
08/09/2017 | Purchase
2,500 646.25 16,156.00
Mr. Simon Bax
10/08/2017 | Purchase
3,250 741.64 24,103.00
Total 256,415.00
What are outsiders doing? Buying big! If this link doesn’t work go to the news page on Stocko and you’ll see that Artemis have made a rather large investment. So a lot of people buying a lot of shares on Thurs and Friday!
https://www.stockopedia.com/sh...
INVESTORS CHRONICLE CONTRARIAN TIP OF THE YEAR whoops! So you can be sure if it starts moving in the right direction it will be getting plenty of influential press coverage, ha.
Finally the charts from a conventional point of view and as you can see we’ve just hit trend line support with a divergence pattern on the MACD weekly chart
The horizontal red line is the Elliot wave 1 top
This Link is a daily chart on Stocko if it works
https://www.stockopedia.com/sh...
and below the weekly chart
Finally do we have a bullish candlestick reversal pattern Harami candle on the daily chart? Yes, however I wouldn’t class Harami candles as a significant reversal candles but it does confirm this price area as one of interest. You can also see both lines from the weekly chart converging below both the opening and closing prices of each candle here Let the battle between the bulls and bears commence.
One last thing on Elliot I believe if the ABC correction terminates in 5 waves, it’s supposed to be a continuation pattern! Someone please correct me if I’m wrong. So this one might be one to trade rather than invest, But like I said I don’t follow Elliot wave.
I’m going to finish my article like Roland started his “When it comes to technology investments, timing is everything”. Thanks again for your insightful article Roland, keep up the good work.
Hope this helps Aflash
Best regards John
Anyone interested in more of the same please give me a thumbs up comment are welcome both good and bad. If I get enough responses I may consider doing regular articles incorporating Harmonic Patterns.