Adding & comparing stocks in a chart
At the top of the chart is a search box that allows you to search for any of tens of thousands of securities using the name or ticker of one or more shares, indices, ETFs or Trusts.
The search results are returned in a dropdown menu which can be further filtered by security type using the horizontal tabs. The tabs allow the search results to be filtered as “All” securities, “Stocks”, “Indices”, “ETFs” or “Trusts” - which also include all closed end funds.
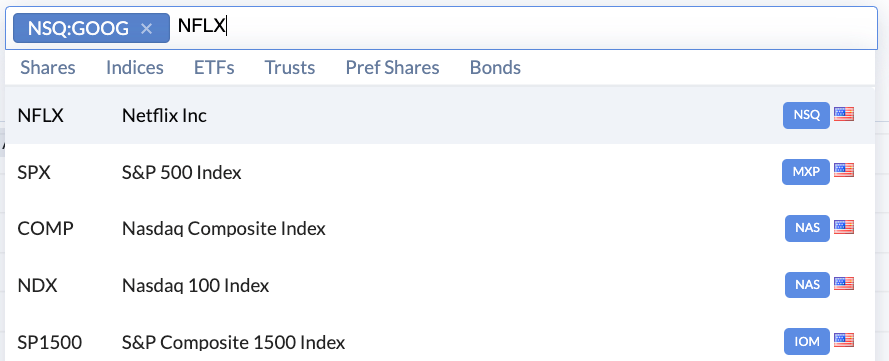
You can either use the up and down keys to navigate the list of securities returned in the dropdown menu and hit enter to select, or use your mouse to click on any of the items. Once selected the chart will immediately load the price histories of the share as a time series.
Comparisons - adding multiple stocks
The Search box is a multiple search entry box. You can keep searching for and adding as many securities as you like to the main chart.
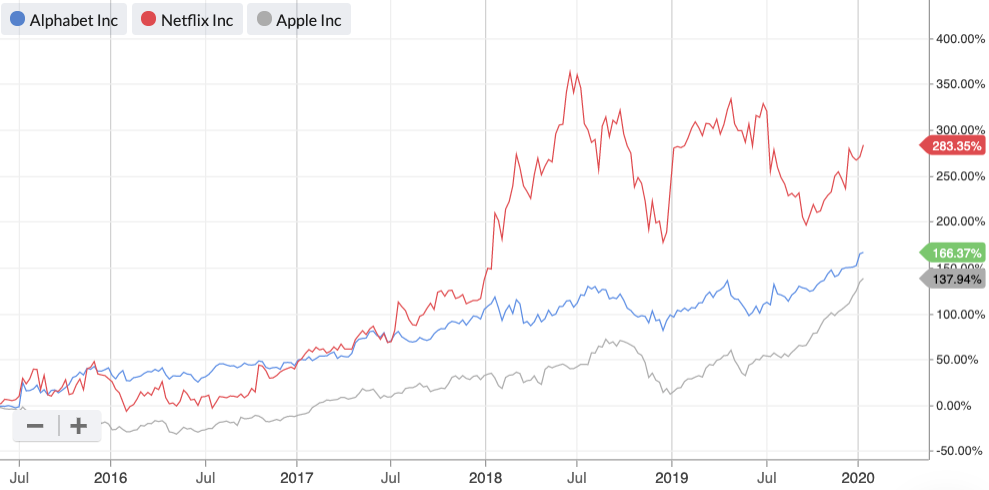
The Chart axis type will convert into a percentage axis once 2 or more instruments are added so that you can compare the relative performance over any timeframe.
Do note that your browser responsiveness may decline with the more instruments you add, so don’t go too crazy.
Removing Securities from the Search Box
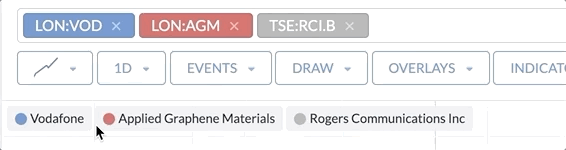
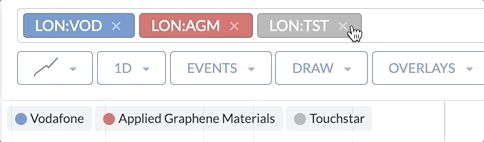
Removing securities from the search box can be done either by clicking the delete or backspace key in the search box, or by clicking the ‘X’ on each item.
Changing the colour of a line
There is a default colour series for all comparison charts. By default the first extra added instrument is coloured as a subtle grey line, but this can be changed.
As long as the “Names” option is added in the main chart settings, you can click the coloured circle and select another colour from the tooltip menu: