Adding events & flags to your chart
The Chart Events menu lets you track major company events and your own portfolio activity by adding flags to your charts. These event markers help you pinpoint key moments in time and understand what might have influenced the stock price.
How to Add Events to Your Chart
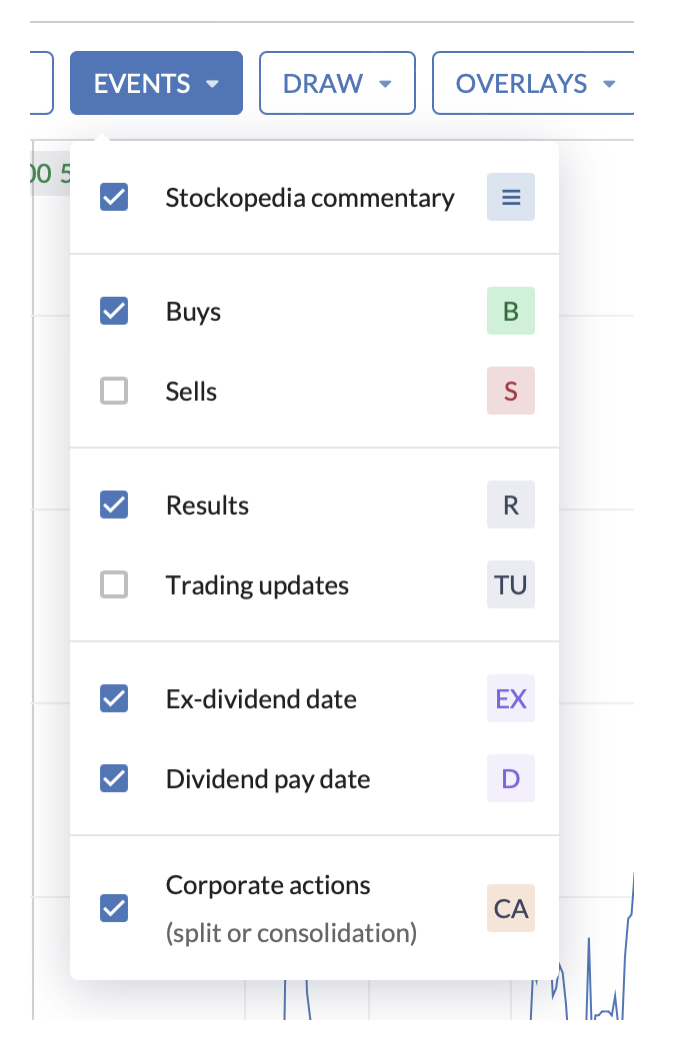
- Click the Events button (blue) to open the dropdown menu.
- Check or uncheck each event option to toggle event flags on or off.
- Flag Placement: Events appear either on the price line or just above the date axis.
- Stacking: If multiple events occur on the same day, they will be stacked vertically for easy viewing.
- Hover for More Info: Hovering over any event flag will show you additional details about that specific event.
Folio Events: Track Your Portfolio Buys and Sells
You can also track your own portfolio activity on the chart by adding Folio Events:
- Buy Transactions: Green flags represent the date and price of your purchase.
- Sell Transactions: Red flags indicate the date and price of a sale.
These flags give you a visual reference for your trades alongside the stock's price movements.
Company Events
1. Stockopedia Commentary
- Flags when Stockopedia’s editorial team has published commentary or insights about a company. This feature may provide context for price changes based on expert analysis.
2. Results
- Company Results include annual, quarterly, or semi-annual financial reports, giving you an insight into a company’s performance and its impact on stock price.
3. Trading Updates
- Trading Updates provide key information about a company’s outlook, including news and forecasts, often leading to price movement.
4. Ex-Dividend Dates
- The Ex-Dividend Date is when the stock starts trading without the value of the upcoming dividend. Knowing this date can help explain fluctuations in stock price.
5. Dividend Pay Dates
- The Dividend Pay Date marks when the company pays out dividends to its shareholders, which can influence investor sentiment and stock prices.
6. Corporate Actions
- Stock Splits: Indicates when a company divides its existing shares, usually to make the stock more affordable for investors.
- Consolidations: Shows when shares are combined to reduce the total number of shares in circulation

