ATR Trailing Stops
ATR Trailing Stops are a way of using the principles behind Average True Range - a measure of the degree of price volatility - and using it to set trailing stop-losses.
The idea is that ATR gives a guide to the average volatility of price movements over a given period, making it easier to be more precise about where to set the stop-loss.
True Range is calculated by looking at the daily price change and using the greater of three calculations: (high – previous close), (previous close – low) or (high – low). In the case of ATR Trailing Stops, the Average True Range is the True Range calculation over a default 21-day period average.
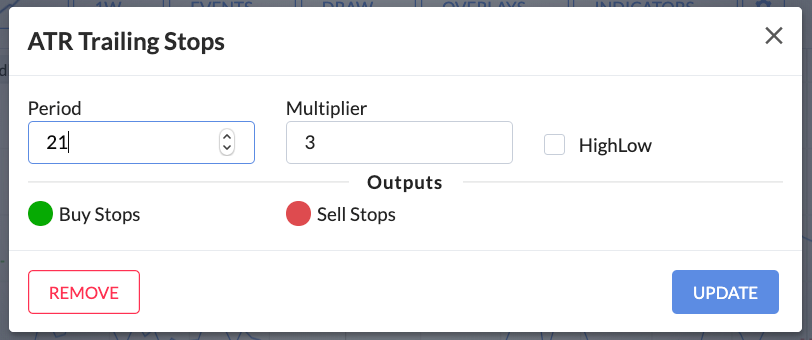
A multiple of the ATR - in this case a default multiple of 3 - is plotted around the ATR line. Welles Wilder, who invented the ATR Trailing Stop preferred ATR multiple of 3.
These settings can be adjusted by launching the ATR Stops settings modal.

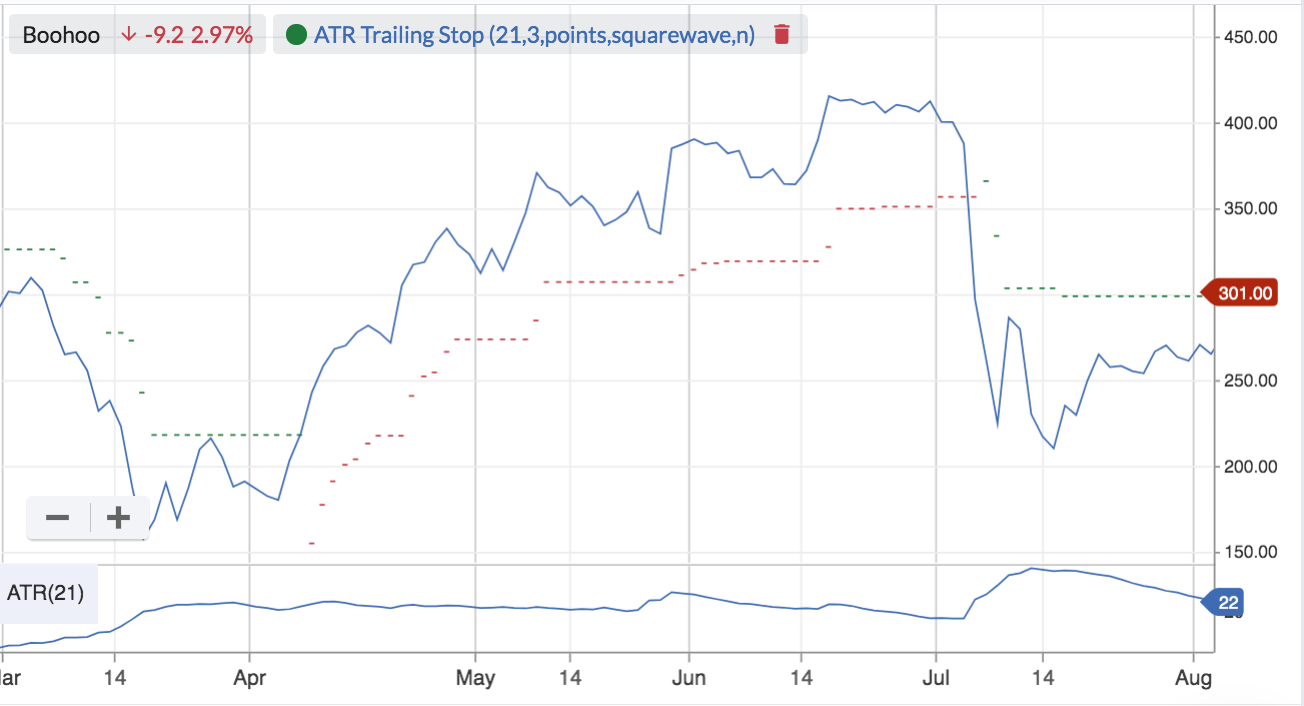
The ATR Trailing Stop is plotted above (or below) the price when the stock is in a downtrend (or uptrend). To get a guide to where the ATR Trailing Stop is being set, it can be helpful to add the Average True Range Indicator to the bottom of the chart (to do that, click Indicators and select Average True Range). You can see this in the example below.
ATR Trailing Stops work by taking the Average True Range and multiplying it by the default multiplier of 3. In an uptrend, the equation is previous close share price - (ATR x 3). In a down trend, the equation is share price + (ATR x 3)
In the example below, you can see how the ATR Trailing Sell Stop (in red) continues to move up as a share price rises in a trend. When the price has fallen or flattens out and crosses the Sell Stop line, the ATR Trailing Stop flips to show a Buy Stop (in green), which can be used to protect short selling positions.


