Changing chart timeframes & periodicity
Charts are all about the price histories of securities and projections to the future, which makes time a first class citizen in charts. Stockopedia Charts provide a range of easy to use features that allow quick date navigation on any device, using a mouse, fingers or the keyboard.
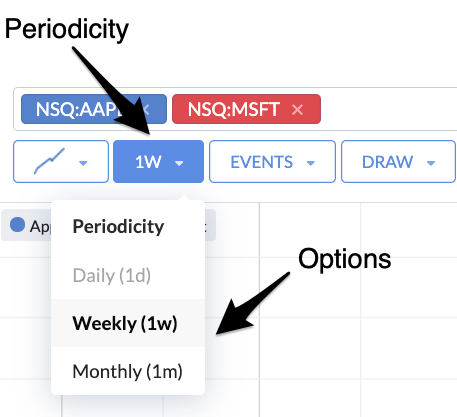
Periodicity
Firstly, the periodicity menu in the top toolbar allows you to control the length of each price unit to either daily, weekly or monthly bars. Daily bars can be viewed at up to 5 years of timeframe, beyond which it’s best to select either weekly or monthly bars.
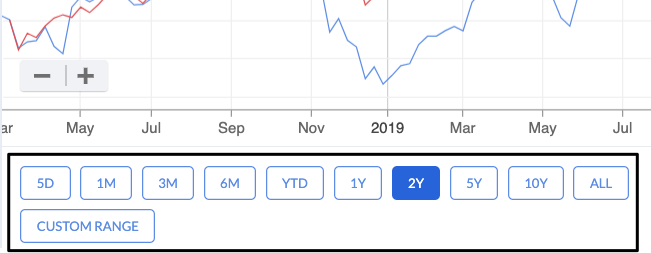
Timeframes
The easiest way to select a timeframe for the chart is by using the menu items in the bottom toolbar. These provide one-click options to zoom in or out to view time ranges from days to years for any security.
There’s also the ability to use a Custom Date Range to select a timeframe of your choice. Click the option and you’ll see two calendars pop-up side-by-side. You can either add the dates by hand using the text boxes at the top, or use the arrow keys to move forwards and backwards to the date of choice. Click a date first in the left calendar and then in the second calendar to select the time period. Click “Apply” to set the dates in the Main Chart Window.
Mouse & Multi-touch Gesture Control
Charts are very easily navigated using click and drag (with a mouse) or with multi-touch gestures (on a trackpad, or touch enabled tablet). This is an essential usability addition.
Mouse Control On the main chart interface:
- Click and drag left or right to move forwards or backwards in time.
- Click and drag up or down to move up or down the vertical axis.
Hover over the date axis, the mouse pointer will change its icon:
- Click and drag left to zoom out in time.
- Click and drag right to zoom in in time.
Hover over the vertical price axis, the mouse pointer will change its icon:
- Click and drag down to expand the axis and narrow the price chart in size.
- Click and drag up to contract the axis and expand the price chart in size.
Multi-touch Gesture Control On the main chart interface:
- swipe up with 2 fingers to zoom in.
- swipe down with 2 fingers to zoom out.
- swipe left with 2 fingers to go forwards in time.
- swipe right with 2 fingers to go back in time.
- Pinch to zoom in.
- Unpinch to zoom out.
Some examples can be seen in the animated image below: