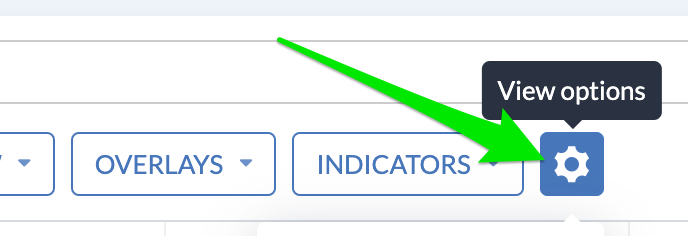
Adjusting your chart settings
You have the flexibility to personalise your experience and make the most of Stockopedia charts using a range of general chart settings and tools accessible through the main settings button.
Log Scale: By default, our charts employ a linear scale, where each price interval on the vertical axis maintains an equal distance from the next. Conversely, logarithmic (log) scales arrange these intervals at exponentially decreasing distances. This feature proves especially valuable when assessing the price performance of shares that have undergone exponential growth. For instance, a stock consistently growing at a compounded rate of 20% annually results in a share price chart with a curving trajectory, which can obscure year-to-year performance comparisons. Utilizing a logarithmic axis provides a more precise representation of year-on-year performance trends.
% scale: As the name suggests, a % Scale chart changes the price axis to a percentage scale. With this option, over any set period, the price chart will show the increase or decrease in price percentage terms.
Names: This tick-box offers you the choice to include or remove the information box on the left side of the chart, indicating which stock names are included.
Overlays: This tick-box functions similarly to the previous feature applied to the overlays information box.
Crosshair: By default, when hovering over a chart, you'll only see your mouse cursor. However, for enhanced precision, you can opt for a Crosshair. The Crosshair enables you to pinpoint any position on the chart, revealing both the date (horizontal axis) and the price (vertical axis).
Legend: The Legend option provides detailed information about the open, high, low, close, and volume data for the hovered price bar/point. It is displayed in a black box on hover, aiding in understanding the underlying data.
Volume: Clicking the Volume tick-box reveals an underlay illustrating the relative volume of shares traded each day. Higher bars in the Volume chart represent a higher volume of shares traded during that period. Red bars indicate days when the share price closed below the previous day's closing price, while green bars represent days when the share price closed higher than the previous day's close. Please note that these are displayed on the Main Price Chart and do not receive their own axis for displaying volume amounts. If you wish to view the volume amount separately, we also offer the option to add Volume as an Indicator in its own chart. Access this option in the Indicator menu.
Today's Price Line: This is a default setting on charts but can be deactivated using the tick-box. The line is represented by a dashed line across the chart, with today's price indicated on the vertical axis.
Range Slider: Enabling this feature provides greater control when selecting time ranges on the chart.
Setting alerts and adding to folio options
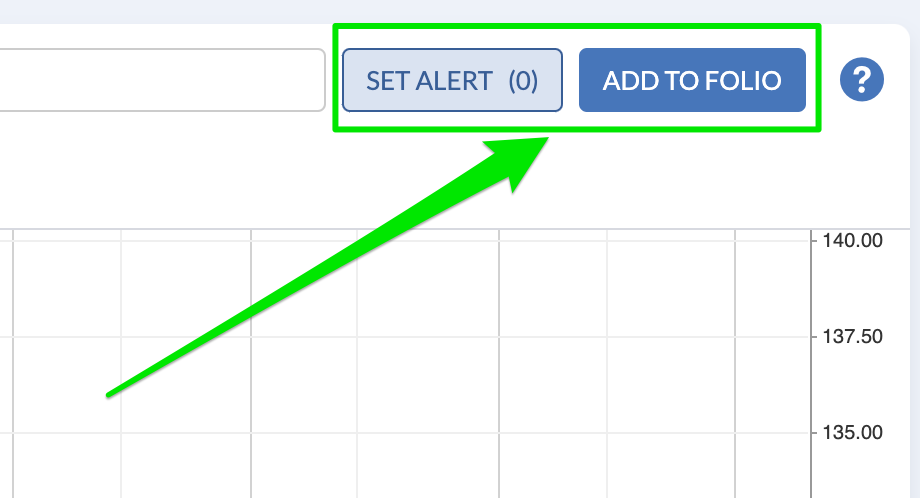
Instructions for Adding Stocks to a Folio from a Chart:
- Navigate to the full screen chart for the desired stock.
- When there, find and click the "Add to Folio" button in the top right.
- A pop-up window will appear with available folios.
- Select the desired folio or create a new one.
- Confirm your selection to add the stock to the chosen folio.
Instructions for Setting Alerts from a Chart:
- Navigate to the full screen chart for the desired stock.
- When there, find and click the "Set an alert" button.
- A pop-up window will appear with all the available alert options.
- Confirm your selection to add the alert.

