How can I find Golden Crosses?
On a stock chart, the Golden Cross occurs when the 50-day Moving Average crosses over the 200-day Moving Average. Some investors may use this as a buy signal, in the belief that a significant uptrend will continue. The Stockopedia screener allows you to identify stocks that have passed the Golden Cross by looking at the 50-day / 200-day rule located in the Momentum section of the Rule Picker.
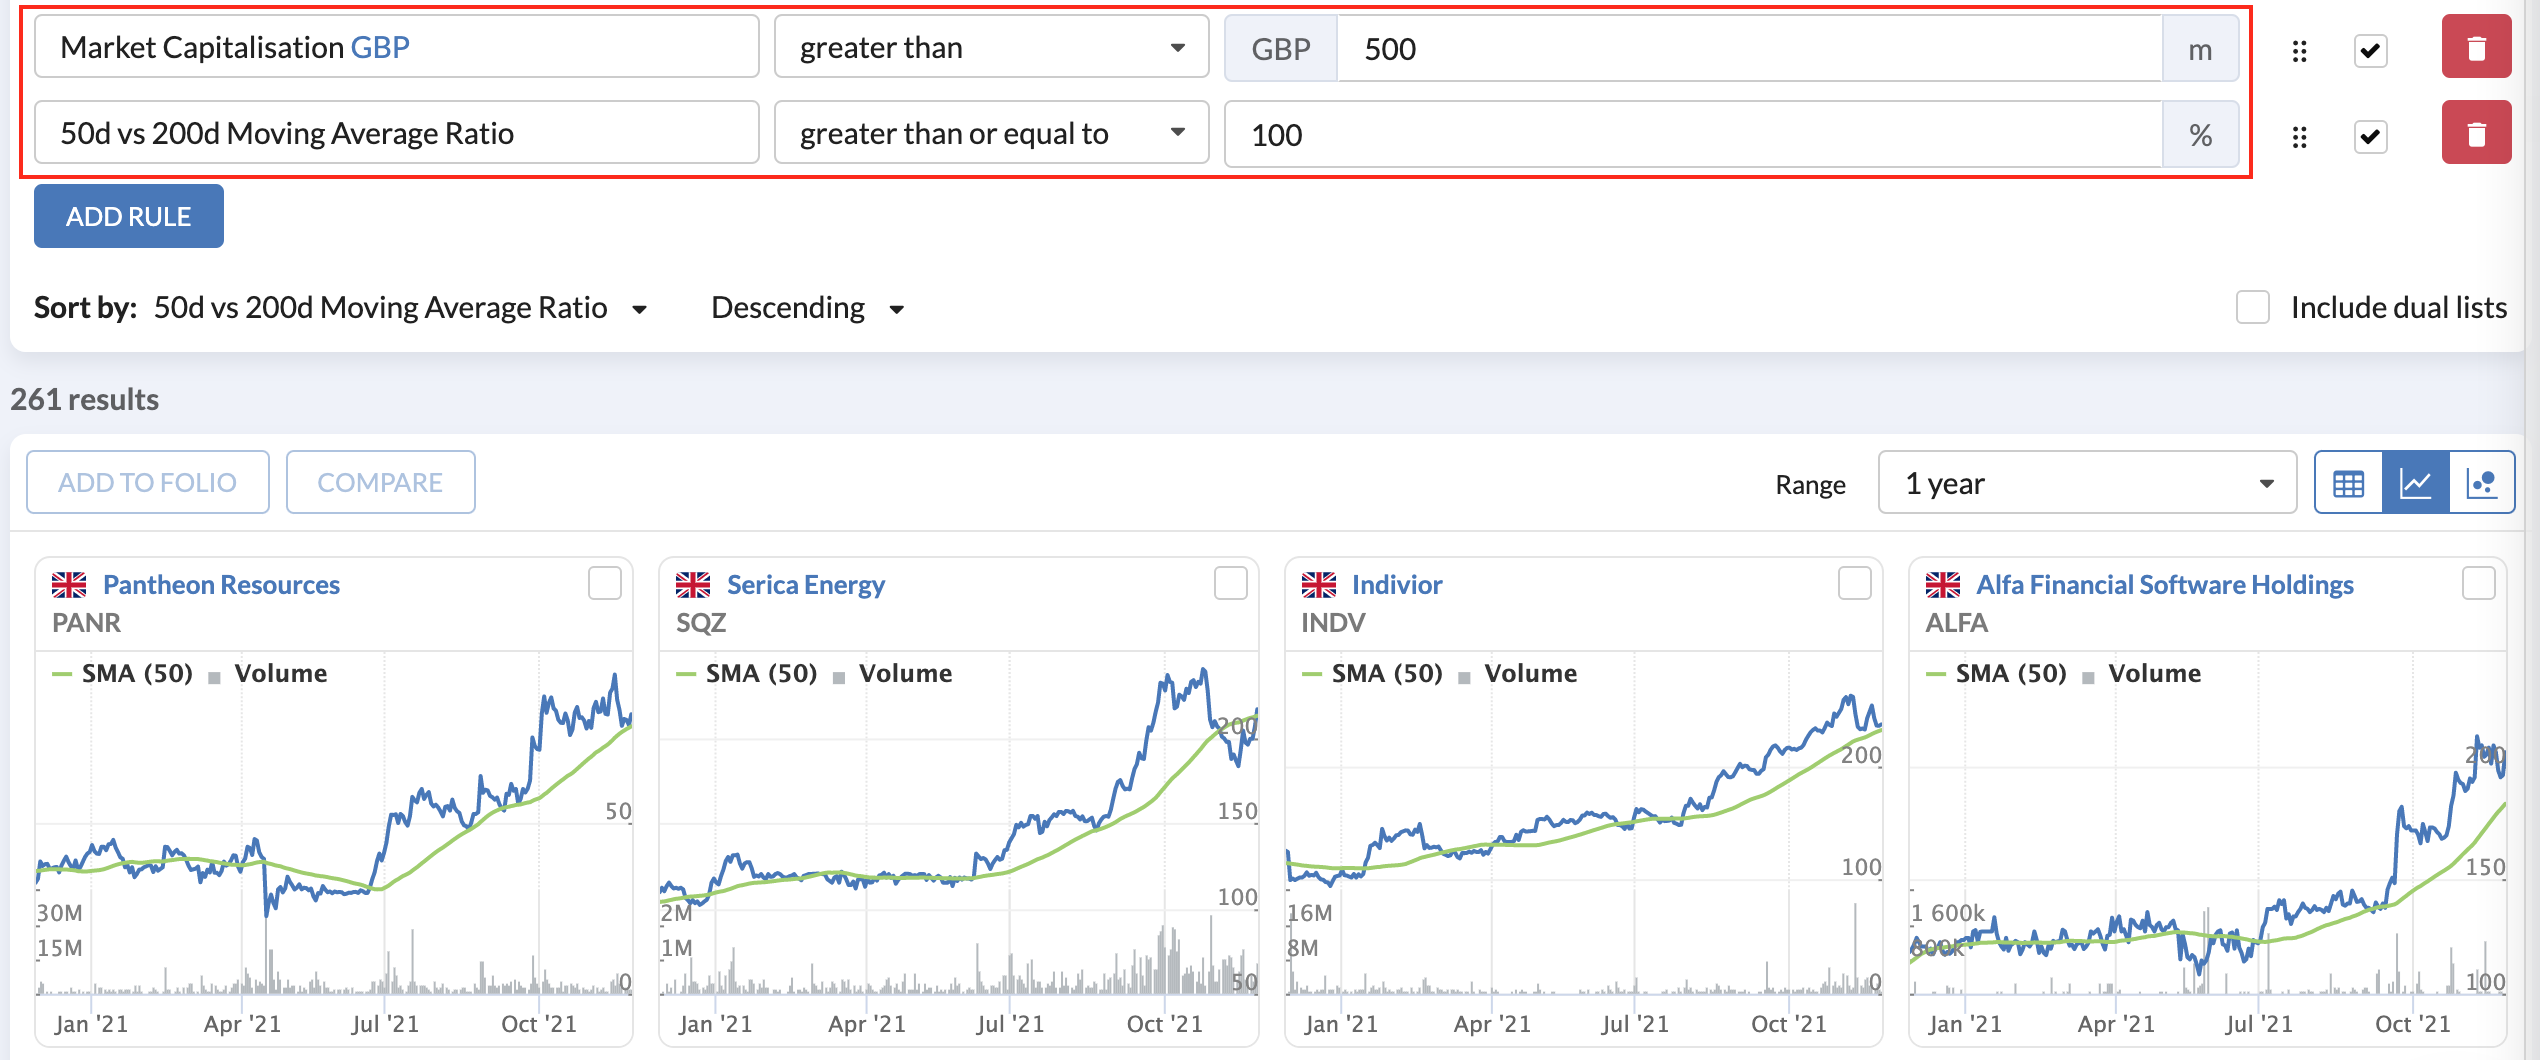
Using the 50d vs 200d Moving Average Ratio you can,
- Screen for the Golden cross
- The 50d vs 200d Moving Average Ratio should be equal to or greater than 100
- The 50d vs 200d Moving Average Ratio should be equal to or greater than 100
- Screen for the Death cross
- The 50d vs 200d Moving Average Ratio should be lower than 100
Filtering for different price acceptance theories
While the 50d vs 200d Moving Average Ratio is the quickest way to screen for the Golden Cross, the two moving averages are also available to the screener to use independently against price.
With Golden Crosses, the 200 day MA always has a greater positive distance from the price compared to the 50 day MA. With this in mind, you can tailor the independent metrics to find different types of Golden Cross:
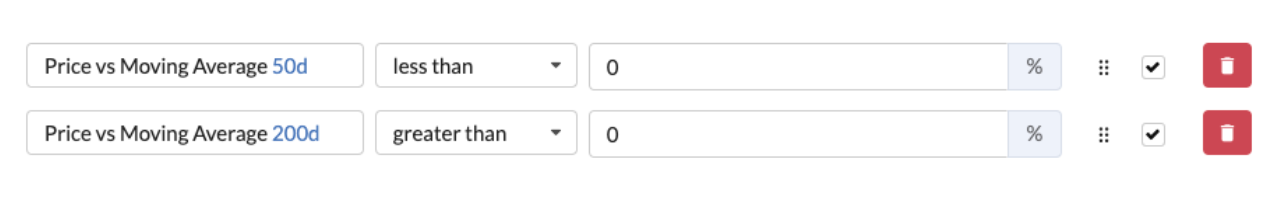
Recently confirmed Golden Cross (with recent price acceptance)
By using the lowest value of ‘zero’ it’s possible to find quite recent Golden Crosses. Because of their recency, these can be interpreted as an early appearance of a Golden Cross, but they may be seen by some as too junior and needing more time for confirmation.
Mature confirmed Golden Cross (with recent price acceptance)
By using higher values in these rules, it’s possible to find more mature charts showing the Golden Cross. It could be debated that due to their age, they have a lower life span compared to others
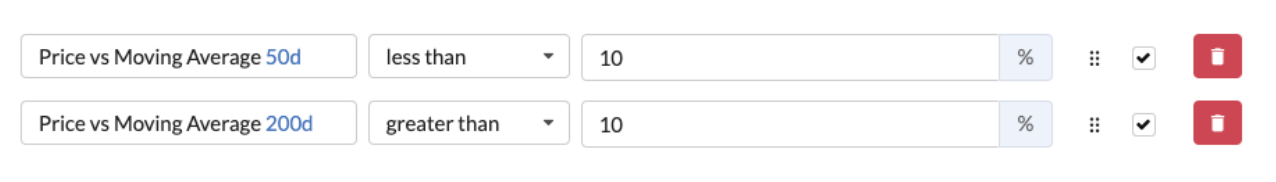
Interestingly, when using the value of 10% in this scenario, there is a high likelihood that the price will be positive compared to the 6-month change and 1-year change, but the desired metrics should always be inserted to guarantee selection.
With both these examples, if you are using “greater than” on both the 50 day and 200 day moving averages, you will need to apply the 50d vs 200d Moving Average Ratio of over 100 to guarantee that the results are still showing a Golden Cross.
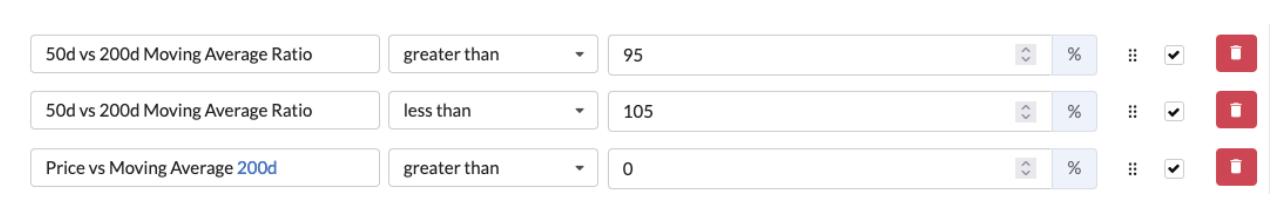
Finally, to find charts where the trajectory suggests that a Golden Cross has, or will soon appear, you can use the 50d vs 200d Moving Average Ratio twice. Adding the ratio twice - in this case using “greater than 95%” and “less than 105%” will return crossovers that are in a 10% crossing range.