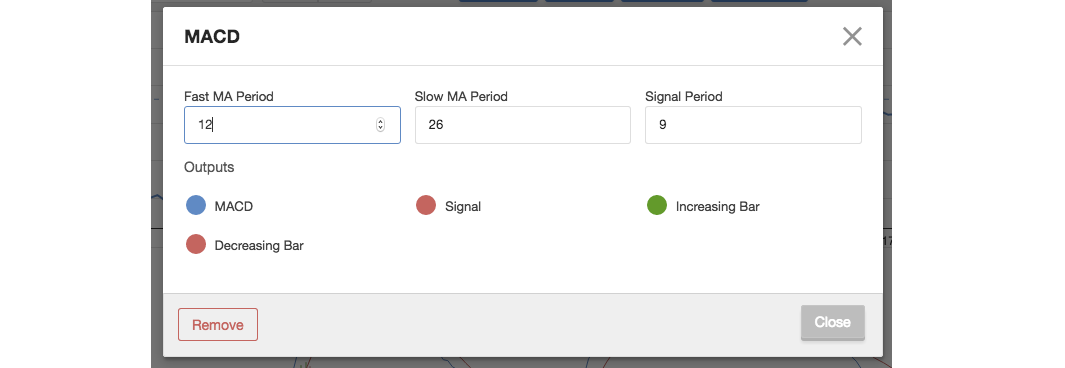
MACD
MACD - Moving Average Convergence / Divergence - is a momentum and trend-following indicator that uses three different moving averages.
There are two main parts to MACD. The first is to take two short term moving averages:
- 12-Day Exponential Moving Average
- 26-Day Exponential Moving Average
The 26-Day MA is subtracted from the 12-Day MA to create a MACD line.
Next, a Signal line is created by taking the average of the difference between the two MAs - in this case a 9-Day MA. The two lines are plotted against each other.
Importantly, MACD uses Exponential Moving Averages. Unlike Simple Moving Averages, EMAs put more weight on the most recent price data. As a result they are more sensitive to recent price movements than SMAs, which can lag.
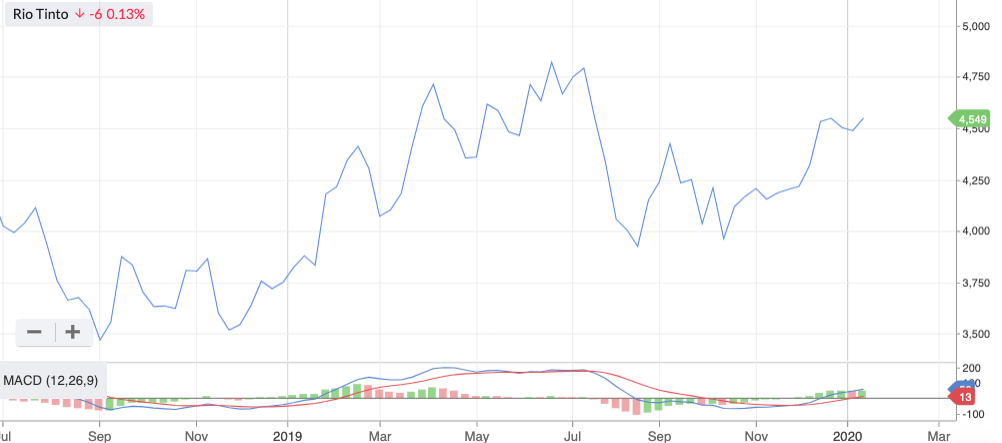
There are three methods for interpreting the MACD:
- Crossovers: It is considered a bearish signal when the MACD falls below the signal line, while a bullish signal occurs when the MACD rises above the signal line.
- A Divergence occurs when the stock price diverges from the MACD, signalling the end of the current trend. A divergence is considered bullish when the stock price makes new lows but the MACD does not make new lows. It is considered bearish when the stock price makes new highs but the MACD fails to do so.
- A Dramatic Rise occurs when the MACD rises dramatically and the shorter-term moving average pulls away from the longer-term moving average, signalling that the security is overbought.
Precise MACD settings can by customised by clicking ‘MACD’ and then clicking the settings icon.