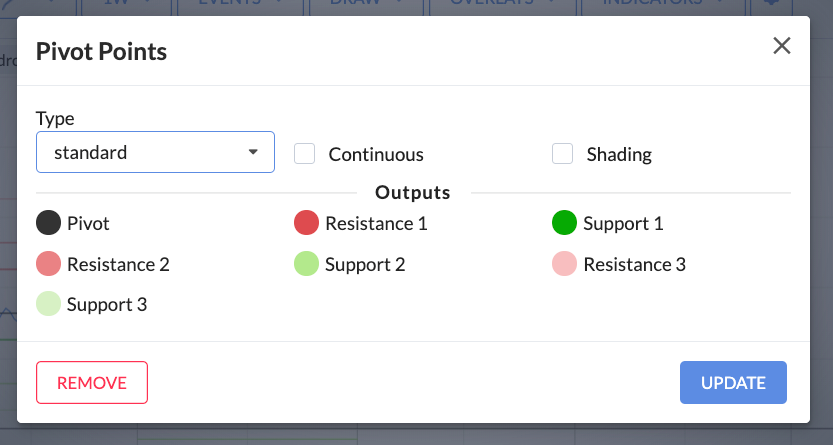
Pivot Points

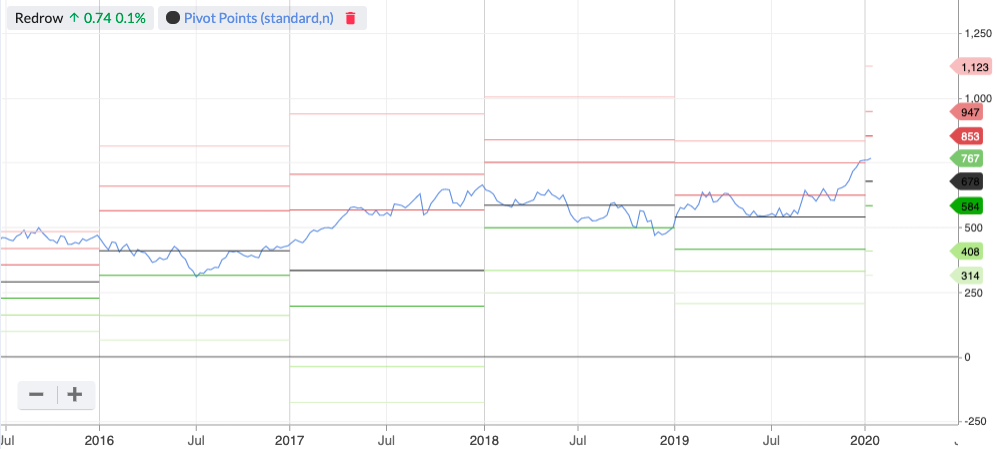
Pivot Points are horizontal lines that plot the average of a company’s most recent high, low and closing price. They also overlay a series of support and resistance levels.

Typically, the top red lines represent resistance, while the bottom green lines represent support. The black line in the middle is the Pivot Point.

There are three pairs of support and resistance levels used in a Pivot Point overlay. Here are the calculations:

  • Pivot point (P) = (H + L + C) / 3
  • Third resistance level (R3) = P + 2 x (H – L)
  • Second resistance level (R2) = P + (H – L)
  • First resistance level (R1) = (2 x P) – L
  • First support level (S1) = (2 x P) – H
  • Second support level (S2) = P – (H – L)
  • Third support level (S3) = P – 2 x (H-L) (H = Previous High, L = Previous Low, C = Previous Close)

226cda113945f811ee2c02070b7dedc3dc8c68da1579017478.png

The main inputs for Pivot Points can’t be customised, but the colours used on the chart can be by using the Pivot Point settings modal.

8b316ff2a6bb680840b4ed1519ad0c6583537db91579018055.png


A subscription to Stockopedia will be one of the best investments you'll ever make...

Here's what you'll get:
A decade of research into what works in stock markets
Millions of pounds of platform investment
Countless hours of research time saved
Access to hundreds of educational articles and ebooks
Over 30 talented professionals working flat out for you
A team of the very best bloggers acting as mentors
Saving you thousands in advisory fees every year
Stockopedia is the perfect solution for the time-poor individual investor looking for results
Starting at just £295 per year

After your free trial, plans start at just £295 per year. With a one month money back guarantee, there's no risk.

© Stockopedia 2024, Refinitiv, Share Data Services.

*Past performance is no indicator of future performance. Performance returns are based on hypothetical scenarios and do not represent an actual investment.

This site cannot substitute for professional investment advice or independent factual verification. To use Stockopedia, you must accept our Terms of Use, Privacy and Disclaimer & FSG. All services are provided by Stockopedia Ltd, United Kingdom (company number 06367267). For Australian users: Stockopedia Ltd, ABN 39 757 874 670 is a Corporate Authorised Representative of Daylight Financial Group Pty Ltd ABN 77 633 984 773, AFSL 521404.