RSI

The Relative Strength Index (RSI) is a technical momentum indicator that compares the magnitude of a stock’s recent ‘up closes’ (where the price closed higher than it opened) to recent ‘down closes’ (where the price closed lower than it opened). The results are then indexed from 0 to 100. The number of days used in the formula is a matter of preference. The default value for stocks is 14.

The RSI can be used to determine ‘overbought’ and ‘oversold’ conditions. For instance, if a stock’s RSI falls below 30, it could be seen as oversold. But when it breaches an RSI of 70, it could be overbought.

9d2ac9448fabe986f828f0a422d4bff46450886b1579016848.png

The RSI can also be used to identify divergence. Divergence happens when a price makes a new high (or low) but the RSI does not reach new highs (or lows). It could be a bearish signal if the price reaches a new high while the RSI does not. Likewise, it could be a bullish signal if the price reaches a new low while the RSI does not.

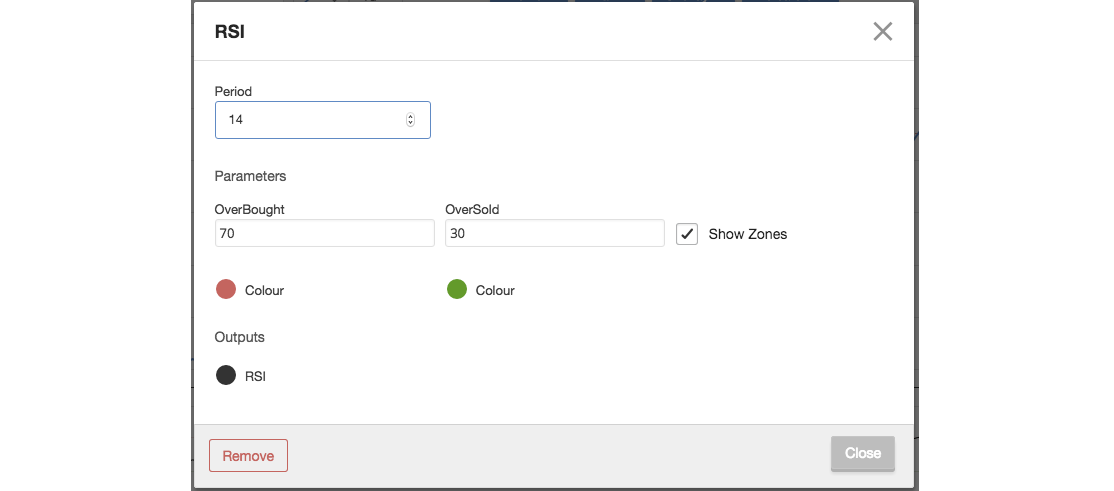
All aspects of the RSI indicator, including colours, can be customised in the settings modal.

8a3359e376b5e3fbcf2cef22f1e5a5ef4e9bcd791549888164.png

A subscription to Stockopedia will be one of the best investments you'll ever make...

Here's what you'll get:
A decade of research into what works in stock markets
Millions of pounds of platform investment
Countless hours of research time saved
Access to hundreds of educational articles and ebooks
Over 30 talented professionals working flat out for you
A team of the very best bloggers acting as mentors
Saving you thousands in advisory fees every year
Stockopedia is the perfect solution for the time-poor individual investor looking for results
Starting at just £295 per year

After your free trial, plans start at just £295 per year. With a one month money back guarantee, there's no risk.

© Stockopedia 2024, Refinitiv, Share Data Services.

*Past performance is no indicator of future performance. Performance returns are based on hypothetical scenarios and do not represent an actual investment.

This site cannot substitute for professional investment advice or independent factual verification. To use Stockopedia, you must accept our Terms of Use, Privacy and Disclaimer & FSG. All services are provided by Stockopedia Ltd, United Kingdom (company number 06367267). For Australian users: Stockopedia Ltd, ABN 39 757 874 670 is a Corporate Authorised Representative of Daylight Financial Group Pty Ltd ABN 77 633 984 773, AFSL 521404.