Saving your chart as a template
Before diving into the fun of Events, Drawing Tools, Overlays and Indicators, it’s important to know how to save your own Chart Templates.
Everybody has own individual preferences for how they like to view their charts. With the option to save chart templates, you’ll be able to load up your favourite customised views at any time.
Once you’ve set up a chart with customised types, periodicity, timeframes, events, indicators, overlays and settings, you can save the output as a ”Saved Template”. To get started click the Save Template button at the bottom right-hand side of the Bottom Toolbar.
You can save up to 5 Saved Templates, each of which can be applied with a couple of clicks of the mouse.

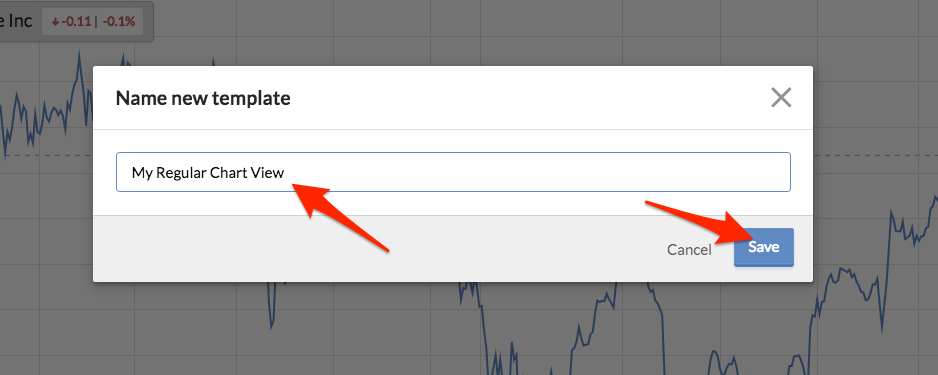
You’ll be presented with an option to name your template - don’t forget to click Save.
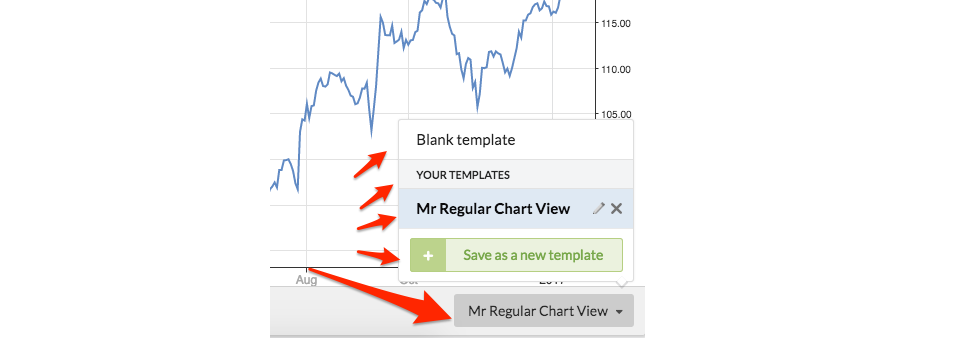
Your template settings are now saved. You can login and logout and these templates will always remain saved. By default your last used template will be loaded every time you view a new Chart.
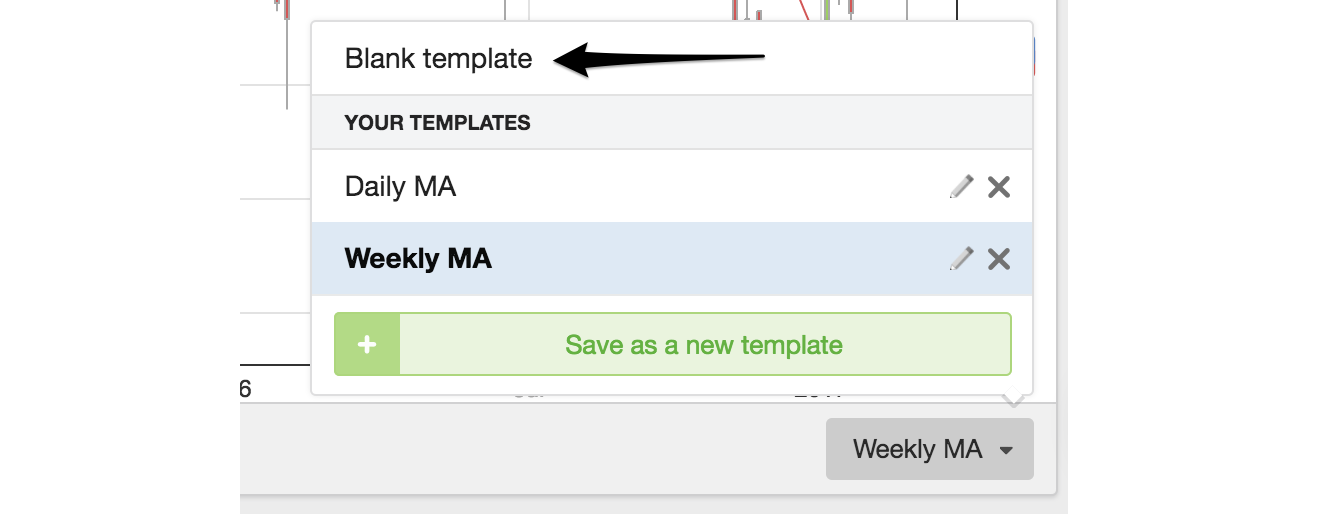
You can create multiple templates and switch between them using the menu at the bottom of the chart interface.
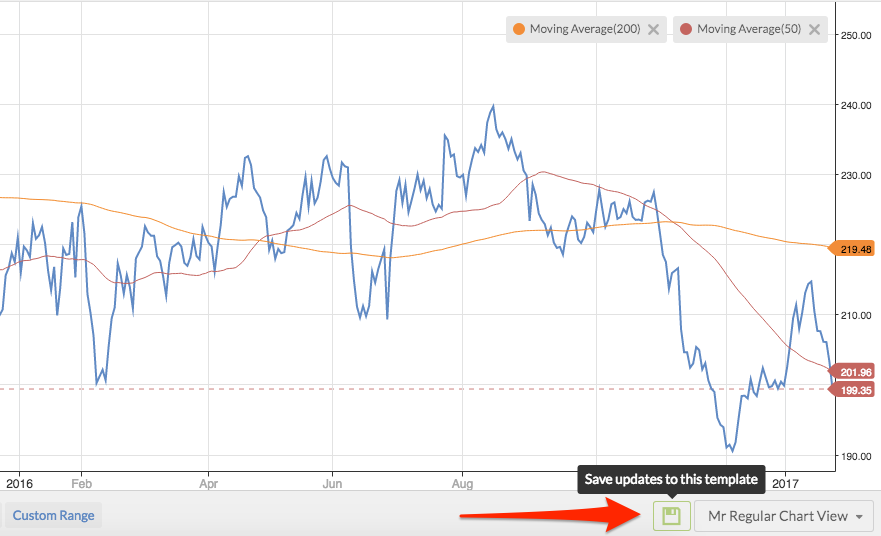
If you find that you want to make changes to one of your templates, that’s no problem. By adding or removing features from a chart, you’ll automatically get the option to save those changes in the template. Just click the green save icon that appears as soon as you’ve made changes.
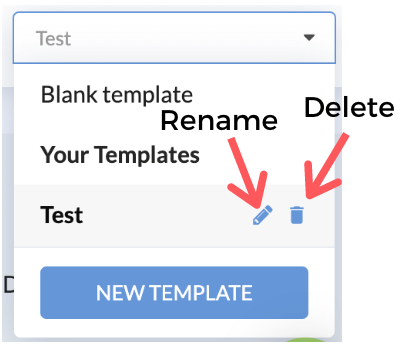
You can also rename or delete a saved template by clicking the pencil or cross icon that appears in the templates menu.
If you want to start from a completely blank template, rather than deleting all your carefully added studies, you can use the “Blank Template” option.
