Stochastics

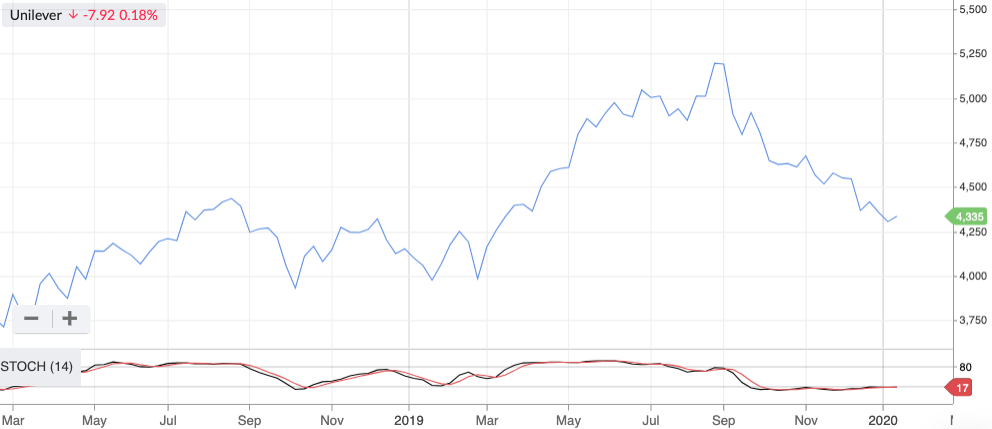
The Stochastic Oscillator is a momentum indicator that measures where a stock price is in relation to its recent trading range.

Usually, the calculation uses a 14-day trading period. This is then ‘smoothed’ by taking a 3-day moving average of that 14-day range. Both lines are shown on the Stochastics chart. All the inputs into the Stochastics calculation can be adjusted in the settings modal.
69ccc78b089a3d4a8e40bc16cd4521b33177b6141579014118.png

Both Stochastics lines oscillate on a vertical scale of 0 to 100. A stock may be considered to be overbought (or oversold) when the oscillator moves above 80 (or below 20).


© Stockopedia 2026, Refinitiv, Share Data Services.

*Past performance is no indicator of future performance. Performance returns are based on hypothetical scenarios and do not represent an actual investment.

This site cannot substitute for professional investment advice or independent factual verification. To use Stockopedia, you must accept our Terms of Use, Privacy and Disclaimer & FSG. All services are provided by Stockopedia Ltd, United Kingdom (company number 06367267). For Australian users: Stockopedia Ltd, ABN 39 757 874 670 is a Corporate Authorised Representative of Daylight Financial Group Pty Ltd ABN 77 633 984 773, AFSL 521404.