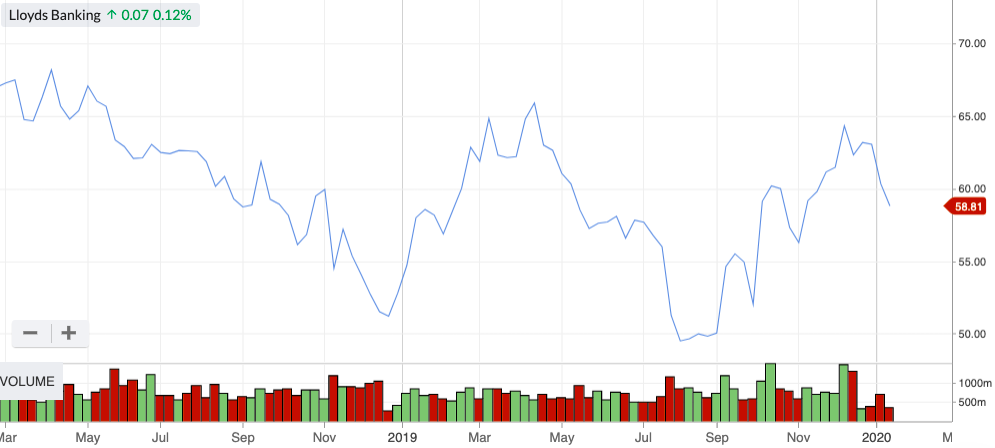
Volume Chart

The Volume Chart shows the number of shares that have been traded over a given period. Volume is measured from close-to-close. When the price closes below the previous close, the volume bar is red. When the price closes above its previous close, the bar is green

Volume data can give an indication of whether price trends are sustainable. If an uptrend is accompanied by rising volume, this could indicate that a growing number of bullish investors are buying the stock. The price trend could therefore be more sustainable.

On the other hand, there are typically less active market participants during bearish phases. Therefore, if trading volume is falling or steady, it could signal that a market is becoming exhausted and a price reversal is around the corner.

f5baa18a720bbb70a250f8a4436bd0e0d72260a11579014876.png


A subscription to Stockopedia will be one of the best investments you'll ever make...

Here's what you'll get:
A decade of research into what works in stock markets
Millions of pounds of platform investment
Countless hours of research time saved
Access to hundreds of educational articles and ebooks
Over 30 talented professionals working flat out for you
A team of the very best bloggers acting as mentors
Saving you thousands in advisory fees every year
Stockopedia is the perfect solution for the time-poor individual investor looking for results
Starting at just £295 per year

After your free trial, plans start at just £295 per year. With a one month money back guarantee, there's no risk.

© Stockopedia 2024, Refinitiv, Share Data Services.

*Past performance is no indicator of future performance. Performance returns are based on hypothetical scenarios and do not represent an actual investment.

This site cannot substitute for professional investment advice or independent factual verification. To use Stockopedia, you must accept our Terms of Use, Privacy and Disclaimer & FSG. All services are provided by Stockopedia Ltd, United Kingdom (company number 06367267). For Australian users: Stockopedia Ltd, ABN 39 757 874 670 is a Corporate Authorised Representative of Daylight Financial Group Pty Ltd ABN 77 633 984 773, AFSL 521404.