Reviewing your folio diversification
Stockopedia’s Folio Allocation report offers a snapshot of the diversification and weights of the positions in a folio across sectors and styles versus the market.
Diversification is about managing the risk of being over-exposed to certain sectors at the wrong time. The Allocation Report shows you exactly which sectors you are overweighting versus the index and which stocks are below or above target allocations. It can help you find your blind spots faster.
Lets explore how to use these tools.
Finding the Folio Allocation Report
The Allocation Report can be found as a tab on any of your Folios. You can access any of your folios by click on Folios in the navigation bar and selecting one of your Folios.
Once you’re in the Folios section, the Allocation Report can be found by clicking the Allocation tab.
Exploring the Report
The Allocation report consists of four key sections:
- Sector Breakdown
- Sector Weight vs Market
- Style Composition
- Position Weights vs Limits
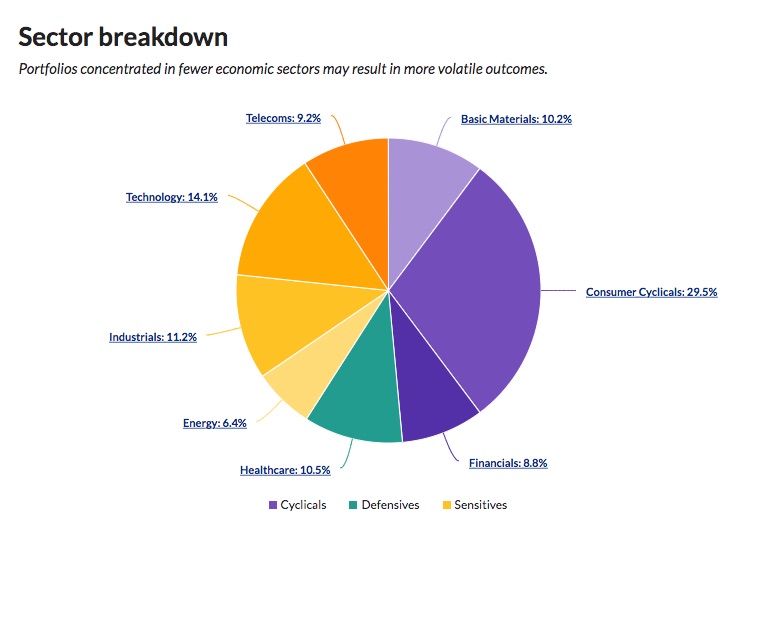
1. Sector Breakdown
Sector Analysis is displayed as a pie chart. The chart shows the weighting of the portfolio across the 10 different Economic Sectors in the Stockopedia taxonomy. It also provides insight to the Super-Sectors breakdown (Cyclicals, Defensives and Sensitives) of the portfolio via the colouring.
 By clicking an individual section of the pie chart, it will switch view to show the specific folio holdings that are represented in that Economic Sector. The breadth of each pie chart slice represents the size of each holding.
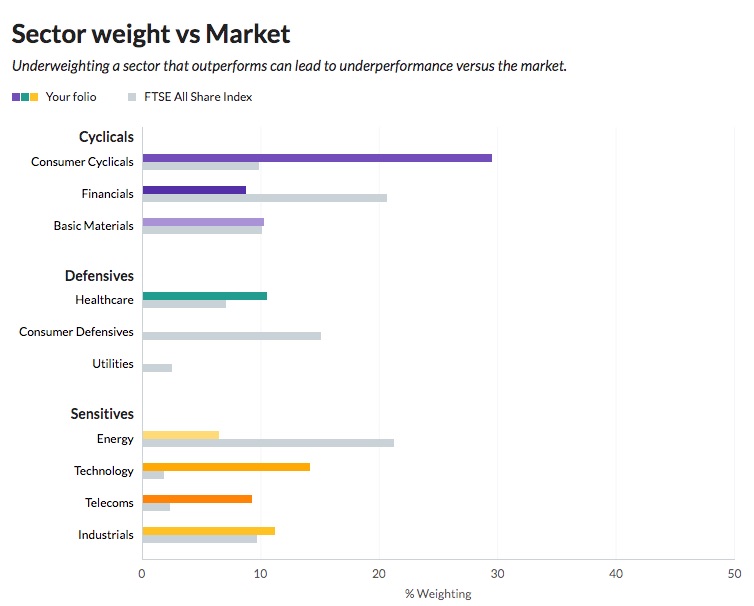
2. Sector Weights vs. Market
The Sector Weights table shows the weighting of the sectors in the folio versus the benchmark market average.
By comparing your folio sector exposure to the market you can assess your likely divergence from the benchmark. Some investors may deliberately overweight certain sectors to take advantage of perceived market moves before they occur.
Of course the further you diverge from the market portfolio the more likely it is that your portfolio may have a period of significant divergent relative performance. Modern Portfolio Theory has shown that being diversified across different sectors can increase the return received for the risk taken. What this means is that portfolio volatility can be reduced by owning uncorrelated business sectors.

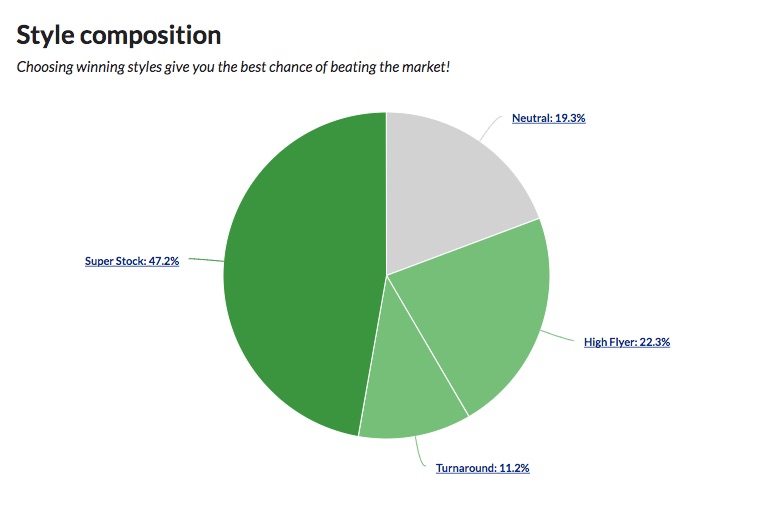
3. Style Composition
Similarly to the Sector Breakdown, the Style Composition is displayed as a pie chart. This shows the breakdown of your portfolio in terms of the Stockopedia styles as outlined in 'The StockRank Styles'. This can highlight the proportion of your portfolio allocated to winning/losing styles. The larger the proportion allocated to winning styles, the more exposure your portfolio is likely to have to Value, Quality & Momentum factors.

By clicking an individual section of the pie chart, it will switch view to show the specific folio holdings that are represented in that Style. The breadth of each pie chart slice represents the size of each holding.
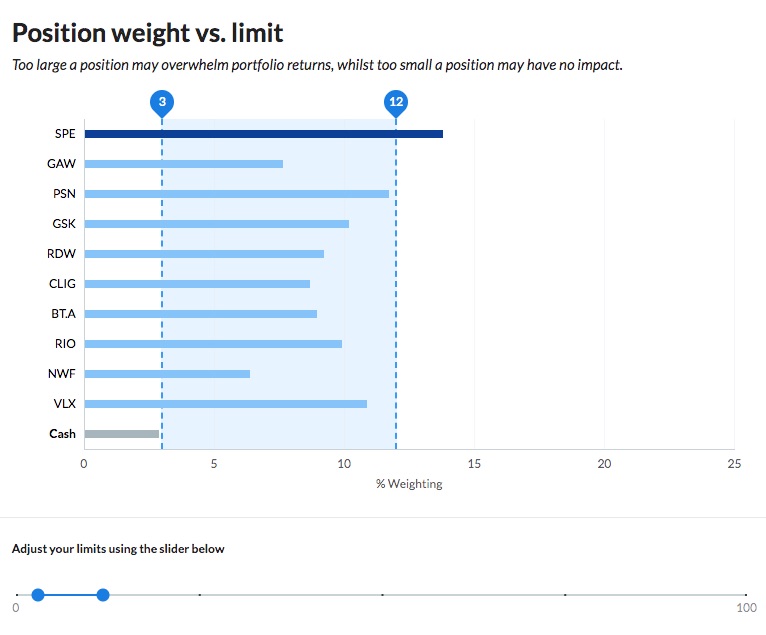
4. Position Weights vs. Limits
The Position Weights vs. Limits chart shows the percentage position weights of the individual securities in the Folio versus your defined size limits.

When a position breaches either the minimum or maximum percentage threshold it may be a signal to rebalance the position.
To edit your maximum and minimum position limits, simply move the slider below the chart to your desired minimum and maximum position sizes (as shown in the blue circles). Any positions that are either smaller or larger than these limits will be marked by a dark blue bar.

