Reviewing your folio performance
Stockopedia provides you the tool to look into your investment performance and compare this versus benchmarks and other fund managers.
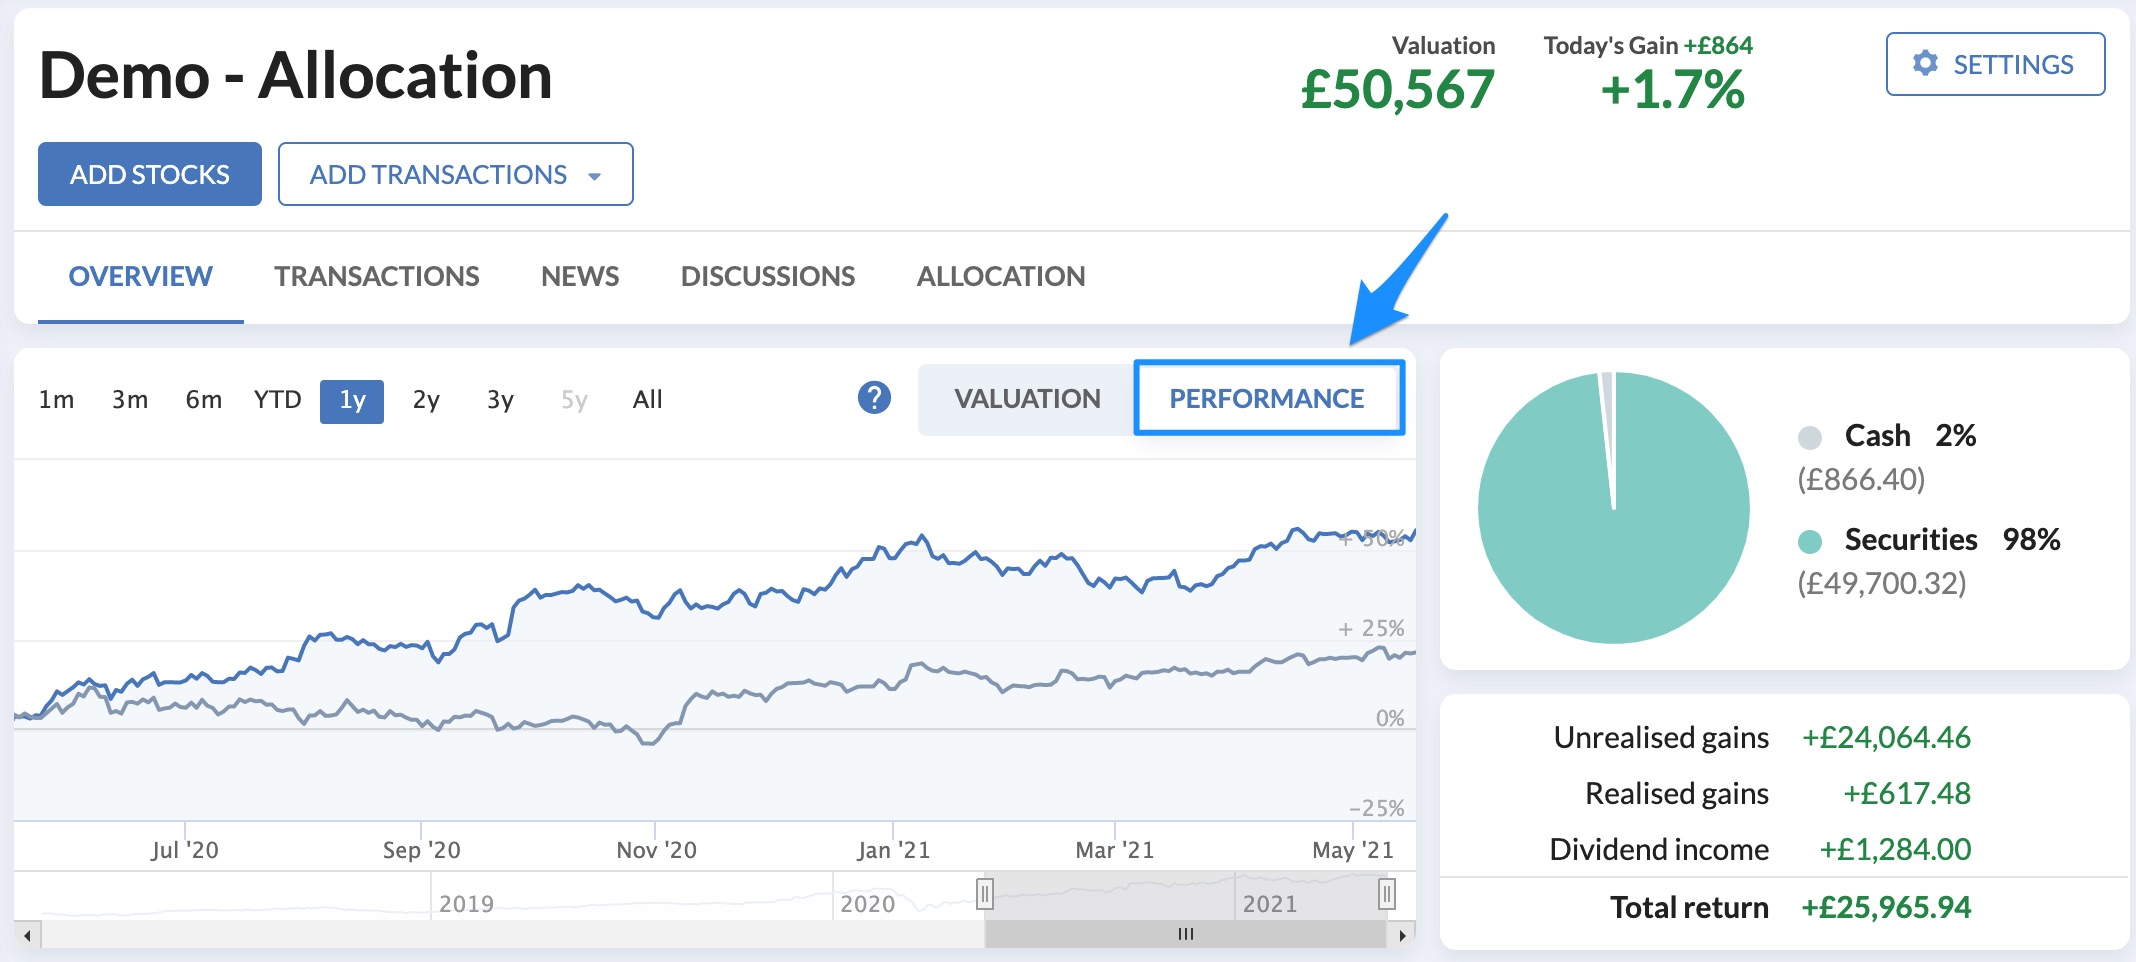
You can find the time-weighted return of your portfolio by clicking on the Performance tab on the chart as shown below. From here you can select from time periods along the top of the chart to see performance over different timeframes. You can also use the slider at the bottom of the chart to select custom periods.

What is Time-Weighted Return?
Time weighted return is a way of calculating the performance of investments ignoring the impacts of cash deposits and withdrawals. This means that it isolates the investment performance of the portfolio rather than external factors of changes in cash, meaning your returns are not penalised if you needed to draw out funds to pay for retirement or only drip feed in cash into your portfolio from salary over time.
This means that your investment performance can be fairly compared against fund managers or benchmarks/indices as the performance shown for these is also agnostic of cashflows.
How is Time-Weighted Return calculated?
For each day in the portfolio history we are doing the following calculation:
Today's Valuation/(Yesterday's Valuation + Today's Net User_Cashflows*)
*User_Cashflows = Deposit (positive) or Withdrawal (negative)
Doing this throughout the history creates a geometric series which means that we can then compare the return over the period on any two dates.
An easy-button to transform how you see your portfolio
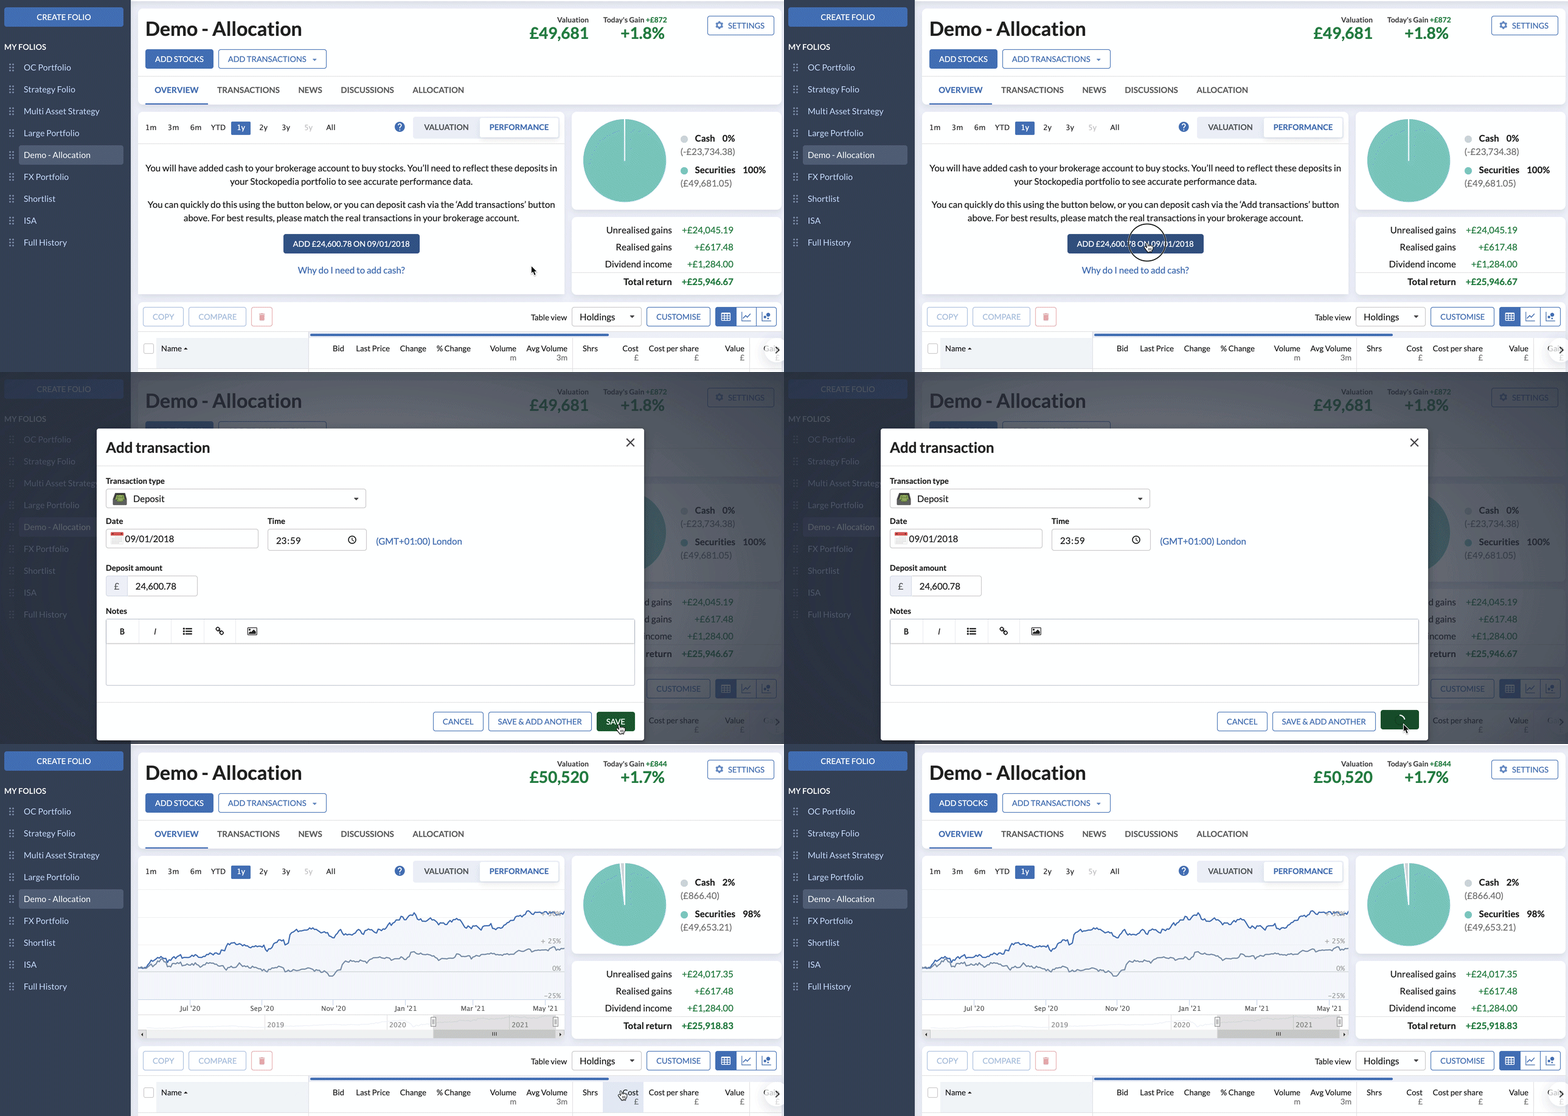
To take advantage of this new feature, the only requirement is to ensure that cash movements are recorded in your portfolio transactions which is essential for the calculations as explained here. But even if you haven't got the precise records, the new performance chart will do the maths for you by suggesting a "starting cash deposit".
Obviously, the more detailed you are with recording cash inflows and outflows, the more accurate the performance chart will be. But even by using the suggested "starting cash deposit" you'll instantly have a much more accurate view of your underlying portfolio performance.


