Adding chart overlays & indicators
If you are starting out in Technical Analysis it can be easy to get bewildered by the hundreds of technical studies, indicators & systems that have been invented. The reality is that most studies fall into a range of categories designed to assess some simple aspects of price and volume.
We’ve curated a selection of technical studies into our library which can be added either as:
- ‘Overlays’ displayed over the main price chart, or…
- ‘Indicators’ as separate charts below the main price chart.
These can be added from their dedicated menu buttons in the top navigation bar. Each dropdown menu, triggered by a click, contains many individual studies. Similar indicators are grouped into categories.
We’ve created separate articles for every technical overlay and study in the package. Please do explore them in the upcoming sections.
Remember! All overlays and indicators respect the periodicity of the main price chart. If you do switch from daily to weekly periodicity remember that your indicators will not remain as daily indicators. So a 200 period Moving Average will turn from being a daily to a weekly indicator and require adjusting (e.g. to a 50 week MA). It is best to create saved templates of favoured chart settings.
Inline Descriptions
Before you dig into the individual articles, please note that you can popup an inline description of any of the technical overlays or indicators in the Charts interface. As you hover over any of the study names you will see a small grey info icon on the right of the row. Click it and a modal window opens with the description.
Overlays
The Overlays menu gives you the option to plot a variety of studies over the top of the main price chart…. from basic studies such as Moving Averages to comprehensive systems like Donchian Channels.
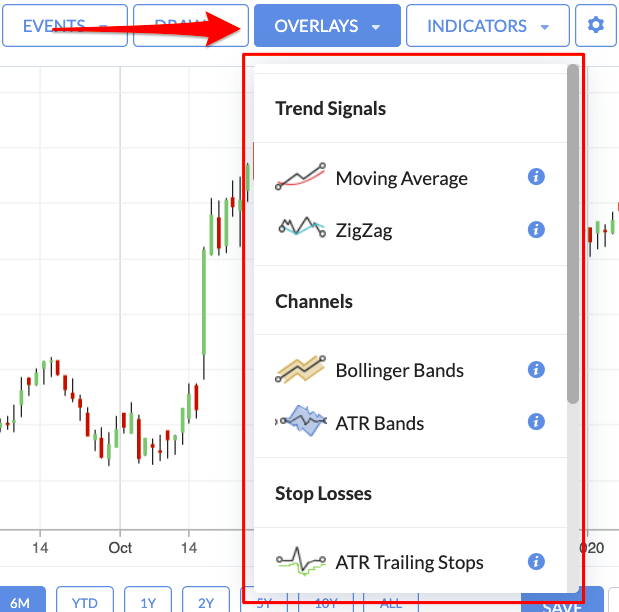
All the overlays come with default settings & colours, which customised through a modal settings form. To customise, just click the link of the Overlay in the top-right hand side of the chart to launch the settings modal, where you can make adjustments.
Overlays currently included are listed here.
Indicators
Stockopedia charts also include a range of Indicators that can help identify and predict trends based on price and volume behaviour.
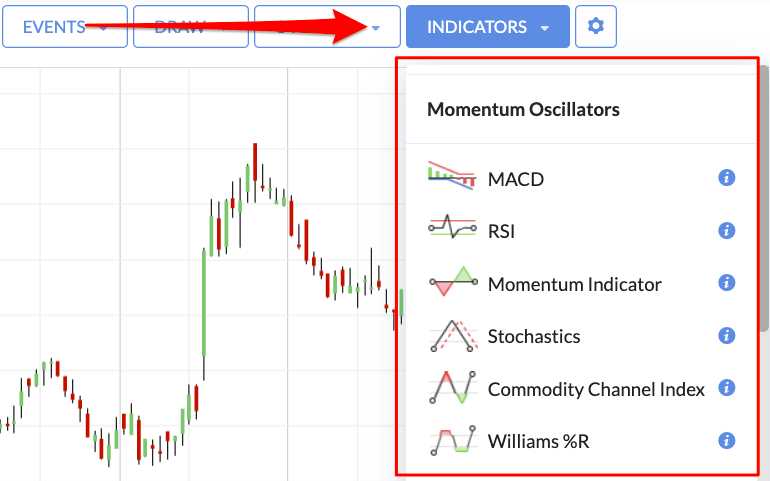
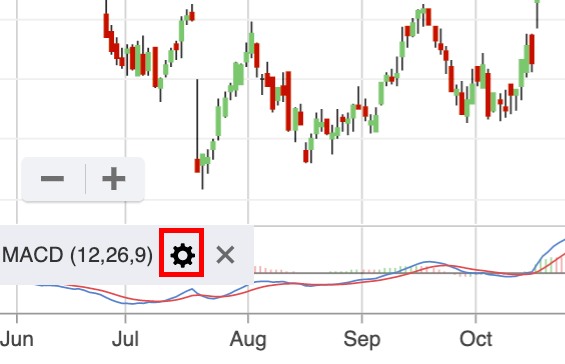
In many cases the default settings for these Indicators can be customised. To do this, add the Indicator from the menu and then click its name in the chart to reveal the Settings ‘cog’, which you can click to launch the settings modal.
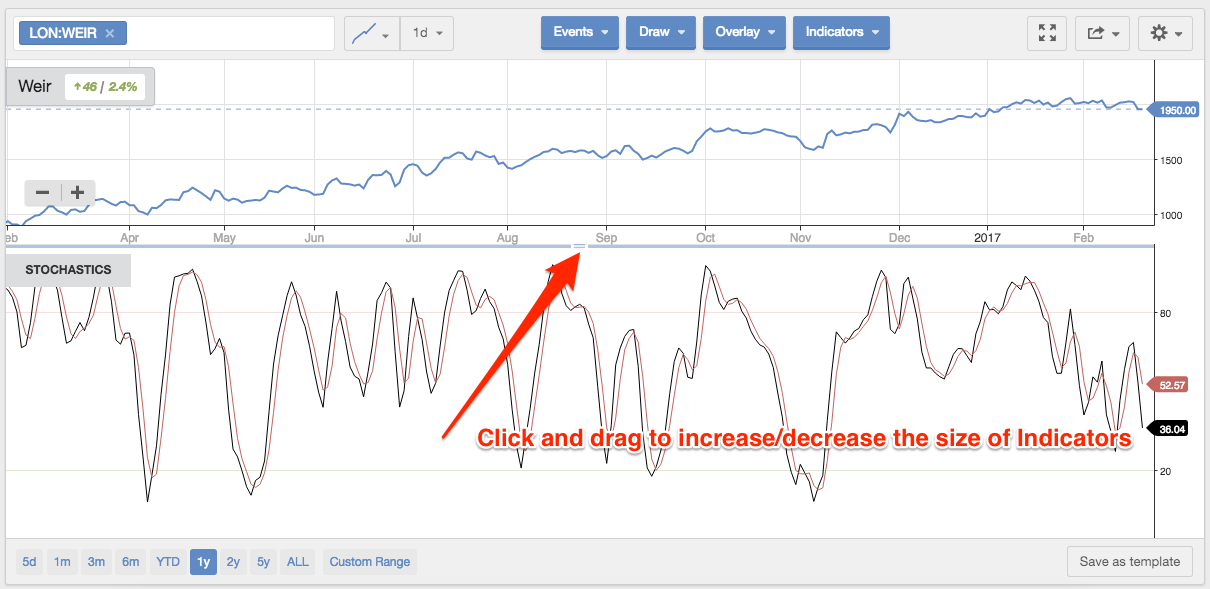
In addition, it’s possible to increase or decrease the size of Indicators by using the ‘hidden’ resizing bar between the main price chart and the indicator. Click and drag to resize.
Indicators currently included are listed here.

